Petrobras: diesel up 45% yet EBITDA flat year on year – profit rests on volumes and one-offs, not on price
Contents
On 14 November Petrobras released its third-quarter 2026 results. The average diesel price in the period was 5.454 USD against 3.754 USD a year earlier (+45.3%), WTI – 85.4 USD against 64.9 USD (+31.7%). Revenue rose 38.7% to 32,962 million USD, but EBITDA added only 0.1% to 12,282 million USD, while net profit rose 26.8% to 7,740 million USD. At the period's prices and year-ago volumes and costs, our calculation puts EBITDA at 17,447.4 million USD – the company earned 5,165.4 million USD less than the price implied. Our conclusion: rather unattractive – on the portal's model the share trades 29% above fair value. Our view: the share is rather unattractive at the current price; upside on the portal model -29%.
Our view: is there upside
Our view in numbers
| Metric | Our read |
|---|---|
| Verdict | Rather unattractive |
| Upside on the portal model | -29% |
| How the model works | spot model: EBITDA re-priced to current commodity prices at the target EV/EBITDA, against market cap |
| EV/EBITDA now and 3-year average | 4.5 vs 3.3 – a 36% premium to its history |
| Dividend yield, 12m | 4.3% |
| Net debt / EBITDA | 1.45 – low leverage |
| Strongest case for | At current prices EBITDA would be 63,748.4 million USD, and debt at 1.45x LTM EBITDA falls to 0.88x – the balance sheet withstands even a weak quarter. |
| Strongest case against | On the portal's model the share trades 29% above fair value, and EV/EBITDA of 4.5 against a three-year average of 3.3 is a 36% premium. |
| What would change the view | A return of unit costs to a level at which EBITDA at current prices reaches 17,447.4 million USD would move the verdict one step higher. |
Key takeaways
— Diesel and WTI rose 45.3% and 31.7%, yet revenue grew only 38.7% – the price backdrop was stronger than what reached the top line
— At the period's prices our calculation puts EBITDA at 17,447.4 million USD, but reported EBITDA was 12,282 million USD – a 5,165.4 million USD gap eaten by volumes, realised price and unit costs
— The EBITDA margin fell from 51.6% to 37.3% while commodity prices rose – cost inflation and realised price outran the benchmark
— Net profit added 26.8% on almost flat EBITDA – the difference came from items below operating profit, not from the core business
— Debt at 1.45x LTM EBITDA is a moderate level, and at current-price EBITDA of 63,748.4 million USD it falls to 0.88x, leaving headroom
— EV/EBITDA LTM of 4.5 against its own three-year average of 3.3 is a 36% premium – the share is more expensive than its history
— A dividend yield of 4.35% on P/E LTM of 5.6 is modest for such profit, and that is the main argument against
Key figures, USD bn
| Metric | Q3 2025 | Q3 2026 | Change |
|---|---|---|---|
| Revenue | 23.8 | 33.0 | +38.7% |
| EBITDA | 12.3 | 12.3 | +0.1% |
| Operating profit | 8.11 | 12.9 | +59.4% |
| Net profit | 6.10 | 7.74 | +26.8% |
| Operating cash flow | 9.97 | — | — |
| Capex | 4.95 | — | — |
| EBITDA margin | 51.6% | 37.3% | -14.3 pp |
| Net margin | 25.7% | 23.5% | -2.2 pp |
Diesel and WTI rose 45.3% and 31.7%, yet revenue grew only 38.7% – the price backdrop was stronger than what reached the top line
The average diesel price in the third quarter of 2026 was 5.454 USD against 3.754 USD a year earlier, up 45.3%. WTI averaged 85.4 USD against 64.9 USD, up 31.7%. Gasoline, by contrast, fell 6.2% to 3.143 USD. Diesel and WTI account for 58% of sales in the portal model, so the price backdrop was markedly better than a year ago.
Revenue in the reported quarter rose 38.7% to 32,962 million USD. That is less than the gain in diesel and WTI, but more than gasoline alone would have delivered. Quarter on quarter growth decelerated: in the second quarter of 2026 revenue added 56.2%, in the third – 38.7%. The deceleration reflects WTI averaging 92.8 USD in the second quarter against 85.4 USD in the third, 7.9% lower.
Spot is now above the quarterly average: diesel at 6.127 USD on 14 November (+12.3% to the average), WTI at 88.9 USD (+4.1%). That supports next quarter's revenue but does not change the picture of the reported one: the price was high, yet revenue grew more slowly than the price.
Commodity prices: period average and now
| Benchmark | Year ago | Q3 2026 | YoY | Spot 2026-11-14 |
|---|---|---|---|---|
| US Diesel Index (EIA), USD | 3,75 | 5,45 | +45,3% | 6,13 |
| WTI, USD | 64,9 | 85,4 | +31,7% | 88,9 |
| US Gasoline Index (EIA), USD | 3,35 | 3,14 | -6,2% | 3,06 |
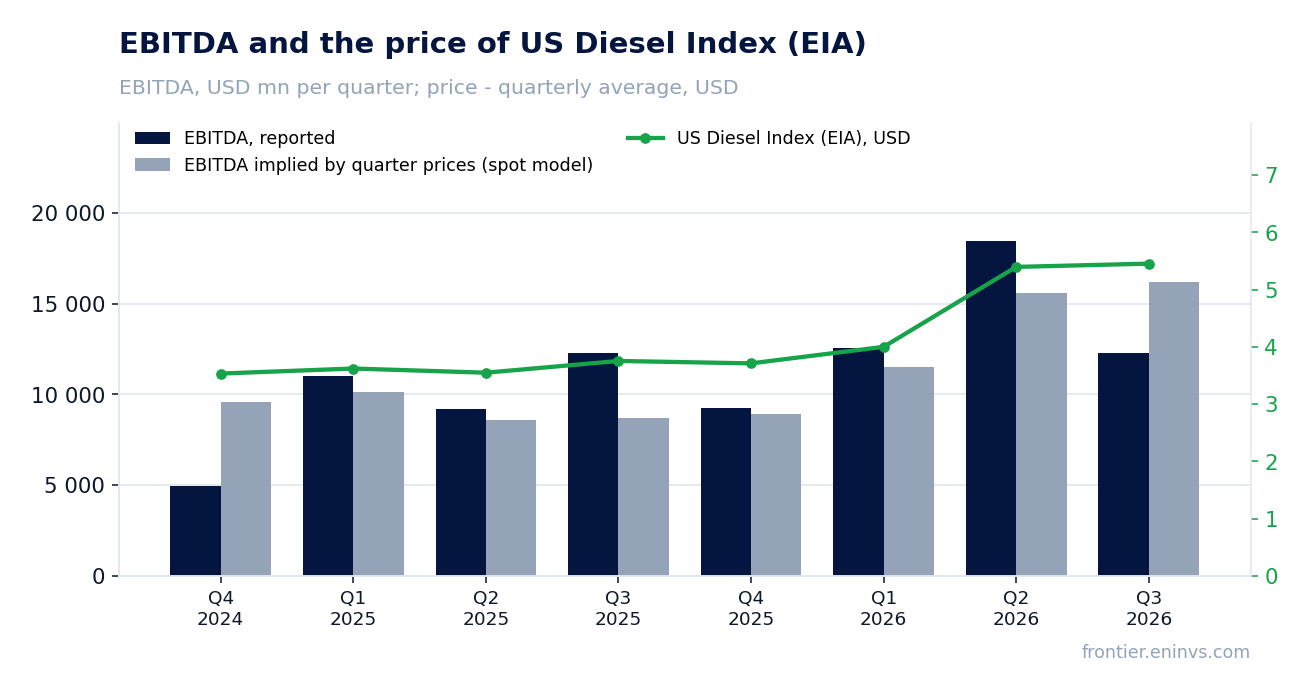
At the period's prices our calculation puts EBITDA at 17,447.4 million USD, but reported EBITDA was 12,282 million USD – a 5,165.4 million USD gap eaten by volumes, realised price and unit costs
Holding third-quarter 2025 volumes and non-commodity costs and moving only the reported period's prices, revenue would have been 28,945.3 million USD (price effect +5,179.8 million USD, +21.8%) and EBITDA 17,447.4 million USD. Actual revenue was 32,962 million USD, 4,016.7 million USD above the implied figure, while EBITDA was 12,282 million USD, 5,165.4 million USD below. Sales delivered more than the price promised; profit delivered markedly less.
An EBITDA gap alongside higher revenue means unit costs rose. The report does not disclose which line absorbed the difference, but the arithmetic is unambiguous: with revenue 13.9% above the implied level, EBITDA is 29.6% below. It could be cash cost, production taxes or transportation – those lines are not in the facts, so we will not name a specific cause.
The portal's spot model, built from the average of the previous four quarters, expected EBITDA of 16,211 million USD and revenue of 29,826.8 million USD. Actual EBITDA is 24.2% below the model, revenue 10.5% above. In the four preceding periods the deviation was positive: +40.9%, +3.2%, +9.1%, +18.6%. That reversal says the quarter breaks the pattern rather than extends it.
What the prices implied and what the company earned
| Base (Q3 2025) | Implied at period prices | Reported | Reported vs implied | |
|---|---|---|---|---|
| Revenue, USD mn | 23 766 | 28 945 | 32 962 | +13,9% |
| EBITDA, USD mn | 12 268 | 17 447 | 12 282 | -29,6% |
| EBITDA, portal spot model, USD mn | — | 16 211 | 12 282 | -24,2% |
Revenue and EBITDA by quarter
| Period | Measure | bn USD |
|---|---|---|
| Q4 2024 | Revenue | 12.166799999999999 |
| Q1 2025 | Revenue | 21.911744 |
| Q2 2025 | Revenue | 21.366719 |
| Q3 2025 | Revenue | 23.765515 |
| Q4 2025 | Revenue | 23.259010999999997 |
| Q1 2026 | Revenue | 24.650921999999998 |
| Q2 2026 | Revenue | 33.384532 |
| Q3 2026 | Revenue | 32.962 |
| Q4 2024 | EBITDA | 4.961557 |
| Q1 2025 | EBITDA | 11.034876 |
| Q2 2025 | EBITDA | 9.222657 |
| Q3 2025 | EBITDA | 12.267559 |
| Q4 2025 | EBITDA | 9.231949 |
| Q1 2026 | EBITDA | 12.532935 |
| Q2 2026 | EBITDA | 18.483094 |
| Q3 2026 | EBITDA | 12.282 |
EBITDA margin
| Period | Measure | % |
|---|---|---|
| Q4 2024 | EBITDA margin | 40.8 |
| Q1 2025 | EBITDA margin | 50.4 |
| Q2 2025 | EBITDA margin | 43.2 |
| Q3 2025 | EBITDA margin | 51.6 |
| Q4 2025 | EBITDA margin | 39.7 |
| Q1 2026 | EBITDA margin | 50.8 |
| Q2 2026 | EBITDA margin | 55.4 |
| Q3 2026 | EBITDA margin | 37.3 |
The EBITDA margin fell from 51.6% to 37.3% while commodity prices rose – cost inflation and realised price outran the benchmark
The EBITDA margin in the reported quarter was 37.3% against 51.6% a year earlier. A 14.3 percentage point fall with diesel up 45.3% and WTI up 31.7% is not a price story. Had the margin held, EBITDA on revenue of 32,962 million USD would have been around 17,000 million USD – close to our implied 17,447.4 million USD.
The margin compresses when revenue per barrel rises more slowly than cost per barrel. The facts give no production or unit-cost data, so we cannot say what became more expensive. But the combination of revenue above the implied level and EBITDA below it leaves only one option: unit costs rose faster than the realised price.
For the next quarter this is the key question. If unit costs stay at the third-quarter level, even spot diesel at 6.127 USD will not bring the margin back to 50%. If costs normalise, EBITDA at current prices could close in on the implied 17,447.4 million USD.
Net profit added 26.8% on almost flat EBITDA – the difference came from items below operating profit, not from the core business
Net profit in the reported quarter was 7,740 million USD against 6,103.1 million USD a year earlier, up 26.8%. EBITDA over the same period rose only 0.1% to 12,282 million USD. Operating profit was 12,925 million USD – above EBITDA, which is unusual and points to items between the two lines, though the facts do not give their composition.
Profit growth of 26.8% on flat EBITDA means items below operating profit supported it: financial result, taxes or one-off gains. The facts give no breakdown, so we record the fact itself: profit grew not from the core business but from what came after it.
The net margin fell from 25.7% to 23.5%, so profit grew more slowly than revenue. That is consistent with the EBITDA margin compression: the core business earned less, and profit was pulled up by items below the operating line.
Debt at 1.45x LTM EBITDA is a moderate level, and at current-price EBITDA of 63,748.4 million USD it falls to 0.88x, leaving headroom
Net debt at the latest reporting date was 56,361.6 million USD against LTM EBITDA of 38,833.5 million USD. The ratio is 1.45x. That is a moderate level for an oil and gas company and puts no pressure on the balance sheet.
On the portal's spot model, annual EBITDA at current prices would be 63,748.4 million USD against model LTM EBITDA of 52,530 million USD. On that base the net debt to EBITDA ratio falls to 0.88x. That is an important argument: if prices hold, leverage quickly becomes a secondary issue.
Free cash flow is not disclosed in the facts for the reported quarter, so we cannot judge how much the company spends to sustain production. But with quarterly EBITDA of 12,282 million USD and debt of 56,361.6 million USD, the balance sheet stays manageable even with high capex.
Valuation vs its own history
now vs the 3-year average
| Period | Measure | × |
|---|---|---|
| EV/EBITDA | Now | 4.494867643549799 |
| EV/EBITDA | 3-year average | 3.314451322434292 |
EV/EBITDA LTM of 4.5 against its own three-year average of 3.3 is a 36% premium – the share is more expensive than its history
EV/EBITDA over the last twelve months is 4.5 against its own three-year average of 3.3. That is a 36% premium. The market values the company above where it has stood for three years, and the room for re-rating upward is reduced.
P/E LTM is 5.6, which is not high for an oil and gas company. But P/E is based on profit that in the third quarter grew from items below operating profit, not from EBITDA. EV/EBITDA is the fairer measure here: it shows the core business is valued above its own history.
On the portal's model, re-pricing EBITDA to current prices at the target EV/EBITDA puts the share 29% above fair value. That is the main argument against: even with high current-price EBITDA of 63,748.4 million USD, the market has already priced in more than the model considers justified.
Share price, three years
close, last point 2026-11-13
| Period | Measure | USD per share |
|---|---|---|
| 2025-11-14 | Closing price | 13.180000305175781 |
| 2025-11-17 | Closing price | 13.119999885559082 |
| 2025-11-18 | Closing price | 13.130000114440918 |
| 2025-11-19 | Closing price | 13.020000457763672 |
| 2025-11-20 | Closing price | 12.779999732971191 |
| 2025-11-21 | Closing price | 12.760000228881836 |
| 2025-11-24 | Closing price | 12.75 |
| 2025-11-25 | Closing price | 12.619999885559082 |
| 2025-11-26 | Closing price | 12.65999984741211 |
| 2025-11-28 | Closing price | 12.539999961853027 |
| 2025-12-01 | Closing price | 12.550000190734863 |
| 2025-12-02 | Closing price | 12.609999656677246 |
| 2025-12-03 | Closing price | 12.800000190734863 |
| 2025-12-04 | Closing price | 12.880000114440918 |
| 2025-12-05 | Closing price | 12.130000114440918 |
| 2025-12-08 | Closing price | 12.239999771118164 |
| 2025-12-09 | Closing price | 12.319999694824219 |
| 2025-12-10 | Closing price | 12.229999542236328 |
| 2025-12-11 | Closing price | 12.149999618530273 |
| 2025-12-12 | Closing price | 12.180000305175781 |
| 2025-12-15 | Closing price | 12.180000305175781 |
| 2025-12-16 | Closing price | 11.789999961853027 |
| 2025-12-17 | Closing price | 11.770000457763672 |
| 2025-12-18 | Closing price | 11.720000267028809 |
| 2025-12-19 | Closing price | 11.75 |
| 2025-12-22 | Closing price | 11.720000267028809 |
| 2025-12-23 | Closing price | 11.829999923706055 |
| 2025-12-24 | Closing price | 11.829999923706055 |
| 2025-12-26 | Closing price | 11.550000190734863 |
| 2025-12-29 | Closing price | 11.59000015258789 |
| 2025-12-30 | Closing price | 11.859999656677246 |
| 2025-12-31 | Closing price | 11.850000381469727 |
| 2026-01-02 | Closing price | 11.920000076293945 |
| 2026-01-05 | Closing price | 11.739999771118164 |
| 2026-01-06 | Closing price | 11.569999694824219 |
| 2026-01-07 | Closing price | 11.539999961853027 |
| 2026-01-08 | Closing price | 11.800000190734863 |
| 2026-01-09 | Closing price | 11.880000114440918 |
| 2026-01-12 | Closing price | 11.869999885559082 |
| 2026-01-13 | Closing price | 12.300000190734863 |
| 2026-01-14 | Closing price | 12.65999984741211 |
| 2026-01-15 | Closing price | 12.609999656677246 |
| 2026-01-16 | Closing price | 12.6899995803833 |
| 2026-01-20 | Closing price | 12.829999923706055 |
| 2026-01-21 | Closing price | 13.510000228881836 |
| 2026-01-22 | Closing price | 13.770000457763672 |
| 2026-01-23 | Closing price | 14.279999732971191 |
| 2026-01-26 | Closing price | 14.34000015258789 |
| 2026-01-27 | Closing price | 15.020000457763672 |
| 2026-01-28 | Closing price | 15.380000114440918 |
| 2026-01-29 | Closing price | 15.520000457763672 |
| 2026-01-30 | Closing price | 15.34000015258789 |
| 2026-02-02 | Closing price | 15.029999732971191 |
| 2026-02-03 | Closing price | 15.279999732971191 |
| 2026-02-04 | Closing price | 15.140000343322754 |
| 2026-02-05 | Closing price | 14.899999618530273 |
| 2026-02-06 | Closing price | 14.869999885559082 |
| 2026-02-09 | Closing price | 15.270000457763672 |
| 2026-02-10 | Closing price | 15.329999923706055 |
| 2026-02-11 | Closing price | 15.829999923706055 |
| 2026-02-12 | Closing price | 15.25 |
| 2026-02-13 | Closing price | 15.1899995803833 |
| 2026-02-17 | Closing price | 15.020000457763672 |
| 2026-02-18 | Closing price | 15.289999961853027 |
| 2026-02-19 | Closing price | 15.760000228881836 |
| 2026-02-20 | Closing price | 15.789999961853027 |
| 2026-02-23 | Closing price | 16.139999389648438 |
| 2026-02-24 | Closing price | 16.540000915527344 |
| 2026-02-25 | Closing price | 16.709999084472656 |
| 2026-02-26 | Closing price | 16.610000610351562 |
| 2026-02-27 | Closing price | 16.6299991607666 |
| 2026-03-02 | Closing price | 17.31999969482422 |
| 2026-03-03 | Closing price | 16.959999084472656 |
| 2026-03-04 | Closing price | 16.770000457763672 |
| 2026-03-05 | Closing price | 16.729999542236328 |
| 2026-03-06 | Closing price | 17.600000381469727 |
| 2026-03-09 | Closing price | 18.15999984741211 |
| 2026-03-10 | Closing price | 17.989999771118164 |
| 2026-03-11 | Closing price | 18.989999771118164 |
| 2026-03-12 | Closing price | 18.969999313354492 |
| 2026-03-13 | Closing price | 18.56999969482422 |
| 2026-03-16 | Closing price | 19.170000076293945 |
| 2026-03-17 | Closing price | 19.510000228881836 |
| 2026-03-18 | Closing price | 19.770000457763672 |
| 2026-03-19 | Closing price | 19.780000686645508 |
| 2026-03-20 | Closing price | 18.799999237060547 |
| 2026-03-23 | Closing price | 19.270000457763672 |
| 2026-03-24 | Closing price | 19.75 |
| 2026-03-25 | Closing price | 19.81999969482422 |
| 2026-03-26 | Closing price | 20.329999923706055 |
| 2026-03-27 | Closing price | 20.770000457763672 |
| 2026-03-30 | Closing price | 20.809999465942383 |
| 2026-03-31 | Closing price | 20.75 |
| 2026-04-01 | Closing price | 20.079999923706055 |
| 2026-04-02 | Closing price | 20.559999465942383 |
| 2026-04-06 | Closing price | 20.860000610351562 |
| 2026-04-07 | Closing price | 20.709999084472656 |
| 2026-04-08 | Closing price | 19.979999542236328 |
| 2026-04-09 | Closing price | 20.690000534057617 |
| 2026-04-10 | Closing price | 21.510000228881836 |
| 2026-04-13 | Closing price | 21.969999313354492 |
| 2026-04-14 | Closing price | 21.010000228881836 |
| 2026-04-15 | Closing price | 20.540000915527344 |
| 2026-04-16 | Closing price | 21.5 |
| 2026-04-17 | Closing price | 20.450000762939453 |
| 2026-04-20 | Closing price | 20.760000228881836 |
| 2026-04-21 | Closing price | 21.149999618530273 |
| 2026-04-22 | Closing price | 21.18000030517578 |
| 2026-04-23 | Closing price | 21.270000457763672 |
| 2026-04-24 | Closing price | 20.8700008392334 |
| 2026-04-27 | Closing price | 20.959999084472656 |
| 2026-04-28 | Closing price | 21.229999542236328 |
| 2026-04-29 | Closing price | 21.850000381469727 |
| 2026-04-30 | Closing price | 22.030000686645508 |
| 2026-05-01 | Closing price | 21.899999618530273 |
| 2026-05-04 | Closing price | 22.010000228881836 |
| 2026-05-05 | Closing price | 21.770000457763672 |
| 2026-05-06 | Closing price | 20.90999984741211 |
| 2026-05-07 | Closing price | 20.3700008392334 |
| 2026-05-08 | Closing price | 20.329999923706055 |
| 2026-05-11 | Closing price | 20.75 |
| 2026-05-12 | Closing price | 20.5 |
| 2026-05-13 | Closing price | 19.59000015258789 |
| 2026-05-14 | Closing price | 19.780000686645508 |
| 2026-05-15 | Closing price | 19.93000030517578 |
| 2026-05-18 | Closing price | 20.700000762939453 |
| 2026-05-19 | Closing price | 20.40999984741211 |
| 2026-05-20 | Closing price | 19.829999923706055 |
| 2026-05-21 | Closing price | 20.030000686645508 |
| 2026-05-22 | Closing price | 19.899999618530273 |
| 2026-05-26 | Closing price | 19.399999618530273 |
| 2026-05-27 | Closing price | 18.959999084472656 |
| 2026-05-28 | Closing price | 18.829999923706055 |
| 2026-05-29 | Closing price | 18.770000457763672 |
| 2026-06-01 | Closing price | 18.860000610351562 |
| 2026-06-02 | Closing price | 18.719999313354492 |
| 2026-06-03 | Closing price | 18.190000534057617 |
| 2026-06-04 | Closing price | 18.059999465942383 |
| 2026-06-05 | Closing price | 17.75 |
| 2026-06-08 | Closing price | 17.75 |
| 2026-06-09 | Closing price | 17.81999969482422 |
| 2026-06-10 | Closing price | 18.110000610351562 |
| 2026-06-11 | Closing price | 18.239999771118164 |
| 2026-06-12 | Closing price | 18.3799991607666 |
| 2026-06-15 | Closing price | 17.34000015258789 |
| 2026-06-16 | Closing price | 17.049999237060547 |
| 2026-06-17 | Closing price | 16.790000915527344 |
| 2026-06-18 | Closing price | 16.75 |
| 2026-06-22 | Closing price | 17.010000228881836 |
| 2026-06-23 | Closing price | 17.030000686645508 |
| 2026-06-24 | Closing price | 16.450000762939453 |
| 2026-06-25 | Closing price | 16.520000457763672 |
| 2026-06-26 | Closing price | 16.290000915527344 |
| 2026-06-29 | Closing price | 16.280000686645508 |
| 2026-06-30 | Closing price | 16.15999984741211 |
| 2026-07-01 | Closing price | 15.989999771118164 |
| 2026-07-02 | Closing price | 16.110000610351562 |
| 2026-07-06 | Closing price | 16.260000228881836 |
| 2026-07-07 | Closing price | 16.65999984741211 |
| 2026-07-08 | Closing price | 17.239999771118164 |
| 2026-07-09 | Closing price | 17.030000686645508 |
| 2026-07-10 | Closing price | 17.31999969482422 |
| 2026-07-13 | Closing price | 17.8799991607666 |
| 2026-07-14 | Closing price | 17.920000076293945 |
| 2026-07-15 | Closing price | 17.860000610351562 |
| 2026-07-16 | Closing price | 17.469999313354492 |
| 2026-07-17 | Closing price | 17.969999313354492 |
| 2026-07-20 | Closing price | 18.190000534057617 |
| 2026-07-21 | Closing price | 18.540000915527344 |
| 2026-07-22 | Closing price | 18.889999389648438 |
| 2026-07-23 | Closing price | 19.0 |
| 2026-07-24 | Closing price | 18.770000457763672 |
| 2026-07-27 | Closing price | 18.0 |
| 2026-07-28 | Closing price | 18.06999969482422 |
| 2026-07-29 | Closing price | 18.59000015258789 |
| 2026-07-30 | Closing price | 19.1200008392334 |
| 2026-07-31 | Closing price | 19.399999618530273 |
| 2026-08-03 | Closing price | 19.059999465942383 |
| 2026-08-04 | Closing price | 18.719999313354492 |
| 2026-08-05 | Closing price | 18.360000610351562 |
| 2026-08-06 | Closing price | 18.520000457763672 |
| 2026-08-07 | Closing price | 17.959999084472656 |
| 2026-08-10 | Closing price | 18.329999923706055 |
| 2026-08-11 | Closing price | 17.93000030517578 |
| 2026-08-12 | Closing price | 17.760000228881836 |
| 2026-08-13 | Closing price | 17.889999389648438 |
| 2026-08-14 | Closing price | 17.8799991607666 |
| 2026-08-17 | Closing price | 18.25 |
| 2026-08-18 | Closing price | 18.18000030517578 |
| 2026-08-19 | Closing price | 18.540000915527344 |
| 2026-08-20 | Closing price | 19.010000228881836 |
| 2026-08-21 | Closing price | 19.149999618530273 |
| 2026-08-24 | Closing price | 18.600000381469727 |
| 2026-08-25 | Closing price | 17.850000381469727 |
| 2026-08-26 | Closing price | 17.760000228881836 |
| 2026-08-27 | Closing price | 18.25 |
| 2026-08-28 | Closing price | 18.530000686645508 |
| 2026-08-31 | Closing price | 19.350000381469727 |
| 2026-09-01 | Closing price | 20.329999923706055 |
| 2026-09-02 | Closing price | 20.860000610351562 |
| 2026-09-03 | Closing price | 20.510000228881836 |
| 2026-09-04 | Closing price | 20.1200008392334 |
| 2026-09-08 | Closing price | 20.829999923706055 |
| 2026-09-09 | Closing price | 20.93000030517578 |
| 2026-09-10 | Closing price | 21.3799991607666 |
| 2026-09-11 | Closing price | 21.200000762939453 |
| 2026-09-14 | Closing price | 21.149999618530273 |
| 2026-09-15 | Closing price | 21.770000457763672 |
| 2026-09-16 | Closing price | 20.90999984741211 |
| 2026-09-17 | Closing price | 20.940000534057617 |
| 2026-09-18 | Closing price | 20.799999237060547 |
| 2026-09-21 | Closing price | 20.6299991607666 |
| 2026-09-22 | Closing price | 20.760000228881836 |
| 2026-09-23 | Closing price | 21.139999389648438 |
| 2026-09-24 | Closing price | 20.84000015258789 |
| 2026-09-25 | Closing price | 20.3700008392334 |
| 2026-09-28 | Closing price | 20.649999618530273 |
| 2026-09-29 | Closing price | 20.649999618530273 |
| 2026-09-30 | Closing price | 20.8700008392334 |
| 2026-10-01 | Closing price | 20.979999542236328 |
| 2026-10-02 | Closing price | 21.649999618530273 |
| 2026-10-05 | Closing price | 24.139999389648438 |
| 2026-10-06 | Closing price | 23.799999237060547 |
| 2026-10-07 | Closing price | 23.989999771118164 |
| 2026-10-08 | Closing price | 24.690000534057617 |
| 2026-10-09 | Closing price | 25.299999237060547 |
| 2026-10-12 | Closing price | 25.420000076293945 |
| 2026-10-13 | Closing price | 25.5 |
| 2026-10-14 | Closing price | 25.940000534057617 |
| 2026-10-15 | Closing price | 25.299999237060547 |
| 2026-10-16 | Closing price | 26.0 |
| 2026-10-19 | Closing price | 25.559999465942383 |
| 2026-10-20 | Closing price | 25.700000762939453 |
| 2026-10-21 | Closing price | 25.65999984741211 |
| 2026-10-22 | Closing price | 25.6200008392334 |
| 2026-10-23 | Closing price | 26.15999984741211 |
| 2026-10-26 | Closing price | 22.5 |
| 2026-10-27 | Closing price | 22.299999237060547 |
| 2026-10-28 | Closing price | 22.030000686645508 |
| 2026-10-29 | Closing price | 21.899999618530273 |
| 2026-10-30 | Closing price | 22.049999237060547 |
| 2026-11-02 | Closing price | 21.15999984741211 |
| 2026-11-03 | Closing price | 21.079999923706055 |
| 2026-11-04 | Closing price | 19.610000610351562 |
| 2026-11-05 | Closing price | 18.799999237060547 |
| 2026-11-06 | Closing price | 18.530000686645508 |
| 2026-11-09 | Closing price | 18.350000381469727 |
| 2026-11-10 | Closing price | 18.280000686645508 |
| 2026-11-11 | Closing price | 17.81999969482422 |
| 2026-11-12 | Closing price | 18.100000381469727 |
| 2026-11-13 | Closing price | 18.34000015258789 |
A dividend yield of 4.35% on P/E LTM of 5.6 is modest for such profit, and that is the main argument against
The dividend yield over the last twelve months is 4.35%. On P/E LTM of 5.6 that means the company pays out roughly a quarter of profit. For an oil and gas company with such cash flow, the payout could be higher.
Our estimate for the current year's dividend starts from LTM profit of 20,935.9 million USD and a yield of 4.35% on market capitalisation of 118,189.7 million USD. That implies about 5,140 million USD of payments. This is our estimate, not the company's, and depends on profit holding at the LTM level and one-off items not changing.
A yield of 4.35% is modest for a market where the risk-free rate is higher. If profit does not recover next quarter, the dividend could come under pressure. The main risk to the payout is falling EBITDA, not debt: at 1.45x, debt does not prevent payment.
Valuation on the latest reported figures
| Metric | Value |
|---|---|
| Market cap | 118 bn USD |
| P/E (LTM) | 5.6 |
| EV/EBITDA (LTM) | 4.5 |
| P/B | 1.55 |
| Net debt / EBITDA (LTM) | 1.45 |
| ROE | 45.0% |
| Dividend yield (12m) | 4.3% |
| EV/EBITDA, 3-year average | 3.3 |
Net profit by quarter
| Period | Measure | bn USD |
|---|---|---|
| Q4 2024 | Net profit | −2.745593 |
| Q1 2025 | Net profit | 6.286655 |
| Q2 2025 | Net profit | 4.802167000000001 |
| Q3 2025 | Net profit | 6.103122 |
| Q4 2025 | Net profit | 2.858369 |
| Q1 2026 | Net profit | 6.529347 |
| Q2 2026 | Net profit | 10.337527 |
| Q3 2026 | Net profit | 7.74 |
Bottom line
The quarter's strength was price: diesel rose 45.3%, WTI 31.7%, and revenue grew 38.7%. But EBITDA stayed at last year's level, while our calculation says it should have been 17,447.4 million USD – the 5,165.4 million USD gap reflects rising unit costs, not price. Profit grew 26.8% on items below operating profit, not on the core business. Debt at 1.45x LTM EBITDA is moderate, but EV/EBITDA of 4.5 against a three-year average of 3.3 is a 36% premium, and on the portal's model the share trades 29% above fair value. Our conclusion: rather unattractive – the portal model implies 29% downside. Our view: the share is rather unattractive at the current price; upside on the portal model -29%.