PEDEVCO: revenue up 5.1-fold, yet the quarter closed with a $9.2m loss
Contents
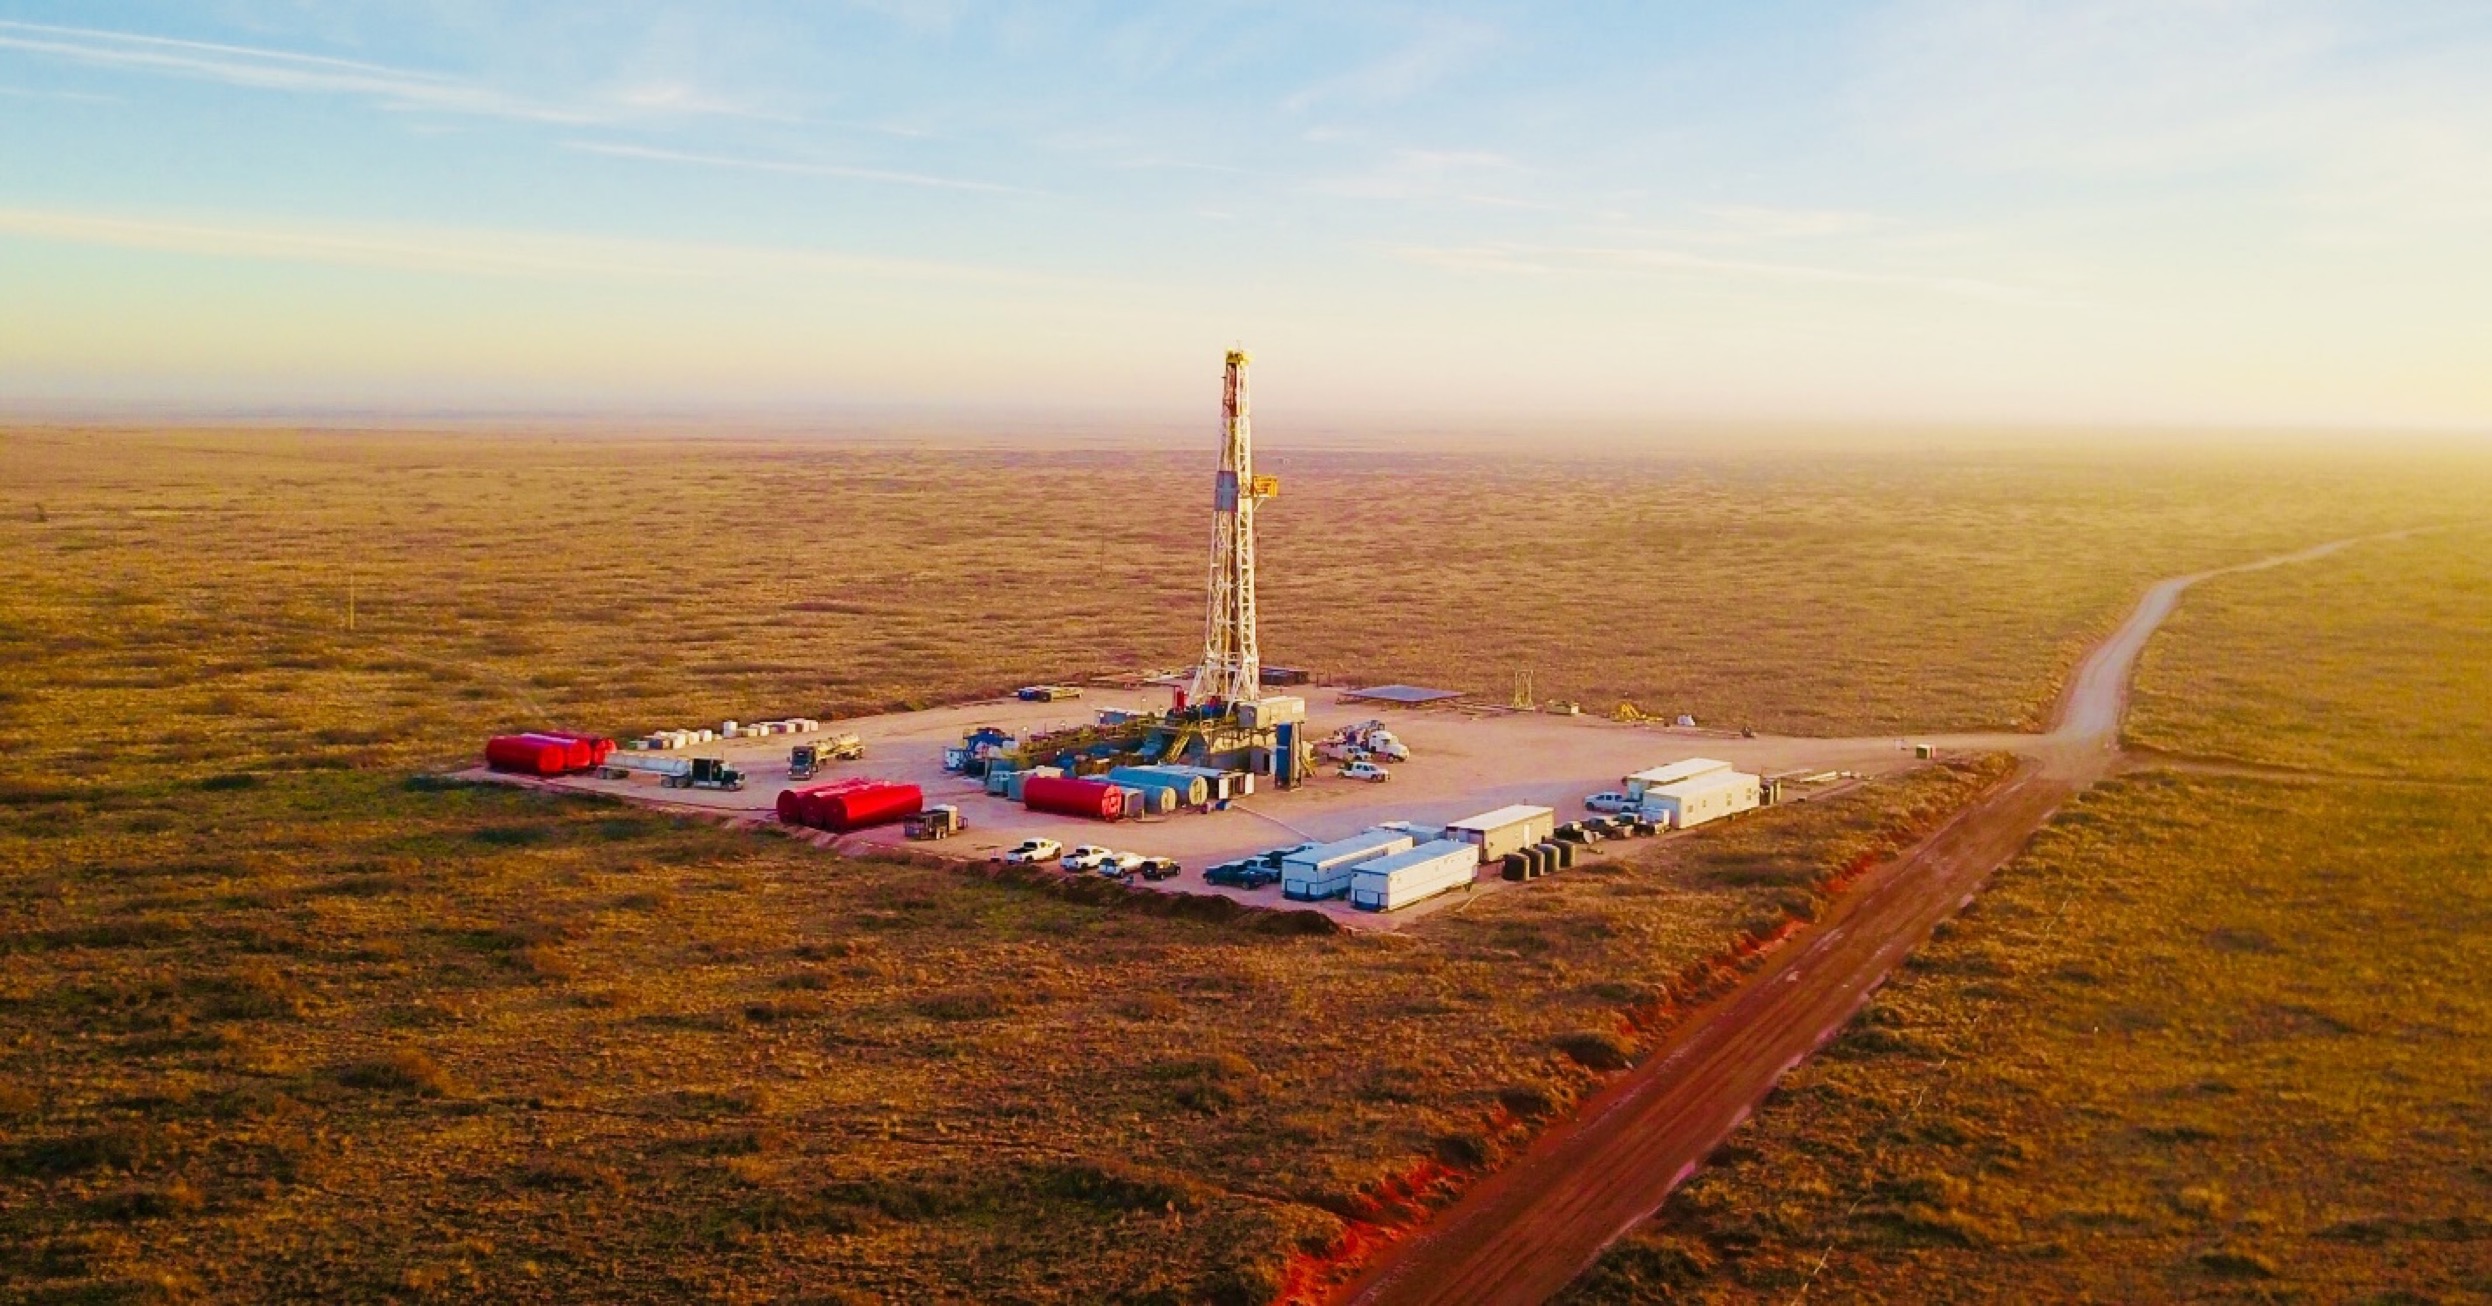
PEDEVCO's Q3 2026 results showed revenue of $35.54m, up 410.6% year on year, and EBITDA of $18.62m at a 52.4% margin. Yet net profit was negative at -$9.24m versus -$0.33m a year earlier, and the net margin fell from -4.7% to -26.0%. Our conclusion: rather attractive – an EV/EBITDA of 4.4 against its own three-year average of 12.6 is a 65% discount to history. Our view: the share is rather attractive at the current price; no portal model for this share; EV/EBITDA 4.4 against a 3-year average of 12.6, a 65% discount to its history.
Our view: is there upside
Our view in numbers
| Metric | Our read |
|---|---|
| Verdict | Rather attractive |
| Upside on the portal model | no portal model for this share |
| EV/EBITDA now and 3-year average | 4.4 vs 12.6 – a 65% discount to its history |
| Net debt / EBITDA | 1.87 – moderate leverage |
| Strongest case for | EV/EBITDA of 4.4 against its own three-year average of 12.6 is a 65% discount to history, with a 52.4% EBITDA margin and moderate leverage of 1.87x annual EBITDA. |
| Strongest case against | A net loss of $9.24m and negative ROE of -6.3% show that operating profit does not reach the shareholder. |
| What would change the view | The verdict would move up if the company reports positive net profit with an EBITDA margin above 50%, and down if revenue continues to decline from the quarterly peak of $46.11m. |
Key takeaways
— Revenue rose 5.1-fold, but growth decelerated from 561.4% in Q2 to 410.6% in Q3
— EBITDA of $18.62m at a 52.4% margin – 6.8 percentage points above last year's 45.6%
— A net loss of $9.24m against operating profit of $8.92m – a gap of more than $18m between the lines
— Operating cash flow of $9.55m covers only about half of quarterly EBITDA
— Net debt of $76.3m equals 1.87x annual EBITDA; the level is stated without a direction
— EV/EBITDA of 4.4 against its own three-year average of 12.6 – a 65% discount to history
Key figures, USD bn
| Metric | Q3 2025 | Q3 2026 | Change |
|---|---|---|---|
| Revenue | 0.01 | 0.04 | +410.6% |
| EBITDA | 0.00 | 0.02 | +486.2% |
| Operating profit | -0.00 | 0.01 | to profit |
| Net profit | -0.00 | -0.01 | — |
| Operating cash flow | 0.01 | 0.01 | +29.1% |
| Capex | 0.01 | — | — |
| EBITDA margin | 45.6% | 52.4% | +6.8 pp |
| Net margin | -4.7% | -26.0% | -21.3 pp |
Revenue rose 5.1-fold, but growth decelerated from 561.4% in Q2 to 410.6% in Q3
In Q3 2026 revenue was $35.54m against $6.96m a year earlier – growth of 410.6%. That is still a multiple-fold increase, but it is more modest than in Q2, when revenue added 561.4% to reach $46.11m. The deceleration is visible in absolute terms too: quarterly revenue fell by $10.57m compared with Q2.
The revenue peak came in Q2 2026 at $46.11m. Q3 delivered $35.54m, 23% less. For a company whose revenue a year ago was measured in single-digit millions, this level is a qualitative shift, but the sequential decline shows that growth has not yet settled at the new level.
Trailing twelve-month revenue was $145.0m. That is the sum of four quarters, and it includes both the weak quarters of the second half of 2025 and the strong Q1 and Q2 of 2026. It is the base for leverage and multiples, so the current quarterly level is about a quarter of the annual figure.
Revenue and EBITDA by quarter
| Period | Measure | bn USD |
|---|---|---|
| Q4 2024 | Revenue | 0.010576 |
| Q1 2025 | Revenue | 0.008736 |
| Q2 2025 | Revenue | 0.006972000000000001 |
| Q3 2025 | Revenue | 0.006961 |
| Q4 2025 | Revenue | 0.023082000000000002 |
| Q1 2026 | Revenue | 0.040222 |
| Q2 2026 | Revenue | 0.046113 |
| Q3 2026 | Revenue | 0.03554 |
| Q4 2024 | EBITDA | 0.003730999999999999 |
| Q1 2025 | EBITDA | 0.003496 |
| Q2 2025 | EBITDA | 0.001613 |
| Q3 2025 | EBITDA | 0.0031759999999999996 |
| Q4 2025 | EBITDA | 0.001944 |
| Q1 2026 | EBITDA | 0.019153 |
| Q2 2026 | EBITDA | 0.018669 |
| Q3 2026 | EBITDA | 0.018619 |
EBITDA margin
| Period | Measure | % |
|---|---|---|
| Q4 2024 | EBITDA margin | 35.3 |
| Q1 2025 | EBITDA margin | 40.0 |
| Q2 2025 | EBITDA margin | 23.1 |
| Q3 2025 | EBITDA margin | 45.6 |
| Q4 2025 | EBITDA margin | 8.4 |
| Q1 2026 | EBITDA margin | 47.6 |
| Q2 2026 | EBITDA margin | 40.5 |
| Q3 2026 | EBITDA margin | 52.4 |
EBITDA of $18.62m at a 52.4% margin – 6.8 percentage points above last year's 45.6%
Q3 EBITDA was $18.62m, up 486.2% year on year. The EBITDA margin rose to 52.4% from 45.6% a year earlier – an increase of 6.8 percentage points. That means the company is not only growing revenue but keeping more of it at the operating level.
Operating profit for the quarter was $8.92m. The gap between EBITDA and operating profit is $9.70m, which is depreciation. It has grown with the company's assets but remains manageable: it accounts for about half of EBITDA.
A margin above 50% for an oil and gas company reflects a high share of revenue not burdened by variable costs. However, the sustainability of this margin depends on hydrocarbon prices and on whether the current production level holds. In the next report, watch whether the margin stays above 50% if revenue declines.
Net profit by quarter
| Period | Measure | bn USD |
|---|---|---|
| Q4 2024 | Net profit | 0.005924 |
| Q1 2025 | Net profit | 0.00014000000000000001 |
| Q2 2025 | Net profit | −0.001676 |
| Q3 2025 | Net profit | −0.000325 |
| Q4 2025 | Net profit | −0.0085 |
| Q1 2026 | Net profit | −0.025627 |
| Q2 2026 | Net profit | 0.017454 |
| Q3 2026 | Net profit | −0.009242 |
A net loss of $9.24m against operating profit of $8.92m – a gap of more than $18m between the lines
With operating profit of $8.92m, the company posted a net loss of $9.24m. The $18.16m gap falls on items below the operating line: interest, taxes and other expenses. The net margin fell to -26.0% from -4.7% a year earlier.
A year earlier the quarterly loss was symbolic at $0.33m. Now it has grown 28-fold, even as revenue grew 5.1-fold. That means expenses below operating profit are growing faster than the business, and they determine the final result for the shareholder.
For the investor this is the key contradiction of the report: operationally the company is profitable, but the profit does not reach the net line. Until the gap narrows, earnings-based multiples will be distorted, and valuation rests on EBITDA and cash flow.
Operating cash flow of $9.55m covers only about half of quarterly EBITDA
Q3 operating cash flow was $9.55m. That is 51% of EBITDA of $18.62m. The difference reflects the fact that part of profit is tied up in working capital and goes to debt service, which does not appear in operating cash flow.
Over the trailing twelve months operating cash flow was $33.2m against EBITDA of $40.9m – an 81% conversion. That is higher than in Q3 alone and suggests the quarterly shortfall is a feature of the period rather than a sustained trend.
Capex for Q3 is not disclosed. In Q1 2026 it was $16.48m and in Q2 $3.50m. If Q3 continued that pattern, free cash flow could have been close to zero or negative. Without the capex figure, free cash flow for the quarter cannot be assessed, and that limits conclusions on the cash side of the report.
Valuation vs its own history
now vs the 3-year average
| Period | Measure | × |
|---|---|---|
| EV/EBITDA | Now | 4.427325642582352 |
| EV/EBITDA | 3-year average | 12.601272993807804 |
Net debt of $76.3m equals 1.87x annual EBITDA; the level is stated without a direction
At the end of Q3 net debt was $76.3m. Against annual EBITDA of $40.9m that is 1.87x. The level is moderate for an oil and gas company: below two times annual EBITDA, leaving room for manoeuvre.
We do not assess the direction of the ratio because the facts do not include a prior value. All that is known is that absolute net debt is $76.3m and market capitalisation is $177.7m. Debt is about 43% of market cap, which warrants attention for a sector with volatile revenue but does not look critical.
Interest expense is the main candidate to explain the gap between operating and net profit. With net debt of $76.3m, even a moderate rate produces several million dollars of quarterly interest, and together with taxes it turns operating profit of $8.92m into a loss of $9.24m. Reducing debt is the most direct route to positive net profit.
Share price, three years
close, last point 2026-11-12
| Period | Measure | USD per share |
|---|---|---|
| 2025-11-12 | Closing price | 12.140000343322754 |
| 2025-11-13 | Closing price | 11.619999885559082 |
| 2025-11-14 | Closing price | 11.479999542236328 |
| 2025-11-17 | Closing price | 11.199999809265137 |
| 2025-11-18 | Closing price | 10.800000190734863 |
| 2025-11-19 | Closing price | 10.140000343322754 |
| 2025-11-20 | Closing price | 10.279999732971191 |
| 2025-11-21 | Closing price | 10.279999732971191 |
| 2025-11-24 | Closing price | 9.279999732971191 |
| 2025-11-25 | Closing price | 9.399999618530273 |
| 2025-11-26 | Closing price | 9.600000381469727 |
| 2025-11-28 | Closing price | 9.100000381469727 |
| 2025-12-01 | Closing price | 9.899999618530273 |
| 2025-12-02 | Closing price | 10.079999923706055 |
| 2025-12-03 | Closing price | 10.579999923706055 |
| 2025-12-04 | Closing price | 10.9399995803833 |
| 2025-12-05 | Closing price | 11.279999732971191 |
| 2025-12-08 | Closing price | 11.300000190734863 |
| 2025-12-09 | Closing price | 11.319999694824219 |
| 2025-12-10 | Closing price | 11.399999618530273 |
| 2025-12-11 | Closing price | 11.020000457763672 |
| 2025-12-12 | Closing price | 10.800000190734863 |
| 2025-12-15 | Closing price | 10.0 |
| 2025-12-16 | Closing price | 10.619999885559082 |
| 2025-12-17 | Closing price | 11.020000457763672 |
| 2025-12-18 | Closing price | 10.9399995803833 |
| 2025-12-19 | Closing price | 10.699999809265137 |
| 2025-12-22 | Closing price | 11.199999809265137 |
| 2025-12-23 | Closing price | 11.399999618530273 |
| 2025-12-24 | Closing price | 11.199999809265137 |
| 2025-12-26 | Closing price | 11.079999923706055 |
| 2025-12-29 | Closing price | 11.359999656677246 |
| 2025-12-30 | Closing price | 11.359999656677246 |
| 2025-12-31 | Closing price | 11.199999809265137 |
| 2026-01-02 | Closing price | 11.15999984741211 |
| 2026-01-05 | Closing price | 11.619999885559082 |
| 2026-01-06 | Closing price | 11.199999809265137 |
| 2026-01-07 | Closing price | 10.800000190734863 |
| 2026-01-08 | Closing price | 11.0 |
| 2026-01-09 | Closing price | 10.220000267028809 |
| 2026-01-12 | Closing price | 10.399999618530273 |
| 2026-01-13 | Closing price | 11.199999809265137 |
| 2026-01-14 | Closing price | 11.220000267028809 |
| 2026-01-15 | Closing price | 10.739999771118164 |
| 2026-01-16 | Closing price | 10.920000076293945 |
| 2026-01-20 | Closing price | 11.0 |
| 2026-01-21 | Closing price | 11.100000381469727 |
| 2026-01-22 | Closing price | 11.579999923706055 |
| 2026-01-23 | Closing price | 11.600000381469727 |
| 2026-01-26 | Closing price | 11.859999656677246 |
| 2026-01-27 | Closing price | 12.579999923706055 |
| 2026-01-28 | Closing price | 12.760000228881836 |
| 2026-01-29 | Closing price | 12.600000381469727 |
| 2026-01-30 | Closing price | 12.199999809265137 |
| 2026-02-02 | Closing price | 11.680000305175781 |
| 2026-02-03 | Closing price | 11.640000343322754 |
| 2026-02-04 | Closing price | 11.9399995803833 |
| 2026-02-05 | Closing price | 11.619999885559082 |
| 2026-02-06 | Closing price | 11.979999542236328 |
| 2026-02-09 | Closing price | 12.0600004196167 |
| 2026-02-10 | Closing price | 12.300000190734863 |
| 2026-02-11 | Closing price | 12.279999732971191 |
| 2026-02-12 | Closing price | 11.819999694824219 |
| 2026-02-13 | Closing price | 11.859999656677246 |
| 2026-02-17 | Closing price | 11.739999771118164 |
| 2026-02-18 | Closing price | 12.399999618530273 |
| 2026-02-19 | Closing price | 12.800000190734863 |
| 2026-02-20 | Closing price | 12.300000190734863 |
| 2026-02-23 | Closing price | 12.199999809265137 |
| 2026-02-24 | Closing price | 12.119999885559082 |
| 2026-02-25 | Closing price | 12.15999984741211 |
| 2026-02-26 | Closing price | 11.9399995803833 |
| 2026-02-27 | Closing price | 12.479999542236328 |
| 2026-03-02 | Closing price | 13.960000038146973 |
| 2026-03-03 | Closing price | 13.84000015258789 |
| 2026-03-04 | Closing price | 11.760000228881836 |
| 2026-03-05 | Closing price | 12.779999732971191 |
| 2026-03-06 | Closing price | 15.140000343322754 |
| 2026-03-09 | Closing price | 15.34000015258789 |
| 2026-03-10 | Closing price | 13.260000228881836 |
| 2026-03-11 | Closing price | 16.0 |
| 2026-03-12 | Closing price | 15.5 |
| 2026-03-13 | Closing price | 18.18000030517578 |
| 2026-03-16 | Closing price | 16.420000076293945 |
| 2026-03-17 | Closing price | 16.809999465942383 |
| 2026-03-18 | Closing price | 16.969999313354492 |
| 2026-03-19 | Closing price | 17.020000457763672 |
| 2026-03-20 | Closing price | 17.969999313354492 |
| 2026-03-23 | Closing price | 15.520000457763672 |
| 2026-03-24 | Closing price | 16.170000076293945 |
| 2026-03-25 | Closing price | 14.59000015258789 |
| 2026-03-26 | Closing price | 15.149999618530273 |
| 2026-03-27 | Closing price | 17.31999969482422 |
| 2026-03-30 | Closing price | 16.670000076293945 |
| 2026-03-31 | Closing price | 16.0 |
| 2026-04-01 | Closing price | 16.25 |
| 2026-04-02 | Closing price | 16.6200008392334 |
| 2026-04-06 | Closing price | 16.299999237060547 |
| 2026-04-07 | Closing price | 17.520000457763672 |
| 2026-04-08 | Closing price | 16.0 |
| 2026-04-09 | Closing price | 16.020000457763672 |
| 2026-04-10 | Closing price | 16.389999389648438 |
| 2026-04-13 | Closing price | 15.869999885559082 |
| 2026-04-14 | Closing price | 15.899999618530273 |
| 2026-04-15 | Closing price | 15.100000381469727 |
| 2026-04-16 | Closing price | 15.869999885559082 |
| 2026-04-17 | Closing price | 14.529999732971191 |
| 2026-04-20 | Closing price | 14.949999809265137 |
| 2026-04-21 | Closing price | 15.649999618530273 |
| 2026-04-22 | Closing price | 15.949999809265137 |
| 2026-04-23 | Closing price | 16.110000610351562 |
| 2026-04-24 | Closing price | 16.049999237060547 |
| 2026-04-27 | Closing price | 16.709999084472656 |
| 2026-04-28 | Closing price | 16.600000381469727 |
| 2026-04-29 | Closing price | 16.520000457763672 |
| 2026-04-30 | Closing price | 15.979999542236328 |
| 2026-05-01 | Closing price | 15.600000381469727 |
| 2026-05-04 | Closing price | 16.010000228881836 |
| 2026-05-05 | Closing price | 16.979999542236328 |
| 2026-05-06 | Closing price | 14.760000228881836 |
| 2026-05-07 | Closing price | 14.069999694824219 |
| 2026-05-08 | Closing price | 13.979999542236328 |
| 2026-05-11 | Closing price | 14.029999732971191 |
| 2026-05-12 | Closing price | 14.8100004196167 |
| 2026-05-13 | Closing price | 13.930000305175781 |
| 2026-05-14 | Closing price | 14.859999656677246 |
| 2026-05-15 | Closing price | 15.5 |
| 2026-05-18 | Closing price | 15.25 |
| 2026-05-19 | Closing price | 15.390000343322754 |
| 2026-05-20 | Closing price | 15.119999885559082 |
| 2026-05-21 | Closing price | 14.149999618530273 |
| 2026-05-22 | Closing price | 14.760000228881836 |
| 2026-05-26 | Closing price | 14.0600004196167 |
| 2026-05-27 | Closing price | 13.319999694824219 |
| 2026-05-28 | Closing price | 13.359999656677246 |
| 2026-05-29 | Closing price | 12.850000381469727 |
| 2026-06-01 | Closing price | 13.0 |
| 2026-06-02 | Closing price | 12.920000076293945 |
| 2026-06-03 | Closing price | 13.149999618530273 |
| 2026-06-04 | Closing price | 13.770000457763672 |
| 2026-06-05 | Closing price | 13.359999656677246 |
| 2026-06-08 | Closing price | 13.420000076293945 |
| 2026-06-09 | Closing price | 13.199999809265137 |
| 2026-06-10 | Closing price | 13.670000076293945 |
| 2026-06-11 | Closing price | 13.039999961853027 |
| 2026-06-12 | Closing price | 13.0 |
| 2026-06-15 | Closing price | 12.050000190734863 |
| 2026-06-16 | Closing price | 12.40999984741211 |
| 2026-06-17 | Closing price | 12.579999923706055 |
| 2026-06-18 | Closing price | 11.710000038146973 |
| 2026-06-22 | Closing price | 12.039999961853027 |
| 2026-06-23 | Closing price | 12.020000457763672 |
| 2026-06-24 | Closing price | 11.930000305175781 |
| 2026-06-25 | Closing price | 11.899999618530273 |
| 2026-06-26 | Closing price | 15.40999984741211 |
| 2026-06-29 | Closing price | 14.989999771118164 |
| 2026-06-30 | Closing price | 13.460000038146973 |
| 2026-07-01 | Closing price | 12.859999656677246 |
| 2026-07-02 | Closing price | 12.489999771118164 |
| 2026-07-06 | Closing price | 12.520000457763672 |
| 2026-07-07 | Closing price | 11.640000343322754 |
| 2026-07-08 | Closing price | 12.350000381469727 |
| 2026-07-09 | Closing price | 12.210000038146973 |
| 2026-07-10 | Closing price | 11.399999618530273 |
| 2026-07-13 | Closing price | 12.819999694824219 |
| 2026-07-14 | Closing price | 12.489999771118164 |
| 2026-07-15 | Closing price | 12.210000038146973 |
| 2026-07-16 | Closing price | 12.0 |
| 2026-07-17 | Closing price | 12.130000114440918 |
| 2026-07-20 | Closing price | 11.8100004196167 |
| 2026-07-21 | Closing price | 12.100000381469727 |
| 2026-07-22 | Closing price | 12.09000015258789 |
| 2026-07-23 | Closing price | 12.3100004196167 |
| 2026-07-24 | Closing price | 11.949999809265137 |
| 2026-07-27 | Closing price | 11.5 |
| 2026-07-28 | Closing price | 11.149999618530273 |
| 2026-07-29 | Closing price | 10.819999694824219 |
| 2026-07-30 | Closing price | 10.359999656677246 |
| 2026-07-31 | Closing price | 10.8100004196167 |
| 2026-08-03 | Closing price | 10.4399995803833 |
| 2026-08-04 | Closing price | 10.359999656677246 |
| 2026-08-05 | Closing price | 10.010000228881836 |
| 2026-08-06 | Closing price | 10.720000267028809 |
| 2026-08-07 | Closing price | 10.609999656677246 |
| 2026-08-10 | Closing price | 11.15999984741211 |
| 2026-08-11 | Closing price | 11.390000343322754 |
| 2026-08-12 | Closing price | 11.25 |
| 2026-08-13 | Closing price | 12.050000190734863 |
| 2026-08-14 | Closing price | 12.5 |
| 2026-08-17 | Closing price | 12.529999732971191 |
| 2026-08-18 | Closing price | 12.119999885559082 |
| 2026-08-19 | Closing price | 13.229999542236328 |
| 2026-08-20 | Closing price | 13.029999732971191 |
| 2026-08-21 | Closing price | 13.8100004196167 |
| 2026-08-24 | Closing price | 13.5600004196167 |
| 2026-08-25 | Closing price | 13.109999656677246 |
| 2026-08-26 | Closing price | 13.09000015258789 |
| 2026-08-27 | Closing price | 13.390000343322754 |
| 2026-08-28 | Closing price | 13.279999732971191 |
| 2026-08-31 | Closing price | 13.609999656677246 |
| 2026-09-01 | Closing price | 13.770000457763672 |
| 2026-09-02 | Closing price | 14.329999923706055 |
| 2026-09-03 | Closing price | 14.399999618530273 |
| 2026-09-04 | Closing price | 14.34000015258789 |
| 2026-09-08 | Closing price | 14.649999618530273 |
| 2026-09-09 | Closing price | 14.649999618530273 |
| 2026-09-10 | Closing price | 14.479999542236328 |
| 2026-09-11 | Closing price | 14.84000015258789 |
| 2026-09-14 | Closing price | 15.649999618530273 |
| 2026-09-15 | Closing price | 16.360000610351562 |
| 2026-09-16 | Closing price | 15.489999771118164 |
| 2026-09-17 | Closing price | 14.529999732971191 |
| 2026-09-18 | Closing price | 12.960000038146973 |
| 2026-09-21 | Closing price | 13.380000114440918 |
| 2026-09-22 | Closing price | 13.430000305175781 |
| 2026-09-23 | Closing price | 13.260000228881836 |
| 2026-09-24 | Closing price | 13.670000076293945 |
| 2026-09-25 | Closing price | 13.109999656677246 |
| 2026-09-28 | Closing price | 13.100000381469727 |
| 2026-09-29 | Closing price | 12.979999542236328 |
| 2026-09-30 | Closing price | 13.020000457763672 |
| 2026-10-01 | Closing price | 13.119999885559082 |
| 2026-10-02 | Closing price | 12.8100004196167 |
| 2026-10-05 | Closing price | 12.930000305175781 |
| 2026-10-06 | Closing price | 13.239999771118164 |
| 2026-10-07 | Closing price | 12.859999656677246 |
| 2026-10-08 | Closing price | 12.880000114440918 |
| 2026-10-09 | Closing price | 13.470000267028809 |
| 2026-10-12 | Closing price | 13.239999771118164 |
| 2026-10-13 | Closing price | 13.25 |
| 2026-10-14 | Closing price | 12.8100004196167 |
| 2026-10-15 | Closing price | 13.479999542236328 |
| 2026-10-16 | Closing price | 13.6899995803833 |
| 2026-10-19 | Closing price | 14.649999618530273 |
| 2026-10-20 | Closing price | 14.239999771118164 |
| 2026-10-21 | Closing price | 14.670000076293945 |
| 2026-10-22 | Closing price | 14.779999732971191 |
| 2026-10-23 | Closing price | 14.930000305175781 |
| 2026-10-26 | Closing price | 15.529999732971191 |
| 2026-10-27 | Closing price | 15.579999923706055 |
| 2026-10-28 | Closing price | 16.399999618530273 |
| 2026-10-29 | Closing price | 16.40999984741211 |
| 2026-10-30 | Closing price | 16.639999389648438 |
| 2026-11-02 | Closing price | 15.289999961853027 |
| 2026-11-03 | Closing price | 15.210000038146973 |
| 2026-11-04 | Closing price | 15.140000343322754 |
| 2026-11-05 | Closing price | 14.460000038146973 |
| 2026-11-06 | Closing price | 14.880000114440918 |
| 2026-11-09 | Closing price | 14.510000228881836 |
| 2026-11-10 | Closing price | 13.34000015258789 |
| 2026-11-11 | Closing price | 13.619999885559082 |
| 2026-11-12 | Closing price | 13.369999885559082 |
EV/EBITDA of 4.4 against its own three-year average of 12.6 – a 65% discount to history
The trailing twelve-month EV/EBITDA multiple is 4.4. Its own three-year average is 12.6. The gap is -65%, meaning the share trades at almost a third of its three-year average. This is the strongest argument for the current valuation.
The discount is explicable: the market is not prepared to pay for EBITDA that has grown multiple-fold while the net result is negative. If the company narrows the gap between operating and net profit, the multiple could move towards its historical level. But while the loss persists, the discount is not an anomaly but a reflection of risk.
Return on equity is negative at -6.3%. That confirms current profit is not creating value for the shareholder. Valuing on EBITDA with a negative ROE is a compromise: it shows the asset's potential but does not confirm its current return. A re-rating requires a move to positive net profit.
Valuation on the latest reported figures
| Metric | Value |
|---|---|
| Market cap | 0.18 bn USD |
| EV/EBITDA (LTM) | 4.4 |
| P/B | 0.86 |
| Net debt / EBITDA (LTM) | 1.87 |
| Operating cash flow (LTM) | 0.03 bn |
| ROE | -6.3% |
| EV/EBITDA, 3-year average | 12.6 |
Bottom line
The strong side of the report is operational: revenue of $35.54m, up 410.6%, a 52.4% EBITDA margin and EBITDA of $18.62m. The weak side is everything below the operating line: a net loss of $9.24m, a negative net margin of -26.0% and ROE of -6.3%. Cash flow is positive but covers only half of EBITDA, and quarterly capex is not disclosed. The main question for a holder is whether the gap between operating and net profit will narrow; the answer will determine whether the 65% discount to the multiple's own history is realised. Our conclusion: rather attractive – an EV/EBITDA of 4.4 against a three-year average of 12.6 is a 65% discount to history. Our view: the share is rather attractive at the current price; no portal model for this share; EV/EBITDA 4.4 against a 3-year average of 12.6, a 65% discount to its history.