Parex Resources: Brent up 34%, but capex and debt ate the profit
Contents
On 11 November Parex Resources reported results for the third quarter of 2026. The average Brent price in the period was USD 91.3 per barrel against USD 68 a year earlier (+34.2%), revenue reached USD 635.5m, EBITDA – USD 225.9m at a 35.5% margin, net profit – USD 75.3m. On our calculation, at the previous quarter's volumes and costs the price move would have produced EBITDA of USD 180.7m, so the company earned USD 45.2m more – the gap is explained by volumes and sales mix, not by price alone. Our conclusion: the share is fairly valued – the portal model puts the upside to fair value at -4%, and EV/EBITDA of 4.6 against its own three-year average of 2.1 (+122%) leaves no cushion. Our view: the share is fairly valued; upside on the portal model -4%.
Our view: is there upside
Our view in numbers
| Metric | Our read |
|---|---|
| Verdict | Neutral |
| Upside on the portal model | -4% |
| How the model works | spot model: EBITDA re-priced to current commodity prices at the target EV/EBITDA, against market cap |
| EV/EBITDA now and 3-year average | 4.6 vs 2.1 – a 122% premium to its history |
| Dividend yield, 12m | 7.8% |
| Net debt / EBITDA | 2.57 – high leverage |
| Strongest case for | A 7.8% dividend yield at an LTM P/E of 5.2 – the market pays less than five years of USD 255.1m profit, and the payout remains the main argument for the share. |
| Strongest case against | EV/EBITDA of 4.6 against its own three-year average of 2.1 is a 122% premium, and with a -4% portal-model upside there is no cushion for an error in profit. |
| What would change the view | The verdict would move one step up if Brent holds above USD 91 and the volume beat over price repeats next quarter; one step down if the price falls below USD 80 or net debt exceeds 2.57x LTM EBITDA. |
Key takeaways
— Brent rose 34.2% year on year to USD 91.3, and that is the main driver of revenue of USD 635.5m
— On our calculation, price alone would have produced EBITDA of USD 180.7m, while reported EBITDA was USD 225.9m – the USD 45.2m gap came from volumes and sales mix
— The 35.5% EBITDA margin on revenue of USD 635.5m is USD 225.9m of operating profit before depreciation, and it rests on price, not on cost cuts
— Net profit of USD 75.3m at an 11.8% margin lags EBITDA because of depreciation and interest on USD 732.7m of net debt
— Capex rose to USD 120.4m in the quarter against operating cash flow of USD 138.2m – free cash flow stays thin
— A 7.8% dividend yield at a P/E of 5.2 remains the main argument for the share, but it rests on profit that is sensitive to the oil price
— EV/EBITDA of 4.6 against its own three-year average of 2.1 – the share trades 122% above its history, and that outweighs the dividend
Key figures, USD bn
| Metric | — | Q3 2026 | Change |
|---|---|---|---|
| Revenue | — | 0.64 | — |
| EBITDA | — | 0.23 | — |
| Operating profit | — | 0.12 | — |
| Net profit | — | 0.08 | — |
| Operating cash flow | — | 0.14 | — |
| Capex | — | 0.12 | — |
| EBITDA margin | — | 35.5% | — |
| Net margin | — | 11.8% | — |
Brent rose 34.2% year on year to USD 91.3, and that is the main driver of revenue of USD 635.5m
The average Brent price in the third quarter of 2026 was USD 91.3 per barrel against USD 68 a year earlier – a rise of 34.2%. Against the previous quarter the price fell 5.6% from USD 96.8. On 11 November spot stands at USD 91.8, just 0.6% above the reported-period average, so the price backdrop for the next quarter has barely changed.
Revenue for the quarter was USD 635.5m. Oil accounts for 95% of revenue in the portal model, so the Brent move explains most of the annual growth. But price alone does not answer whether the company earned what the market allowed – that needs a calculation at unchanged volumes.
Commodity prices: period average and now
| Benchmark | Year ago | Q3 2026 | YoY | Spot 2026-11-11 |
|---|---|---|---|---|
| Brent, USD | 68,0 | 91,3 | +34,2% | 91,8 |
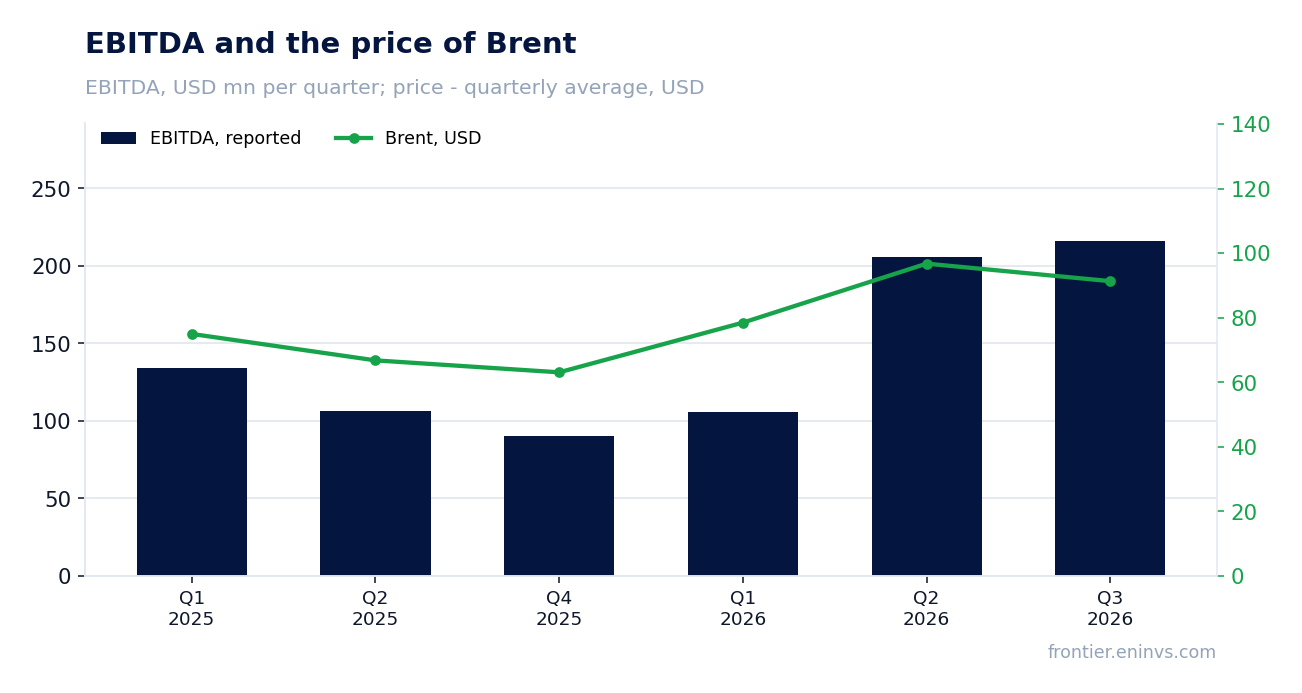
On our calculation, price alone would have produced EBITDA of USD 180.7m, while reported EBITDA was USD 225.9m – the USD 45.2m gap came from volumes and sales mix
Holding the previous quarter's volumes and costs and moving only prices, revenue would have been USD 443.9m (–USD 25.0m, or –5.3%) and EBITDA USD 180.7m. In fact revenue came in at USD 635.5m, USD 191.6m above the implied figure (+43.2%), and EBITDA at USD 225.9m, USD 45.2m above (+25.0%).
A gap of that size is not explained by price: it means the company sold materially more, or at a higher realised price relative to Brent, than in the previous quarter. The facts give no production or realised-price data, so the exact cause cannot be named – only that the volume factor was large and positive.
For a holder this is good news in substance: the quarter was stronger than the market alone allowed. But there is nothing to test the durability of that excess against – the next report should show whether it repeats at the same price.
Revenue and EBITDA by quarter
| Period | Measure | bn USD |
|---|---|---|
| Q1 2025 | Revenue | 0.26814699999999997 |
| Q2 2025 | Revenue | 0.24138900000000002 |
| Q4 2025 | Revenue | 0.25154 |
| Q1 2026 | Revenue | 0.273132 |
| Q2 2026 | Revenue | 0.46892500000000004 |
| Q3 2026 | Revenue | 0.63552 |
| Q1 2025 | EBITDA | 0.134107 |
| Q2 2025 | EBITDA | 0.10652500000000001 |
| Q4 2025 | EBITDA | 0.090344 |
| Q1 2026 | EBITDA | 0.105755 |
| Q2 2026 | EBITDA | 0.205671 |
| Q3 2026 | EBITDA | 0.216387 |
EBITDA margin
| Period | Measure | % |
|---|---|---|
| Q1 2025 | EBITDA margin | 50.0 |
| Q2 2025 | EBITDA margin | 44.1 |
| Q4 2025 | EBITDA margin | 35.9 |
| Q1 2026 | EBITDA margin | 38.7 |
| Q2 2026 | EBITDA margin | 43.9 |
| Q3 2026 | EBITDA margin | 34.0 |
The 35.5% EBITDA margin on revenue of USD 635.5m is USD 225.9m of operating profit before depreciation, and it rests on price, not on cost cuts
EBITDA for the quarter was USD 225.9m at a 35.5% margin. Operating profit was USD 115.8m, so depreciation and other items between EBITDA and operating profit took USD 110.1m – almost half of EBITDA.
A 35.5% margin at a Brent price of USD 91.3 looks moderate for an oil producer: at the previous quarter's higher price (USD 96.8) and lower revenue the margin would differ, but the facts forbid comparing quarters – the series breaks off. The one firm statement is that the margin was formed by price and volumes, not by a visible cut in unit costs, for which the facts give no data.
What matters more for valuation: with EBITDA of USD 225.9m and capex of USD 120.4m, depreciation and interest absorb more than what remains after investment. That caps both profit and the dividend base.
Net profit of USD 75.3m at an 11.8% margin lags EBITDA because of depreciation and interest on USD 732.7m of net debt
Net profit for the quarter was USD 75.3m at an 11.8% margin. Only a third of EBITDA of USD 225.9m reaches it – depreciation, interest and taxes take the rest. Operating profit of USD 115.8m shows that roughly half of EBITDA survives to the financial lines and tax.
Net debt at 30 September 2026 was USD 732.7m, or 2.57x trailing twelve-month EBITDA. That is a level, not a trend: the facts give no earlier value, so no claim about leverage rising or falling can be made. On that interest base, net profit is more sensitive to the oil price than EBITDA.
Over the last twelve months net profit was USD 255.1m against EBITDA of USD 285.4m – LTM profit almost equals EBITDA, which is unusual and points to one-off items in that period, though the facts do not disclose them. No such items are named for the quarter, so the USD 75.3m reads as operating.
Capex rose to USD 120.4m in the quarter against operating cash flow of USD 138.2m – free cash flow stays thin
Operating cash flow for the quarter was USD 138.2m and capex USD 120.4m. The difference – USD 17.8m – is the entire free cash flow before interest and dividends. Against net debt of USD 732.7m that cushion is thin.
Capex of USD 120.4m is more than half of EBITDA (USD 225.9m). For a company with 19.7 years of reserve life at the current production rate such spending sustains the base, but it consumes the cash that could go to debt or payouts.
That is why the dividend at a 7.8% yield is funded less by the quarter's free cash flow than by full-year profit. If the oil price falls below USD 91, the payout is the first thing to feel it.
Valuation vs its own history
now vs the 3-year average
| Period | Measure | × |
|---|---|---|
| EV/EBITDA | Now | 4.59779668447516 |
| EV/EBITDA | 3-year average | 2.0702477251302756 |
A 7.8% dividend yield at a P/E of 5.2 remains the main argument for the share, but it rests on profit that is sensitive to the oil price
The trailing twelve-month dividend yield is 7.8% at a market cap of USD 1,337.7m and an LTM P/E of 5.2. That is a high yield, and it remains the main support for the share: LTM profit of USD 255.1m at that market cap leaves room for the payout.
Our estimate of the current-year dividend is about USD 105m, derived from the 7.8% yield and the USD 1,337.7m market cap; it rests on LTM profit and on the payout ratio holding. The key risk is quarterly profit of USD 75.3m: if it stays at that level, full-year profit will be below LTM, and the payout will have to be cut or funded from the balance sheet.
There is nothing in the facts to compare the 7.8% yield with the key rate – the rate is not given. But at a P/E of 5.2 the market already assumes profit will not stay at this level forever: the yield is high precisely because the share price does not believe in the durability of profit at oil around USD 91.
Share price, three years
close, last point 2026-11-10
| Period | Measure | USD per share |
|---|---|---|
| 2025-11-10 | Closing price | 18.549999237060547 |
| 2025-11-11 | Closing price | 18.549999237060547 |
| 2025-11-12 | Closing price | 18.59000015258789 |
| 2025-11-13 | Closing price | 18.100000381469727 |
| 2025-11-14 | Closing price | 18.489999771118164 |
| 2025-11-17 | Closing price | 18.559999465942383 |
| 2025-11-18 | Closing price | 18.850000381469727 |
| 2025-11-19 | Closing price | 19.170000076293945 |
| 2025-11-20 | Closing price | 18.68000030517578 |
| 2025-11-21 | Closing price | 18.600000381469727 |
| 2025-11-24 | Closing price | 18.770000457763672 |
| 2025-11-25 | Closing price | 17.920000076293945 |
| 2025-11-26 | Closing price | 18.290000915527344 |
| 2025-11-27 | Closing price | 18.489999771118164 |
| 2025-11-28 | Closing price | 18.5 |
| 2025-12-01 | Closing price | 18.649999618530273 |
| 2025-12-02 | Closing price | 18.65999984741211 |
| 2025-12-03 | Closing price | 19.040000915527344 |
| 2025-12-04 | Closing price | 19.020000457763672 |
| 2025-12-05 | Closing price | 19.170000076293945 |
| 2025-12-08 | Closing price | 18.209999084472656 |
| 2025-12-09 | Closing price | 17.670000076293945 |
| 2025-12-10 | Closing price | 17.959999084472656 |
| 2025-12-11 | Closing price | 17.299999237060547 |
| 2025-12-12 | Closing price | 18.010000228881836 |
| 2025-12-15 | Closing price | 18.229999542236328 |
| 2025-12-16 | Closing price | 17.309999465942383 |
| 2025-12-17 | Closing price | 17.489999771118164 |
| 2025-12-18 | Closing price | 17.549999237060547 |
| 2025-12-19 | Closing price | 17.729999542236328 |
| 2025-12-22 | Closing price | 17.90999984741211 |
| 2025-12-23 | Closing price | 18.15999984741211 |
| 2025-12-24 | Closing price | 18.110000610351562 |
| 2025-12-29 | Closing price | 18.1299991607666 |
| 2025-12-30 | Closing price | 18.43000030517578 |
| 2025-12-31 | Closing price | 18.450000762939453 |
| 2026-01-02 | Closing price | 18.719999313354492 |
| 2026-01-05 | Closing price | 17.729999542236328 |
| 2026-01-06 | Closing price | 17.850000381469727 |
| 2026-01-07 | Closing price | 17.440000534057617 |
| 2026-01-08 | Closing price | 18.010000228881836 |
| 2026-01-09 | Closing price | 18.299999237060547 |
| 2026-01-12 | Closing price | 18.290000915527344 |
| 2026-01-13 | Closing price | 19.010000228881836 |
| 2026-01-14 | Closing price | 19.260000228881836 |
| 2026-01-15 | Closing price | 19.170000076293945 |
| 2026-01-16 | Closing price | 19.610000610351562 |
| 2026-01-19 | Closing price | 19.5 |
| 2026-01-20 | Closing price | 19.139999389648438 |
| 2026-01-21 | Closing price | 19.440000534057617 |
| 2026-01-22 | Closing price | 19.010000228881836 |
| 2026-01-23 | Closing price | 19.479999542236328 |
| 2026-01-26 | Closing price | 19.700000762939453 |
| 2026-01-27 | Closing price | 20.709999084472656 |
| 2026-01-28 | Closing price | 21.15999984741211 |
| 2026-01-29 | Closing price | 20.889999389648438 |
| 2026-01-30 | Closing price | 20.200000762939453 |
| 2026-02-02 | Closing price | 19.989999771118164 |
| 2026-02-03 | Closing price | 20.399999618530273 |
| 2026-02-04 | Closing price | 20.739999771118164 |
| 2026-02-05 | Closing price | 20.06999969482422 |
| 2026-02-06 | Closing price | 20.889999389648438 |
| 2026-02-09 | Closing price | 21.239999771118164 |
| 2026-02-10 | Closing price | 20.850000381469727 |
| 2026-02-11 | Closing price | 21.09000015258789 |
| 2026-02-12 | Closing price | 20.219999313354492 |
| 2026-02-13 | Closing price | 20.559999465942383 |
| 2026-02-17 | Closing price | 20.389999389648438 |
| 2026-02-18 | Closing price | 21.079999923706055 |
| 2026-02-19 | Closing price | 21.809999465942383 |
| 2026-02-20 | Closing price | 21.639999389648438 |
| 2026-02-23 | Closing price | 21.81999969482422 |
| 2026-02-24 | Closing price | 22.229999542236328 |
| 2026-02-25 | Closing price | 21.3799991607666 |
| 2026-02-26 | Closing price | 21.350000381469727 |
| 2026-02-27 | Closing price | 21.34000015258789 |
| 2026-03-02 | Closing price | 21.959999084472656 |
| 2026-03-03 | Closing price | 22.079999923706055 |
| 2026-03-04 | Closing price | 22.75 |
| 2026-03-05 | Closing price | 22.639999389648438 |
| 2026-03-06 | Closing price | 23.149999618530273 |
| 2026-03-09 | Closing price | 23.09000015258789 |
| 2026-03-10 | Closing price | 23.34000015258789 |
| 2026-03-11 | Closing price | 24.81999969482422 |
| 2026-03-12 | Closing price | 25.719999313354492 |
| 2026-03-13 | Closing price | 26.079999923706055 |
| 2026-03-16 | Closing price | 25.940000534057617 |
| 2026-03-17 | Closing price | 26.31999969482422 |
| 2026-03-18 | Closing price | 26.65999984741211 |
| 2026-03-19 | Closing price | 27.1299991607666 |
| 2026-03-20 | Closing price | 27.139999389648438 |
| 2026-03-23 | Closing price | 26.43000030517578 |
| 2026-03-24 | Closing price | 26.8799991607666 |
| 2026-03-25 | Closing price | 26.09000015258789 |
| 2026-03-26 | Closing price | 26.209999084472656 |
| 2026-03-27 | Closing price | 26.940000534057617 |
| 2026-03-30 | Closing price | 27.079999923706055 |
| 2026-03-31 | Closing price | 27.34000015258789 |
| 2026-04-01 | Closing price | 26.0 |
| 2026-04-02 | Closing price | 27.299999237060547 |
| 2026-04-06 | Closing price | 27.299999237060547 |
| 2026-04-07 | Closing price | 27.479999542236328 |
| 2026-04-08 | Closing price | 24.790000915527344 |
| 2026-04-09 | Closing price | 24.969999313354492 |
| 2026-04-10 | Closing price | 26.469999313354492 |
| 2026-04-13 | Closing price | 26.920000076293945 |
| 2026-04-14 | Closing price | 26.149999618530273 |
| 2026-04-15 | Closing price | 25.59000015258789 |
| 2026-04-16 | Closing price | 25.700000762939453 |
| 2026-04-17 | Closing price | 24.65999984741211 |
| 2026-04-20 | Closing price | 26.020000457763672 |
| 2026-04-21 | Closing price | 26.270000457763672 |
| 2026-04-22 | Closing price | 26.709999084472656 |
| 2026-04-23 | Closing price | 27.229999542236328 |
| 2026-04-24 | Closing price | 26.8799991607666 |
| 2026-04-27 | Closing price | 27.520000457763672 |
| 2026-04-28 | Closing price | 27.3799991607666 |
| 2026-04-29 | Closing price | 28.84000015258789 |
| 2026-04-30 | Closing price | 28.6200008392334 |
| 2026-05-01 | Closing price | 27.8799991607666 |
| 2026-05-04 | Closing price | 28.299999237060547 |
| 2026-05-05 | Closing price | 29.700000762939453 |
| 2026-05-06 | Closing price | 28.3799991607666 |
| 2026-05-07 | Closing price | 28.110000610351562 |
| 2026-05-08 | Closing price | 27.920000076293945 |
| 2026-05-11 | Closing price | 28.239999771118164 |
| 2026-05-12 | Closing price | 27.229999542236328 |
| 2026-05-13 | Closing price | 27.280000686645508 |
| 2026-05-14 | Closing price | 26.979999542236328 |
| 2026-05-15 | Closing price | 27.110000610351562 |
| 2026-05-19 | Closing price | 26.84000015258789 |
| 2026-05-20 | Closing price | 26.1299991607666 |
| 2026-05-21 | Closing price | 25.979999542236328 |
| 2026-05-22 | Closing price | 26.440000534057617 |
| 2026-05-25 | Closing price | 25.6200008392334 |
| 2026-05-26 | Closing price | 25.670000076293945 |
| 2026-05-27 | Closing price | 24.8700008392334 |
| 2026-05-28 | Closing price | 24.360000610351562 |
| 2026-05-29 | Closing price | 24.049999237060547 |
| 2026-06-01 | Closing price | 26.520000457763672 |
| 2026-06-02 | Closing price | 27.329999923706055 |
| 2026-06-03 | Closing price | 26.93000030517578 |
| 2026-06-04 | Closing price | 26.989999771118164 |
| 2026-06-05 | Closing price | 26.420000076293945 |
| 2026-06-08 | Closing price | 26.489999771118164 |
| 2026-06-09 | Closing price | 25.360000610351562 |
| 2026-06-10 | Closing price | 25.639999389648438 |
| 2026-06-11 | Closing price | 26.309999465942383 |
| 2026-06-12 | Closing price | 26.389999389648438 |
| 2026-06-15 | Closing price | 25.149999618530273 |
| 2026-06-16 | Closing price | 24.420000076293945 |
| 2026-06-17 | Closing price | 24.760000228881836 |
| 2026-06-18 | Closing price | 24.65999984741211 |
| 2026-06-19 | Closing price | 26.149999618530273 |
| 2026-06-22 | Closing price | 24.780000686645508 |
| 2026-06-23 | Closing price | 23.829999923706055 |
| 2026-06-24 | Closing price | 22.610000610351562 |
| 2026-06-25 | Closing price | 22.34000015258789 |
| 2026-06-26 | Closing price | 22.049999237060547 |
| 2026-06-29 | Closing price | 21.8700008392334 |
| 2026-06-30 | Closing price | 21.389999389648438 |
| 2026-07-02 | Closing price | 20.850000381469727 |
| 2026-07-03 | Closing price | 21.010000228881836 |
| 2026-07-06 | Closing price | 20.690000534057617 |
| 2026-07-07 | Closing price | 21.100000381469727 |
| 2026-07-08 | Closing price | 22.020000457763672 |
| 2026-07-09 | Closing price | 22.260000228881836 |
| 2026-07-10 | Closing price | 22.299999237060547 |
| 2026-07-13 | Closing price | 23.170000076293945 |
| 2026-07-14 | Closing price | 23.5 |
| 2026-07-15 | Closing price | 23.239999771118164 |
| 2026-07-16 | Closing price | 23.139999389648438 |
| 2026-07-17 | Closing price | 22.600000381469727 |
| 2026-07-20 | Closing price | 22.579999923706055 |
| 2026-07-21 | Closing price | 23.1200008392334 |
| 2026-07-22 | Closing price | 23.729999542236328 |
| 2026-07-23 | Closing price | 24.010000228881836 |
| 2026-07-24 | Closing price | 23.59000015258789 |
| 2026-07-27 | Closing price | 23.09000015258789 |
| 2026-07-28 | Closing price | 22.40999984741211 |
| 2026-07-29 | Closing price | 23.290000915527344 |
| 2026-07-30 | Closing price | 23.420000076293945 |
| 2026-07-31 | Closing price | 24.280000686645508 |
| 2026-08-04 | Closing price | 23.489999771118164 |
| 2026-08-05 | Closing price | 23.639999389648438 |
| 2026-08-06 | Closing price | 24.389999389648438 |
| 2026-08-07 | Closing price | 24.43000030517578 |
| 2026-08-10 | Closing price | 25.489999771118164 |
| 2026-08-11 | Closing price | 25.65999984741211 |
| 2026-08-12 | Closing price | 26.200000762939453 |
| 2026-08-13 | Closing price | 25.989999771118164 |
| 2026-08-14 | Closing price | 26.540000915527344 |
| 2026-08-17 | Closing price | 27.280000686645508 |
| 2026-08-18 | Closing price | 27.899999618530273 |
| 2026-08-19 | Closing price | 28.18000030517578 |
| 2026-08-20 | Closing price | 28.200000762939453 |
| 2026-08-21 | Closing price | 28.100000381469727 |
| 2026-08-24 | Closing price | 27.5 |
| 2026-08-25 | Closing price | 27.219999313354492 |
| 2026-08-26 | Closing price | 27.170000076293945 |
| 2026-08-27 | Closing price | 27.940000534057617 |
| 2026-08-28 | Closing price | 27.8799991607666 |
| 2026-08-31 | Closing price | 28.520000457763672 |
| 2026-09-01 | Closing price | 29.639999389648438 |
| 2026-09-02 | Closing price | 28.81999969482422 |
| 2026-09-03 | Closing price | 28.90999984741211 |
| 2026-09-04 | Closing price | 28.760000228881836 |
| 2026-09-08 | Closing price | 28.420000076293945 |
| 2026-09-09 | Closing price | 28.940000534057617 |
| 2026-09-10 | Closing price | 28.450000762939453 |
| 2026-09-11 | Closing price | 28.93000030517578 |
| 2026-09-14 | Closing price | 28.8700008392334 |
| 2026-09-15 | Closing price | 29.81999969482422 |
| 2026-09-16 | Closing price | 28.43000030517578 |
| 2026-09-17 | Closing price | 28.510000228881836 |
| 2026-09-18 | Closing price | 28.360000610351562 |
| 2026-09-21 | Closing price | 27.030000686645508 |
| 2026-09-22 | Closing price | 26.450000762939453 |
| 2026-09-23 | Closing price | 26.8799991607666 |
| 2026-09-24 | Closing price | 27.709999084472656 |
| 2026-09-25 | Closing price | 26.780000686645508 |
| 2026-09-28 | Closing price | 27.09000015258789 |
| 2026-09-29 | Closing price | 26.68000030517578 |
| 2026-09-30 | Closing price | 26.68000030517578 |
| 2026-10-01 | Closing price | 26.829999923706055 |
| 2026-10-02 | Closing price | 26.93000030517578 |
| 2026-10-05 | Closing price | 27.31999969482422 |
| 2026-10-06 | Closing price | 27.510000228881836 |
| 2026-10-07 | Closing price | 27.420000076293945 |
| 2026-10-08 | Closing price | 28.209999084472656 |
| 2026-10-09 | Closing price | 27.229999542236328 |
| 2026-10-13 | Closing price | 28.399999618530273 |
| 2026-10-14 | Closing price | 28.100000381469727 |
| 2026-10-15 | Closing price | 28.100000381469727 |
| 2026-10-16 | Closing price | 28.84000015258789 |
| 2026-10-19 | Closing price | 29.5 |
| 2026-10-20 | Closing price | 29.25 |
| 2026-10-21 | Closing price | 29.280000686645508 |
| 2026-10-22 | Closing price | 29.18000030517578 |
| 2026-10-23 | Closing price | 30.1299991607666 |
| 2026-10-26 | Closing price | 29.489999771118164 |
| 2026-10-27 | Closing price | 28.520000457763672 |
| 2026-10-28 | Closing price | 28.510000228881836 |
| 2026-10-29 | Closing price | 27.600000381469727 |
| 2026-10-30 | Closing price | 27.989999771118164 |
| 2026-11-02 | Closing price | 26.15999984741211 |
| 2026-11-03 | Closing price | 25.850000381469727 |
| 2026-11-04 | Closing price | 23.920000076293945 |
| 2026-11-05 | Closing price | 23.739999771118164 |
| 2026-11-06 | Closing price | 19.809999465942383 |
| 2026-11-09 | Closing price | 19.809999465942383 |
| 2026-11-10 | Closing price | 19.59000015258789 |
EV/EBITDA of 4.6 against its own three-year average of 2.1 – the share trades 122% above its history, and that outweighs the dividend
LTM EV/EBITDA is 4.6 against its own three-year average of 2.1 – a 122% premium. That is the key fact for valuation: on the multiple the share is more expensive than it has been for three years, with no cushion for an error in profit. The LTM P/E of 5.2 looks low on its own, but it is calculated on profit earned at high prices.
On the portal's spot model, which reprices EBITDA to current prices at the target EV/EBITDA, the upside to fair value is -4%. Spot Brent at USD 91.8 is almost equal to the quarterly average of USD 91.3, so the model expects no price improvement – at current conditions the share is fairly valued.
The two measures diverge: the 7.8% dividend yield pulls up, while the multiple against history and the model pull down. For this share the multiple decides: the dividend is paid out of profit that no longer grows at USD 91, and the premium to its own history means the market is paying for profit the company may not repeat.
Valuation on the latest reported figures
| Metric | Value |
|---|---|
| Market cap | 1.34 bn USD |
| P/E (LTM) | 5.2 |
| EV/EBITDA (LTM) | 4.6 |
| P/B | 0.68 |
| Net debt / EBITDA (LTM) | 2.57 |
| ROE | 4.2% |
| Dividend yield (12m) | 7.8% |
| EV/EBITDA, 3-year average | 2.1 |
Net profit by quarter
| Period | Measure | bn USD |
|---|---|---|
| Q1 2025 | Net profit | 0.080629 |
| Q2 2025 | Net profit | 0.049113 |
| Q4 2025 | Net profit | 0.074865 |
| Q1 2026 | Net profit | 0.004589 |
| Q2 2026 | Net profit | 0.44429599999999997 |
| Q3 2026 | Net profit | 0.07525499999999999 |
Bottom line
The quarter was strong in substance: at Brent of USD 91.3 the company earned EBITDA of USD 225.9m, while on our calculation price alone gave only USD 180.7m – the USD 45.2m difference came from volumes and sales mix. But net profit of USD 75.3m at an 11.8% margin shows how much depreciation and interest on USD 732.7m of debt take, and capex of USD 120.4m leaves free cash flow of USD 17.8m. The 7.8% dividend yield remains the main argument for the share, but EV/EBITDA of 4.6 against its own three-year average of 2.1 (+122%) and the -4% portal-model upside outweigh it. Our conclusion: the share is fairly valued – the upside to fair value on the portal model is -4%. Our view: the share is fairly valued; upside on the portal model -4%.