Ring Energy: oil price up 31.7%, yet EBITDA rose only 54% on revenue +30.2%

On 6 November Ring Energy reported third-quarter 2026 results. Average WTI was 85.4 USD in the period versus 64.9 USD a year earlier (+31.7%), and spot is now 91.7 USD. Revenue reached 102.3 mn USD (+30.2% YoY), EBITDA 66.4 mn USD (+54.0%), while net profit stayed negative at -16.6 mn USD. At year-ago volumes and costs, our calculation shows prices implied revenue of 101.2 mn and EBITDA of 63.0 mn, so the company earned slightly above the price-implied level. Yet the share trades at 51.1 EV/EBITDA LTM against its own three-year average of 3.3, which makes it look rather unattractive despite the strong price backdrop.
Key takeaways
— Oil rose 31.7% YoY, but a 7.9% sequential price decline already weighed on revenue
— At year-ago volumes, our calculation shows prices implied EBITDA of 63.0 mn, while the company earned 66.4 mn – 5.4% above the benchmark
— Revenue of 102.3 mn at 85.4 USD per barrel came in 5.6% above the previous quarter's price-implied level
— EBITDA margin rose to 64.9% from 54.9%, yet net profit stayed negative at -16.6 mn USD
— Leverage at 26.0 EBITDA LTM with net debt of 0.4 bn USD is not a comfortable level
— EV/EBITDA LTM of 51.1 versus a three-year average of 3.3 – the share trades 15 times above its own history
— Reserves cover 20.7 years of production, but at the current multiple that does not rescue the valuation
Attractiveness
Key figures, USD bn
| Metric | Q3 2025 | Q3 2026 | Change |
|---|---|---|---|
| Revenue | 0.08 | 0.10 | +30.2% |
| EBITDA | 0.04 | 0.07 | +54.0% |
| Operating profit | -0.06 | 0.05 | to profit |
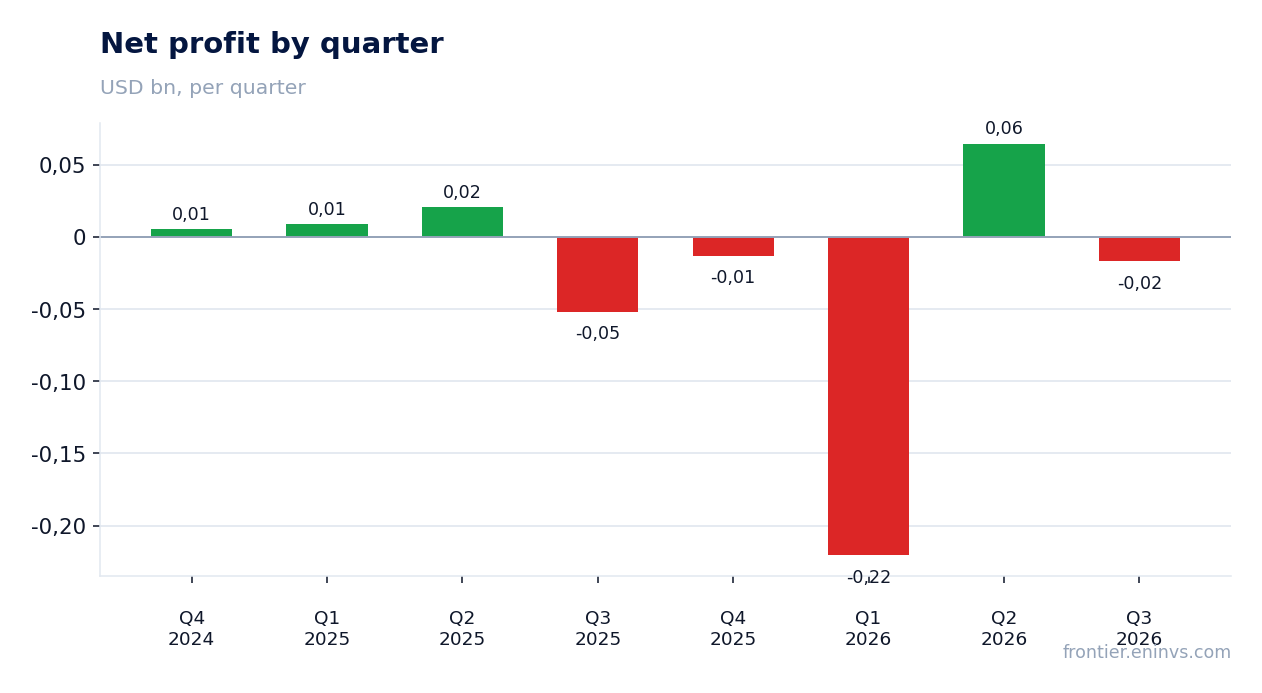
| Net profit | -0.05 | -0.02 | — |
| Operating cash flow | 0.04 | 0.06 | +41.7% |
| Capex | 0.02 | — | — |
| EBITDA margin | 54.9% | 64.9% | +10.0 pp |
| Net margin | -65.7% | -16.2% | +49.5 pp |
Oil rose 31.7% YoY, but a 7.9% sequential price decline already weighed on revenue
Average WTI in Q3 2026 was 85.4 USD per barrel versus 64.9 USD a year earlier – up 31.7%. This is the main driver of the report: revenue added 30.2% YoY to 102.3 mn USD. Henry Hub gas fell 6.2% to 2.893 USD, but gas accounts for only 8% of sales, so oil sets the tone.
Sequentially, oil fell 7.9% from 92.8 to 85.4 USD. That is already visible: revenue was 104.7 mn USD in Q2 2026 and 102.3 mn in Q3. Still, YoY growth accelerated to +30.2% from +26.7% a quarter earlier.
Spot is now 91.7 USD, 7.4% above the period average. If the price holds, the next quarter will start from a higher base than Q3.
Commodity prices: period average and now
| Benchmark | Year ago | Q3 2026 | YoY | Spot 2026-11-06 |
|---|---|---|---|---|
| WTI, USD | 64,9 | 85,4 | +31,7% | 91,7 |
| Henry Hub, USD | 3,08 | 2,89 | -6,2% | 3,00 |
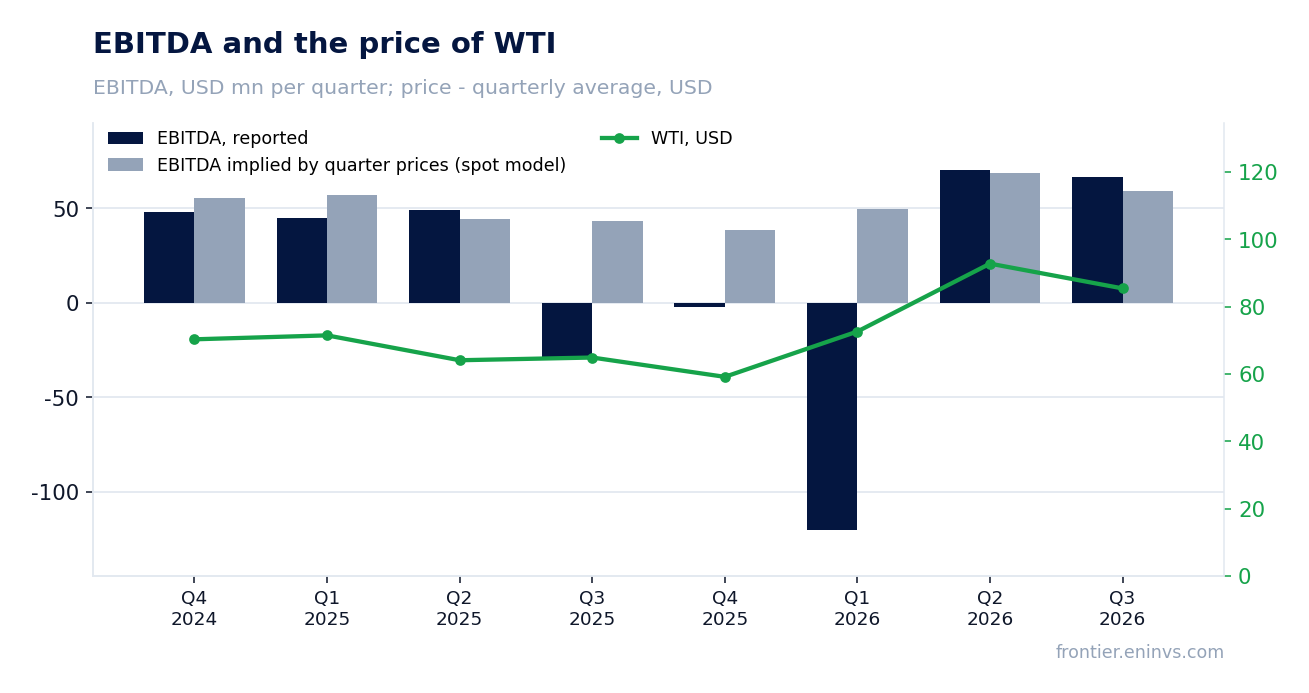
At year-ago volumes, our calculation shows prices implied EBITDA of 63.0 mn, while the company earned 66.4 mn – 5.4% above the benchmark
Holding Q3 2025 volumes and non-commodity costs and applying only this period's prices, revenue would have been 101.2 mn USD and EBITDA 63.0 mn. Actuals were 102.3 mn and 66.4 mn – 1.1% and 5.4% above. At these prices, Ring Energy earned slightly more than the price backdrop implied.
The beat could come from production volumes, realised price versus the benchmark, or unit costs – the facts do not break it down enough to name a cause. We note the fact: the upward deviation is small, within 5%.
The portal's spot model, built from the average of the previous four quarters, expected EBITDA of 58.9 mn and revenue of 94.3 mn. The report beat those by 12.8% and 8.6% – but the model's base includes the disastrous Q1 2026 with EBITDA of -120.4 mn, so the comparison is skewed.
What the prices implied and what the company earned
| Base (Q3 2025) | Implied at period prices | Reported | Reported vs implied | |
|---|---|---|---|---|
| Revenue, USD mn | 78,6 | 101,2 | 102,3 | +1,1% |
| EBITDA, USD mn | 43,1 | 63,0 | 66,4 | +5,4% |
| EBITDA, portal spot model, USD mn | — | 58,9 | 66,4 | +12,8% |
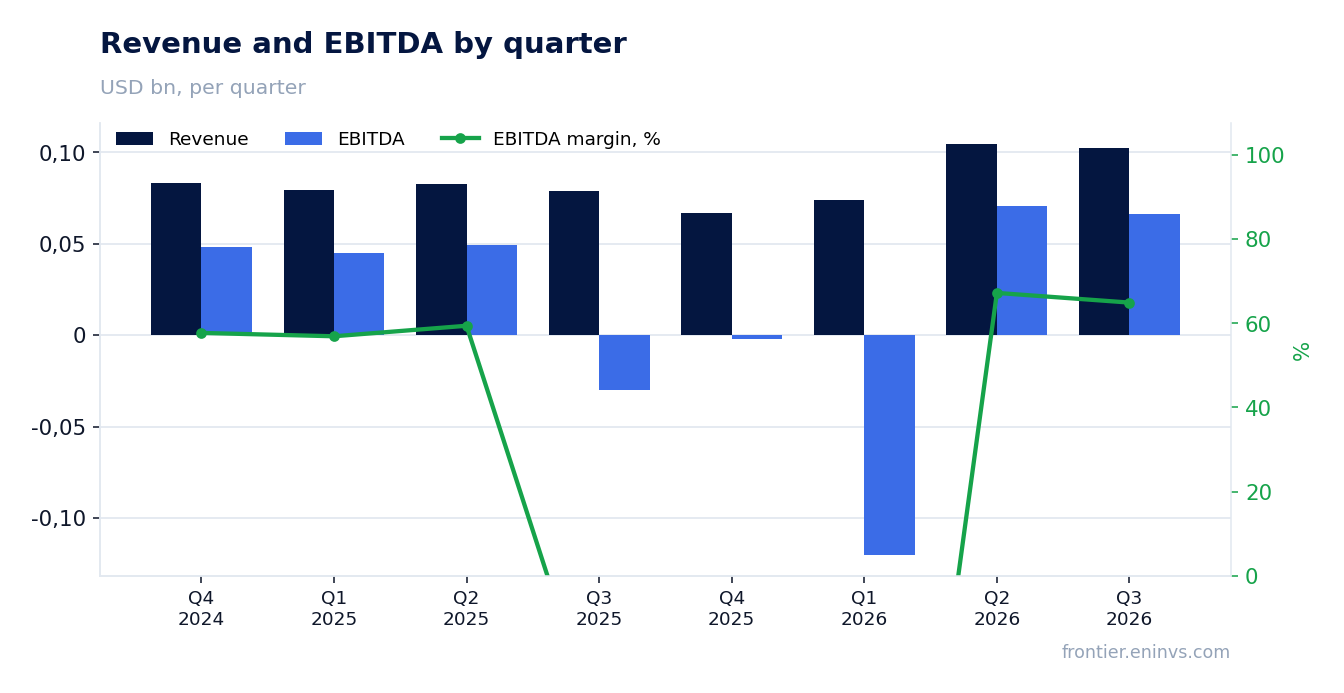
Revenue of 102.3 mn at 85.4 USD per barrel came in 5.6% above the previous quarter's price-implied level
Sequentially the picture differs: at Q2 2026 volumes and costs, Q3 prices implied revenue of 96.9 mn and EBITDA of 63.5 mn. Actuals of 102.3 mn and 66.4 mn are 5.6% and 4.6% above. Oil fell 7.9%, yet the company still beat the benchmark – volumes or realised price must have worked in its favour.
That gap is wider than the YoY one and suggests the sequential trend is better than price alone implies. But the facts give no production breakdown, so we cannot name the specific driver.
Note that Q2 revenue of 104.7 mn was above Q3's 102.3 mn – a 2.2% decline. The price-implied benchmark assumed a 7.4% drop, so the company held up better than price.
EBITDA margin rose to 64.9% from 54.9%, yet net profit stayed negative at -16.6 mn USD
EBITDA in the period was 66.4 mn USD on revenue of 102.3 mn – a 64.9% margin versus 54.9% a year earlier. A 10 pp margin gain with oil up makes sense: revenue grows faster than costs. Operating profit of 45.5 mn plus depreciation of 20.9 mn is the entire EBITDA – no other components.
Net profit was -16.6 mn USD versus -51.6 mn a year earlier. The loss narrowed but remained. The gap between operating profit of 45.5 mn and net loss of 16.6 mn is items below the operating line: interest, other income and expenses. They are not in EBITDA and do not affect the operating picture.
The net margin also improved, from -65.7% to -16.2%, but stays negative. For a company showing a loss at 85.4 USD per barrel, that is a warning: leverage and interest costs are eating the operating result.
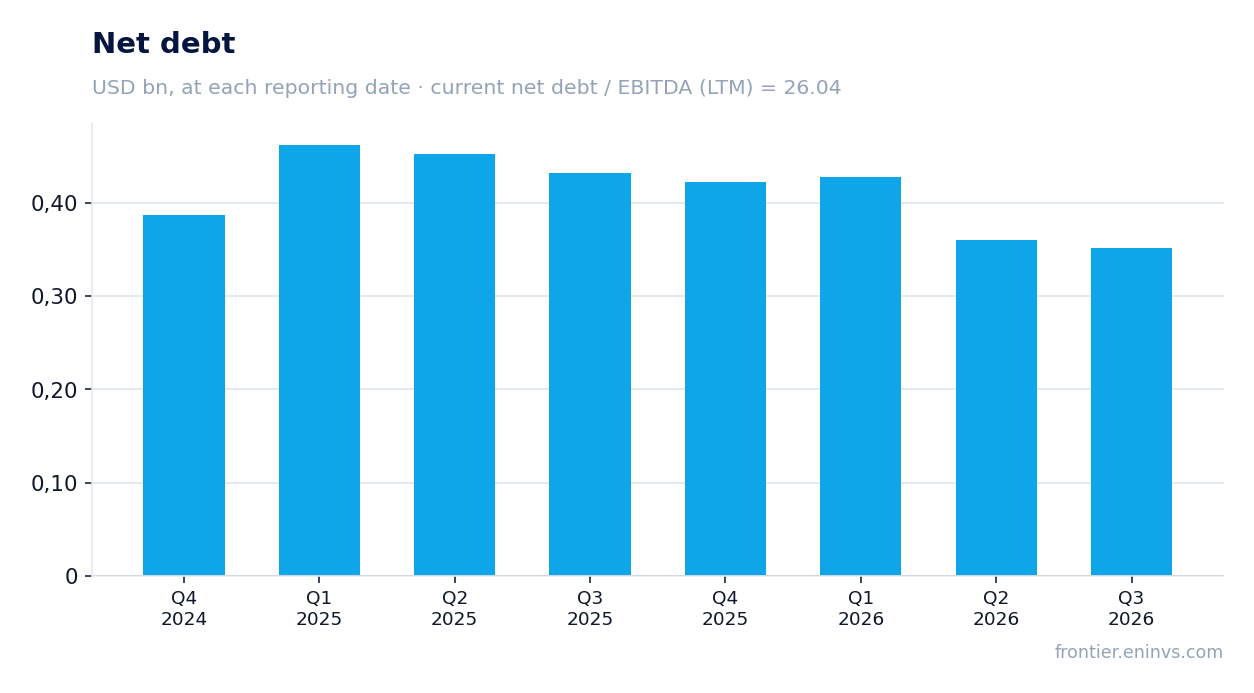
Leverage at 26.0 EBITDA LTM with net debt of 0.4 bn USD is not a comfortable level
Net debt at 30 September 2026 was 351.6 mn USD, or 0.4 bn. It edged down from 360.4 mn at 30 June and from 431.6 mn at 30 September 2025. Net debt to LTM EBITDA is 26.0. That is a high level, but we cannot compare it with a prior value: the facts give no earlier ratio.
LTM EBITDA is 13.5 mn USD – the sum of four quarters including the disastrous Q1 2026 at -120.4 mn. That collapse is what inflates the ratio to 26.0. Without it leverage would be several times lower, but the facts do not allow a recalculation.
Operating cash flow in Q3 was 63.1 mn USD, close to EBITDA of 66.4 mn. Cash generation is healthy and supports debt service. The question is how durable that flow is at lower prices.
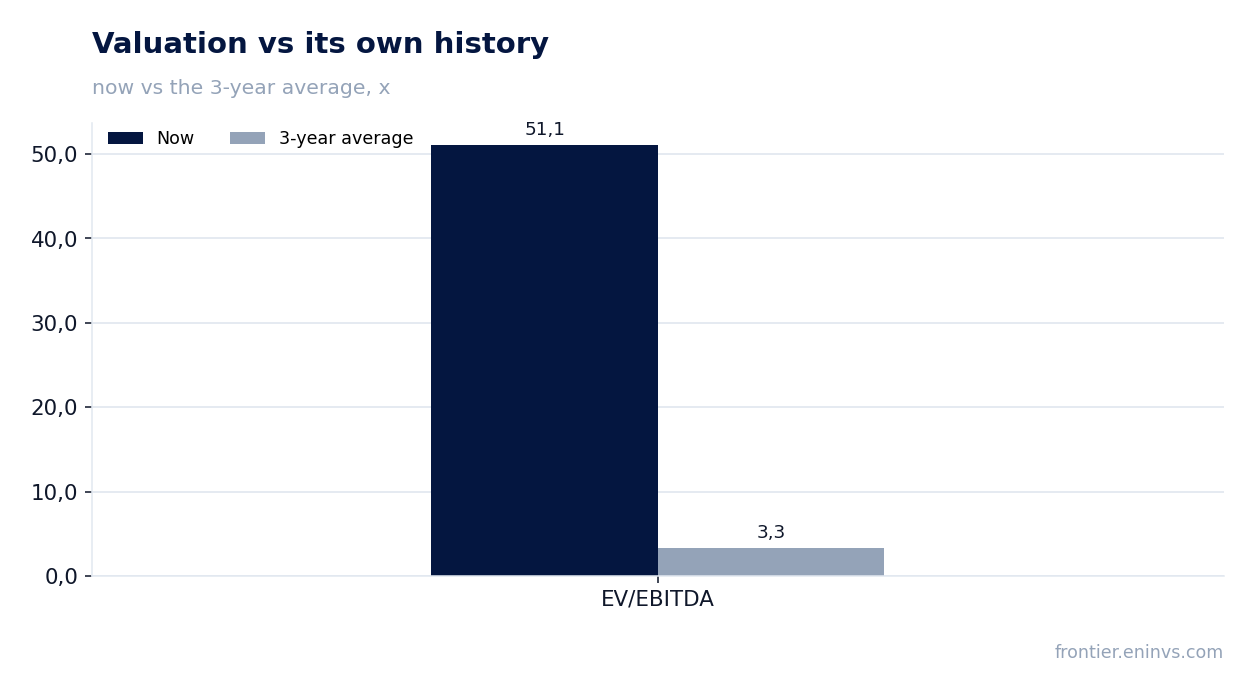
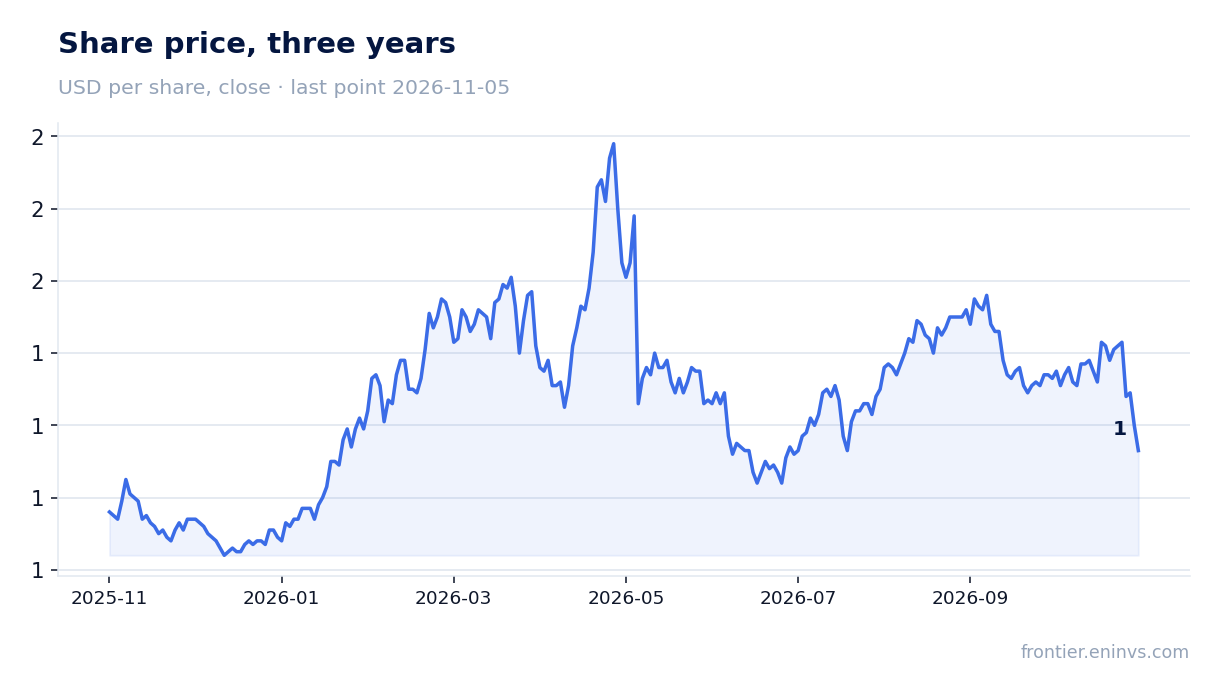
EV/EBITDA LTM of 51.1 versus a three-year average of 3.3 – the share trades 15 times above its own history
EV/EBITDA LTM is 51.1, while the three-year average of this multiple is 3.3. The share trades 1436% above its own history. The reason is the denominator: LTM EBITDA of 13.5 mn USD is distorted by the Q1 2026 collapse, when EBITDA was -120.4 mn. On normalised EBITDA the multiple would look very different, but the facts give only LTM.
Market cap is 294.4 mn USD. With net debt of 351.6 mn, EV is about 646 mn, which at LTM EBITDA of 13.5 mn gives 51.1. Using the latest quarter's EBITDA of 66.4 mn annualised would cut the multiple to roughly 2.4 – but that is our estimate, not a fact.
On the portal's model, which re-prices EBITDA at current commodity prices at the target EV/EBITDA, the upside to fair value is +35%. That is our own model, not a market consensus. It rests on the current oil price of 91.7 USD, and any decline would shrink that upside.
Reserves cover 20.7 years of production, but at the current multiple that does not rescue the valuation
Reserve life at the current production rate is 20.7 years. That is a solid horizon for an independent oil and gas company: it means the business will not exhaust its resource base in the foreseeable future and can sustain production without major acquisitions.
But a long reserve base does not offset leverage and losses. With net debt of 0.4 bn USD and LTM EBITDA of 13.5 mn, the company must direct a significant part of cash flow to debt service rather than development.
For a shareholder the question is whether Ring Energy at oil above 90 USD can generate enough free cash flow to cut debt and return to profit. Reserves buy time but do not guarantee the outcome.
Valuation on the latest reported figures
| Metric | Value |
|---|---|
| Market cap | 0.29 bn USD |
| EV/EBITDA (LTM) | 51.1 |
| P/B | 0.35 |
| Net debt / EBITDA (LTM) | 26.04 |
| Operating cash flow (LTM) | 0.17 bn |
| ROE | -8.9% |
| EV/EBITDA, 3-year average | 3.3 |
Bottom line
The report's strength is the price backdrop: oil rose 31.7% YoY, and the company earned EBITDA of 66.4 mn, slightly above the price-implied level. The 64.9% margin looks healthy, and operating cash flow of 63.1 mn is close to EBITDA. But net profit stayed negative, and leverage at 26.0 LTM EBITDA with net debt of 0.4 bn USD is a level that needs reducing. Valuation at 51.1 EV/EBITDA LTM versus a three-year average of 3.3 makes the share expensive against its own history, even though the multiple is distorted by the Q1 collapse. The verdict is rather unattractive: even with the portal model's +35% upside, the leverage risk and oil-price dependence outweigh it.
Open the company's financial profile REI →
See also: market overview · valuation map · stock screeners