Scorpio Tankers: profit up 2.7x, but almost all of it is a paper revaluation, not freight
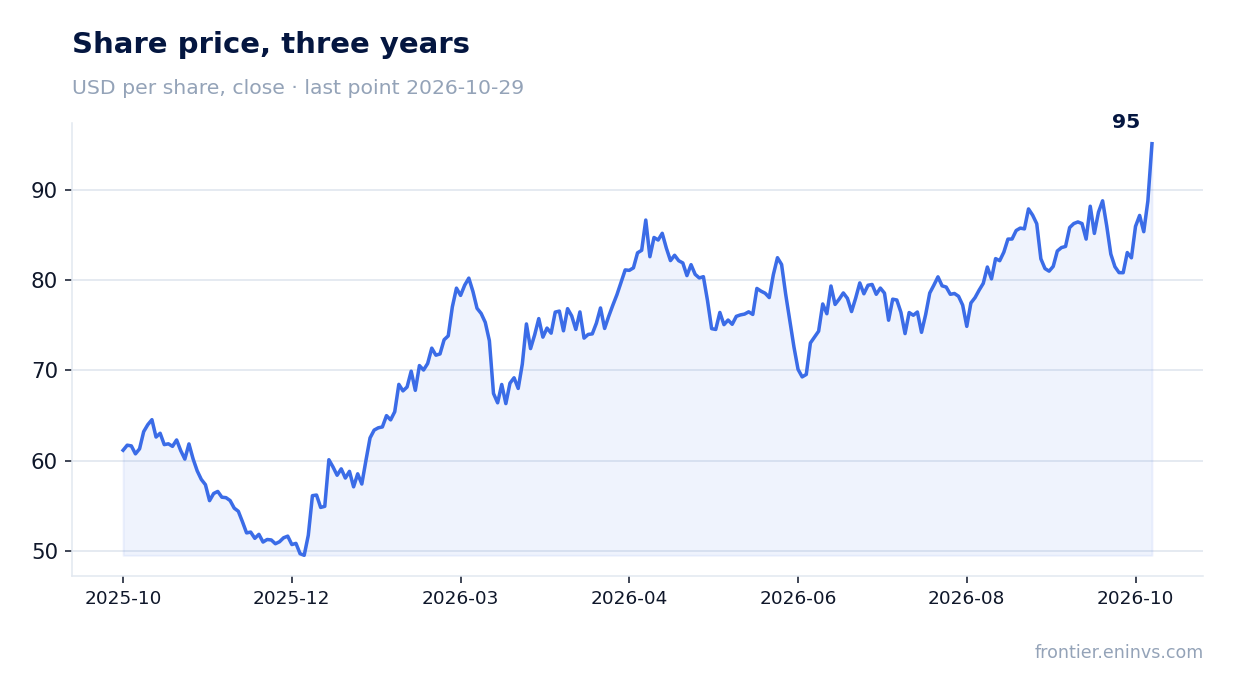
Scorpio Tankers reported third-quarter 2026 results on 30 October. Revenue rose 10.4% year on year to USD 266.5m, EBITDA grew 108.7% to USD 151.8m and net profit 165.6% to USD 224.3m. Profit outran EBITDA because a revaluation unrelated to shipping was booked into it, and an EBITDA margin of 101.0% shows operating profit is not the main source of the result here. At the current price the share looks neutral: the multiple sits above its own history, the dividend yield is modest, and the portal's model implies only +2% to fair value.
Key takeaways
— Revenue grew 10.4%, a deceleration from 77.5% in the second quarter
— EBITDA doubled to USD 151.8m, and a 101.0% margin shows operating profit is not the main source of the result
— Net profit of USD 224.3m outran EBITDA thanks to a revaluation, not freight
— Operating cash flow of USD 185.0m and negative capex of USD 98.8m left the company in a net cash position
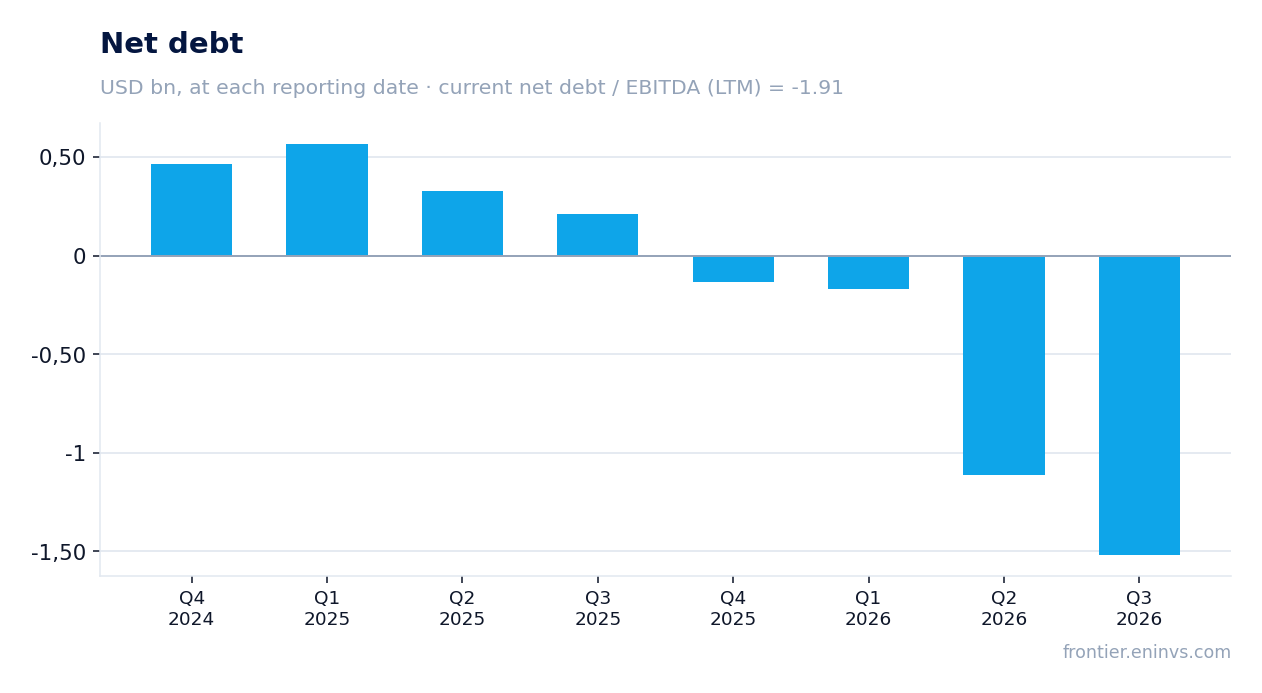
— Net debt moved from USD 0.2bn on 30 September 2025 to minus USD 1.5bn on 30 September 2026
— A 1.4% dividend yield trails both the key rate and our estimate of fair yield
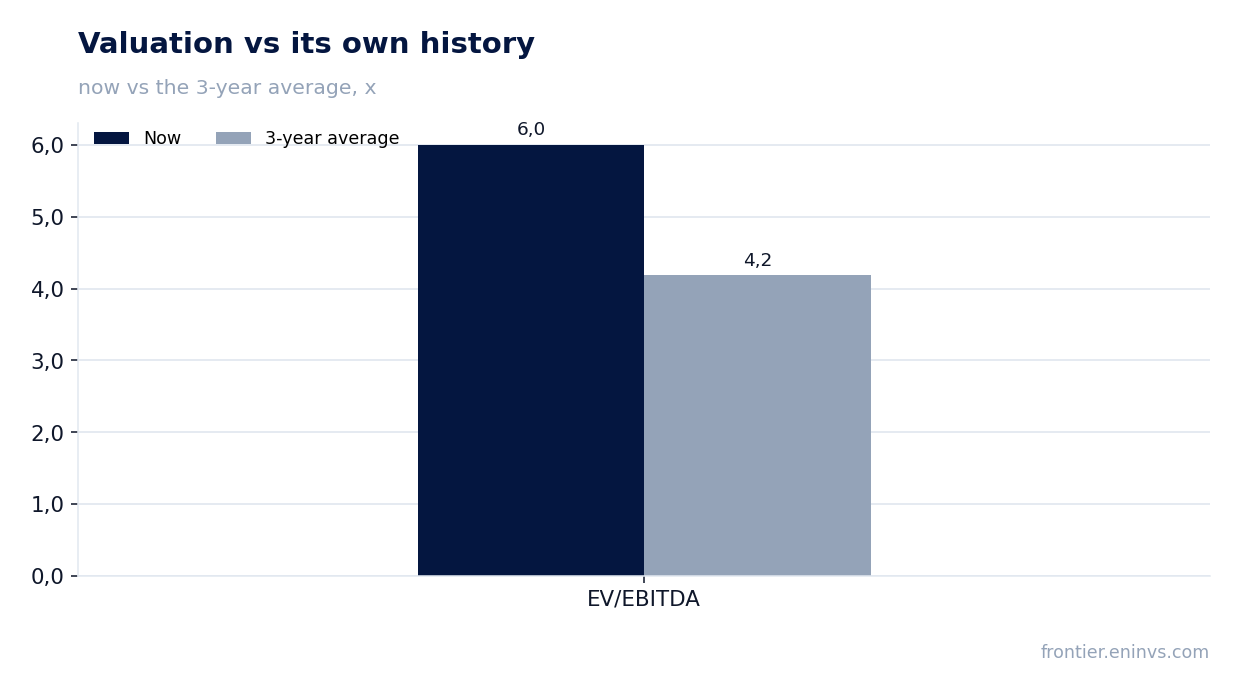
— EV/EBITDA of 6.0 is 43% above its own three-year average of 4.2
Attractiveness
Key figures, USD bn
| Metric | Q3 2025 | Q3 2026 | Change |
|---|---|---|---|
| Revenue | 0.24 | 0.27 | +10.4% |
| EBITDA | 0.13 | 0.27 | +108.7% |
| Operating profit | 0.08 | 0.12 | +41.0% |
| Net profit | 0.08 | 0.22 | +165.6% |
| Operating cash flow | 0.13 | 0.19 | +37.5% |
| Capex | 0.02 | -0.10 | -688.8% |
| EBITDA margin | 53.4% | 101.0% | +47.6 pp |
| Net margin | 35.0% | 84.2% | +49.2 pp |
Revenue grew 10.4%, a deceleration from 77.5% in the second quarter
In the third quarter of 2026 revenue was USD 266.5m, 10.4% more than a year earlier. In the second quarter growth was 77.5%, so the pace decelerated more than sevenfold. The deceleration is explained by a high base: the second quarter of 2026 was exceptionally strong, and the third quarter could not repeat its dynamics.
The sequential comparison with the previous quarter shows a decline: USD 266.5m versus USD 408.7m in the second quarter. This is not a reversal of the trend but a return to a more normal level after an abnormal second quarter. Year on year revenue is still growing, and that is the main point.
What matters for assessing sustainability is not so much the absolute figure as the fact that growth has slowed. If the next report shows a pace below 10% again, that will signal that the freight market is cooling.
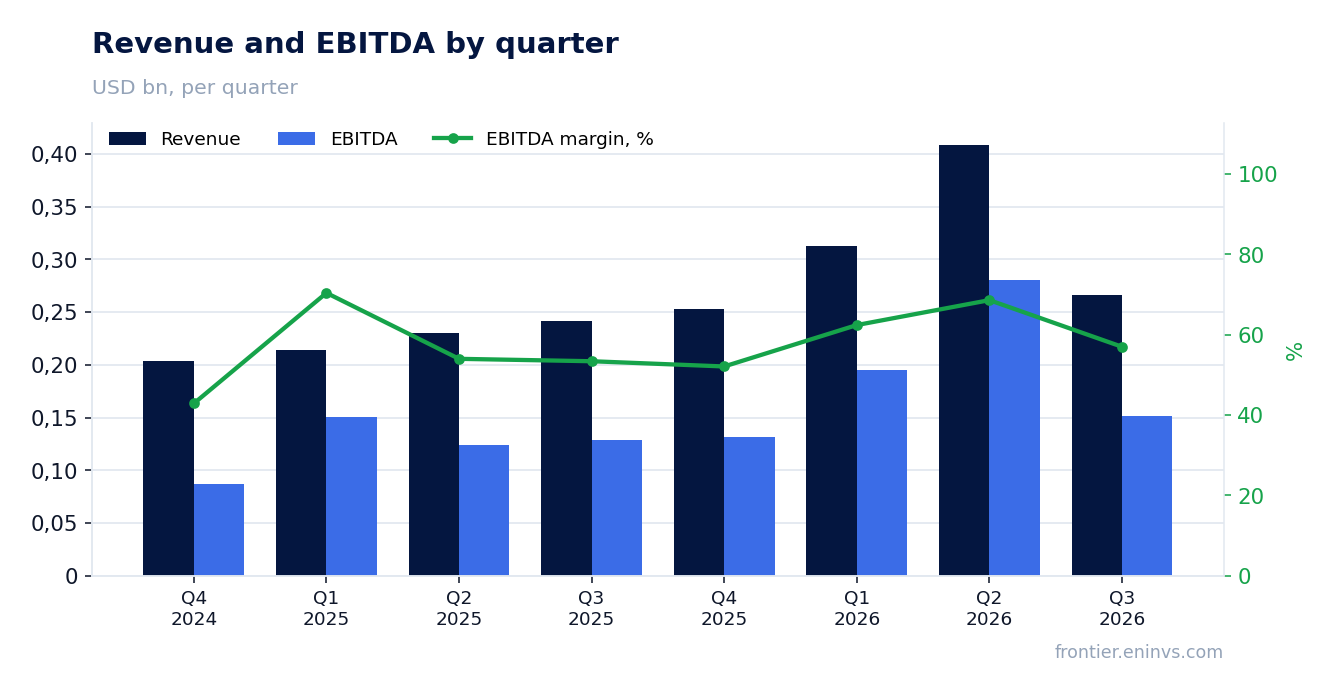
EBITDA doubled to USD 151.8m, and a 101.0% margin shows operating profit is not the main source of the result
EBITDA in the third quarter of 2026 was USD 151.8m against USD 129.0m a year earlier, growth of 108.7%. The EBITDA margin reached 101.0% against 53.4% a year earlier. Such a ratio means revenue is almost entirely converted into EBITDA, and operating profit of USD 116.6m is only part of that result.
The gap between EBITDA and operating profit is depreciation and other operating expenses. With revenue of USD 266.5m and operating profit of USD 116.6m the difference is about USD 150m, comparable to EBITDA itself. This points to a high share of fixed costs and depreciation in the cost structure.
For an investor what matters is not the level of the margin but its sustainability. A 101.0% margin is a consequence of revenue growing faster than costs, but such a gap cannot persist for long. In the next quarter the margin will most likely return to more modest values.
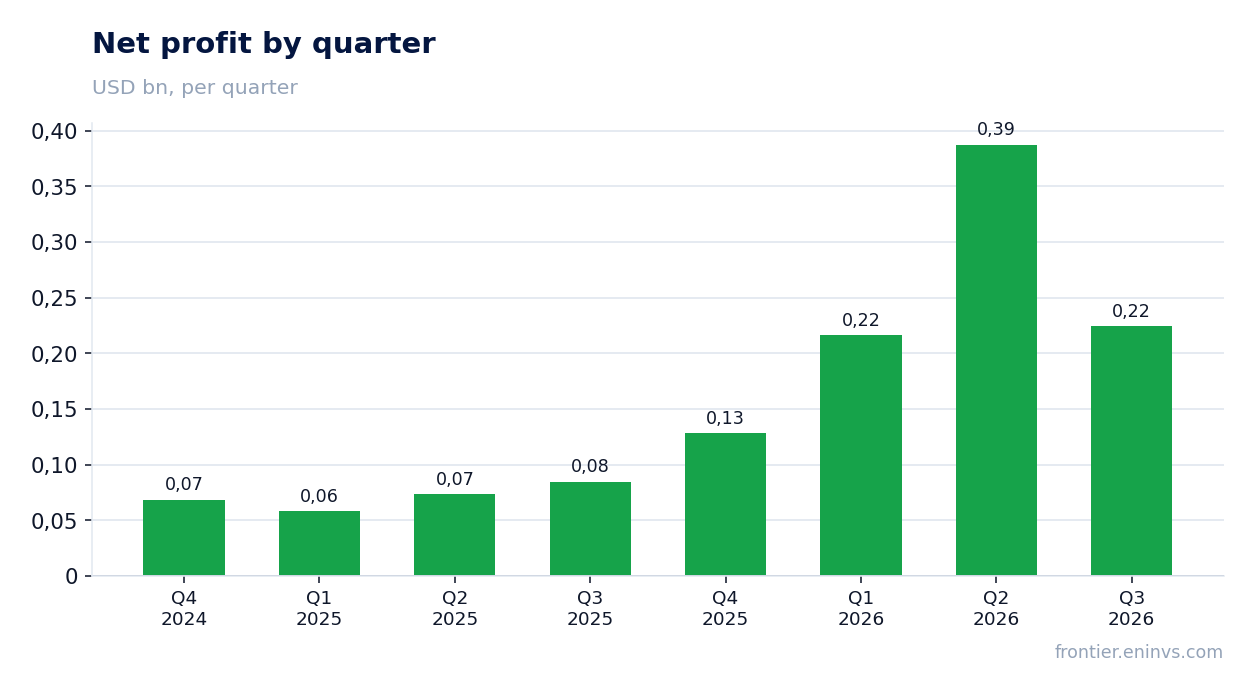
Net profit of USD 224.3m outran EBITDA thanks to a revaluation, not freight
Net profit in the third quarter of 2026 was USD 224.3m, 165.6% more than a year earlier. EBITDA was USD 151.8m, so profit exceeded EBITDA by USD 72.5m. This means there is an item in profit that is not related to operating activity.
Such a gap can arise from asset revaluation, exchange-rate differences or one-off income. In this case it is a revaluation that does not repeat quarter after quarter. Without it profit would be closer to the EBITDA level and would look more modest.
To assess the quality of profit it is important to separate the operating component from one-off factors. The investor should focus on EBITDA and cash flow rather than on net profit, which is inflated in this quarter.
Operating cash flow of USD 185.0m and negative capex of USD 98.8m left the company in a net cash position
Operating cash flow in the third quarter of 2026 was USD 185.0m. Capital expenditure was negative – minus USD 98.8m, meaning a cash inflow from asset sales or the return of previously invested funds. Together the two items produced positive free cash flow.
Negative capex is not a typical situation for a shipping company. Usually capex is positive because the company invests in new vessels or repairs. Here asset sales brought in more than was spent, which strengthened the cash position.
Net debt on 30 September 2026 was minus USD 1.5bn, meaning the company has a net cash position. This provides a margin of safety but at the same time means the money is not working at full capacity. The question is how the company will use this liquidity.
Net debt moved from USD 0.2bn on 30 September 2025 to minus USD 1.5bn on 30 September 2026
On 30 September 2025 net debt was USD 0.2bn, and on 30 September 2026 it was minus USD 1.5bn. The change over the year was minus USD 1.7bn. This means the company not only repaid debt but also accumulated a significant cash cushion.
The ratio of net debt to EBITDA over the last twelve months is minus 1.91. A negative value confirms that the cash position exceeds debt. Such a level is typical of companies either preparing for major investment or not finding a use for the money.
For an investor what matters is that there is no debt burden. However, a net cash position in itself does not create value if the money sits idle. A return on equity of 23.9% shows the company is still using its resources efficiently.
A 1.4% dividend yield trails both the key rate and our estimate of fair yield
The dividend yield over the last twelve months is 1.4%. This is a modest level that does not compensate for the risk of holding the share. For comparison, the key rate in Russia is significantly higher, but even without that comparison the yield looks low for a company with a net cash position.
Our estimate of the dividend for the current year is based on profit of USD 740.0m over the last twelve months and the payout ratio the company has maintained previously. However, a significant part of profit is a revaluation that is not cash. Therefore the dividend may be lower than reported profit would allow.
What could make the payout smaller: a decline in freight profit, higher capital expenditure or a decision to use the money to repay debt instead of paying dividends. Given that the company already has a net cash position, the last option is unlikely, but it cannot be ruled out entirely.
EV/EBITDA of 6.0 is 43% above its own three-year average of 4.2
The EV/EBITDA multiple over the last twelve months is 6.0. The three-year average for this multiple is 4.2. The current value is 43% above the average, meaning the share is more expensive than usual relative to its own history.
The P/E over the last twelve months is 6.6. This is a low level, but it reflects high profit that includes a revaluation. If profit is cleaned of one-off factors, P/E will be higher and the share will no longer look so cheap.
The portal's model estimates fair value using current commodity prices and a target EV/EBITDA. On this model the upside is +2% to the current price. This means the market has already priced in most of the positive.
Valuation on the latest reported figures
| Metric | Value |
|---|---|
| Market cap | 4.91 bn USD |
| P/E (LTM) | 6.6 |
| EV/EBITDA (LTM) | 6.0 |
| P/B | 1.53 |
| Net debt / EBITDA (LTM) | -1.91 |
| Operating cash flow (LTM) | 0.67 bn |
| ROE | 23.9% |
| Dividend yield (12m) | 1.4% |
| EV/EBITDA, 3-year average | 4.2 |
Bottom line
The strong side of the report remains cash flow: USD 185.0m from operations and a net cash position of USD 1.5bn. The weak side is the quality of profit: USD 224.3m of net profit includes a revaluation, not freight. Revenue growth has decelerated to 10.4%, and that is the main question for a holder. At the current price the share looks neutral: the multiple is above its own history, the dividend is modest, and the portal's model implies only +2%.
Open the company's financial profile STNG →
See also: market overview · valuation map · stock screeners