Sunoco LP: revenue tripled after Parkland, but EBITDA margin compressed to 5.8%
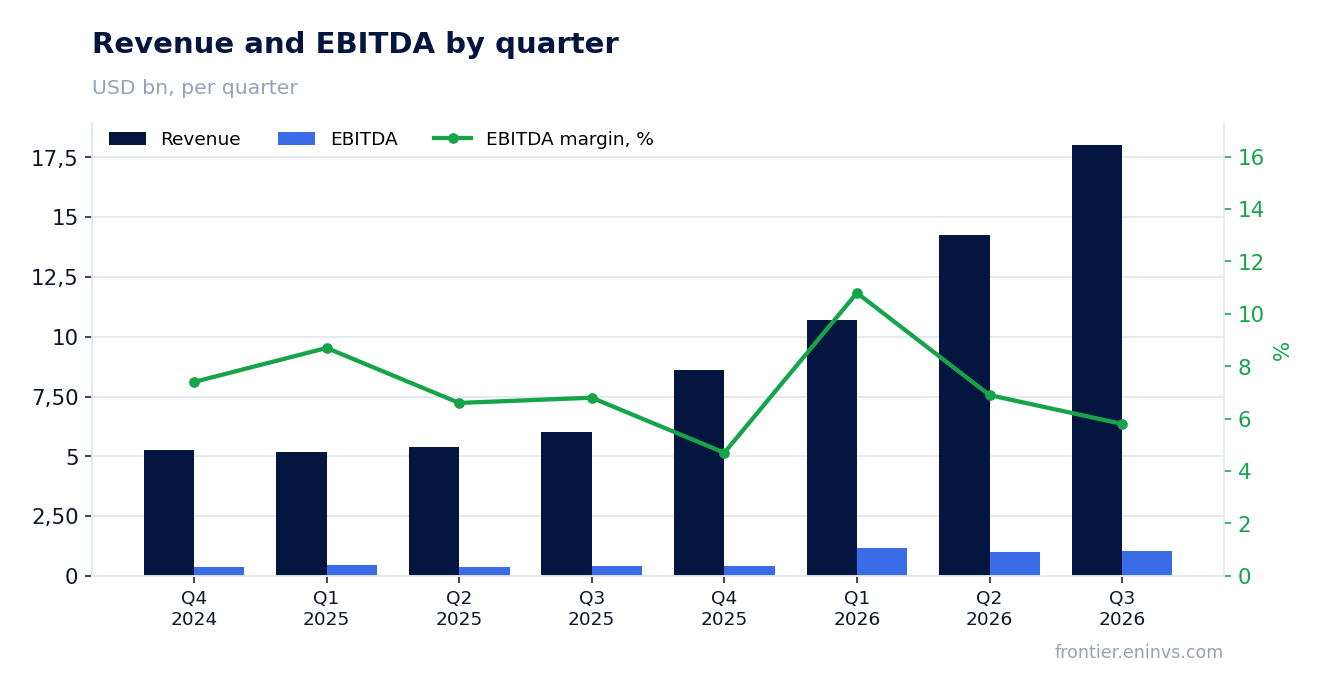
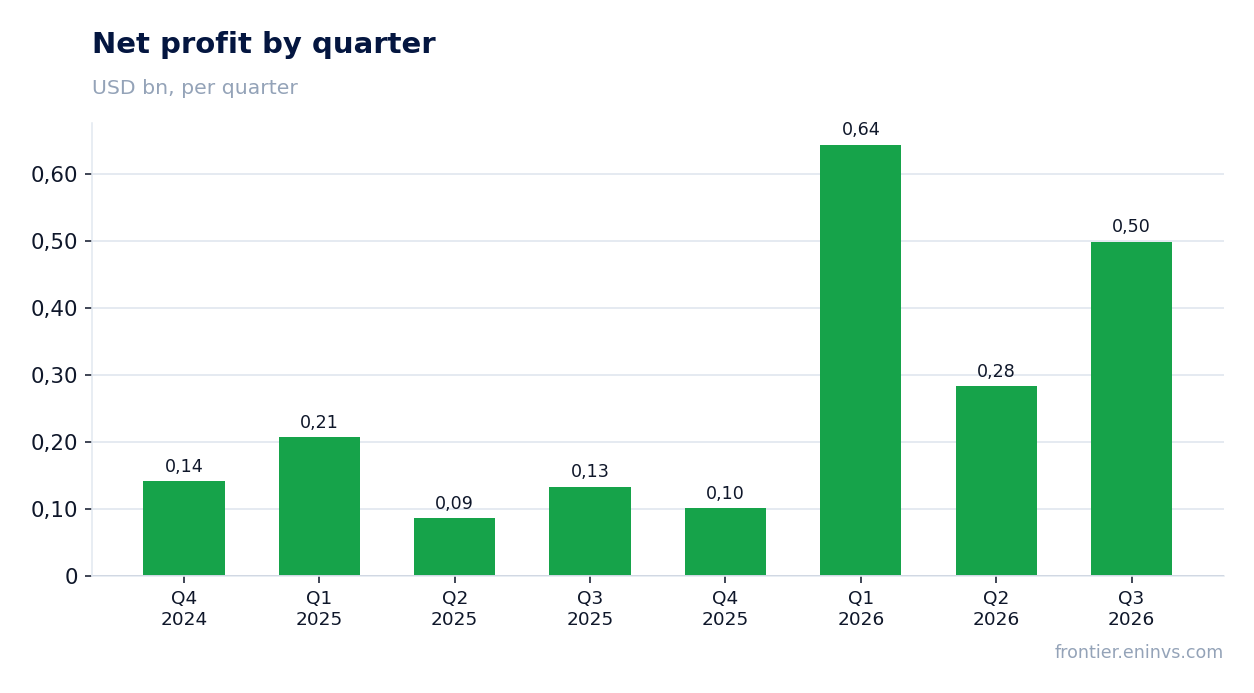
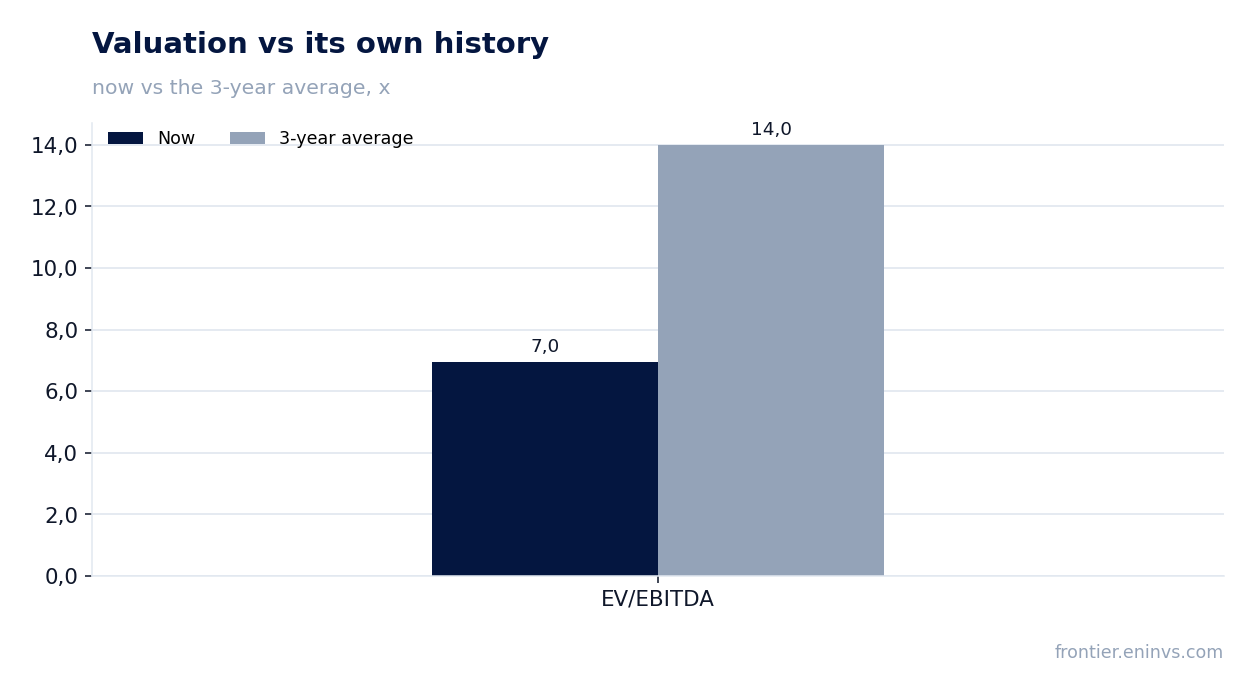
On November 3, Sunoco LP reported third-quarter 2026 results. Revenue reached $18,029 million versus $6,032 million a year earlier (+198.9%), adjusted EBITDA was $1,049 million (+155.2%), and net income was $499 million (+275.2%). The growth is entirely acquisition-driven – Parkland and other deals – not organic, while the EBITDA margin fell from 6.8% to 5.8%. At an EV/EBITDA of 7.0 against its own three-year average of 14.0 and a 4.2% dividend yield, the share looks attractive on price, but the verdict is held back by leverage of 4.32x EBITDA.
Key takeaways
— Revenue tripled, and all of the increase came from Parkland, not organic growth
— EBITDA margin compressed to 5.8%: fuel distribution brings volume, not margin
— The refinery added $238 million of EBITDA that did not exist a year ago
— Adjusted distributable cash flow of $588 million covers distributions of $267 million
— Net debt of $15.5 billion is 4.32x EBITDA, and it rose by $8.6 billion over the year
— The distribution has risen for eight consecutive quarters, yielding 4.2% at $1.0148
— EV/EBITDA of 7.0 is half its own three-year average of 14.0
Attractiveness
Key figures, USD bn
| Metric | Q3 2025 | Q3 2026 | Change |
|---|---|---|---|
| Revenue | 6.03 | 18.0 | +198.9% |
| EBITDA | 0.41 | 1.05 | +155.2% |
| Operating profit | 0.25 | 0.74 | +193.7% |
| Net profit | 0.13 | 0.50 | +275.2% |
| Operating cash flow | 0.40 | — | — |
| Capex | 0.16 | 0.24 | +51.0% |
| EBITDA margin | 6.8% | 5.8% | -1.0 pp |
| Net margin | 2.2% | 2.8% | +0.6 pp |
Revenue tripled, and all of the increase came from Parkland, not organic growth
Third-quarter 2026 revenue was $18,029 million versus $6,032 million a year earlier, growth of +198.9%. That is an acceleration from the second quarter, when growth was +164.5%. The release states directly that fuel distribution volumes rose primarily due to the Parkland acquisition, and terminals due to Parkland and TanQuid.
The organic business barely moved: the pipeline segment cut EBITDA from $182 million to $166 million, with throughput up only from 1,296 to 1,333 thousand barrels per day. All of the top-line increase is consolidation of acquired assets, not growth of existing ones.
For an investor this means year-on-year revenue comparisons are almost meaningless: the base is not comparable. The focus should be on absolute EBITDA and on how much of it comes from the acquired assets.
EBITDA margin compressed to 5.8%: fuel distribution brings volume, not margin
The EBITDA margin in the third quarter of 2026 was 5.8% versus 6.8% a year earlier. The cause is the revenue mix: fuel distribution sold 4,197 million gallons at a margin of 16.8 cents per gallon, and its revenue grows faster than profit. Fuel distribution segment EBITDA rose from $232 million to $523 million, but segment expenses rose by $255 million.
Terminals added $122 million of EBITDA versus $75 million, but expenses there also rose by $34 million on acquisitions. Pipelines, the most profitable segment, cut EBITDA to $166 million.
The margin compression is not a deterioration of the business but a consequence of Parkland operating in low-margin fuel distribution. The net margin, by contrast, rose from 2.2% to 2.8%: interest expense and depreciation grow slower than revenue.
The refinery added $238 million of EBITDA that did not exist a year ago
The refinery segment, which appeared after the Parkland acquisition, contributed $238 million of EBITDA in the third quarter of 2026. Crude utilisation was 99%, composite utilisation 105%, throughput 54 thousand barrels per day. A year earlier the segment did not exist.
It is the most profitable of the new assets: on revenue not disclosed separately, segment profit was $243 million with expenses of only $8 million. By comparison, fuel distribution earns $924 million of profit but carries $365 million of expenses.
The refinery accounts for a third of the group's adjusted EBITDA, and its contribution depends on the crack spread, which the release does not disclose. That is the key element to watch in the next quarter.
Adjusted distributable cash flow of $588 million covers distributions of $267 million
Adjusted distributable cash flow was $588 million versus $326 million a year earlier. Distributions to partners were $267 million, so coverage is more than twofold. Free cash flow after capital expenditure of $237 million remains positive.
Capex rose to $237 million, of which $121 million was growth and $116 million maintenance. A year earlier capex was $157 million. The increase is tied to integrating the acquired assets.
Operating cash flow for the quarter is not disclosed in the facts, but in the second quarter it was $1,101 million. Cash flow from operations remains sufficient to fund distributions and capex without adding debt.
Net debt of $15.5 billion is 4.32x EBITDA, and it rose by $8.6 billion over the year
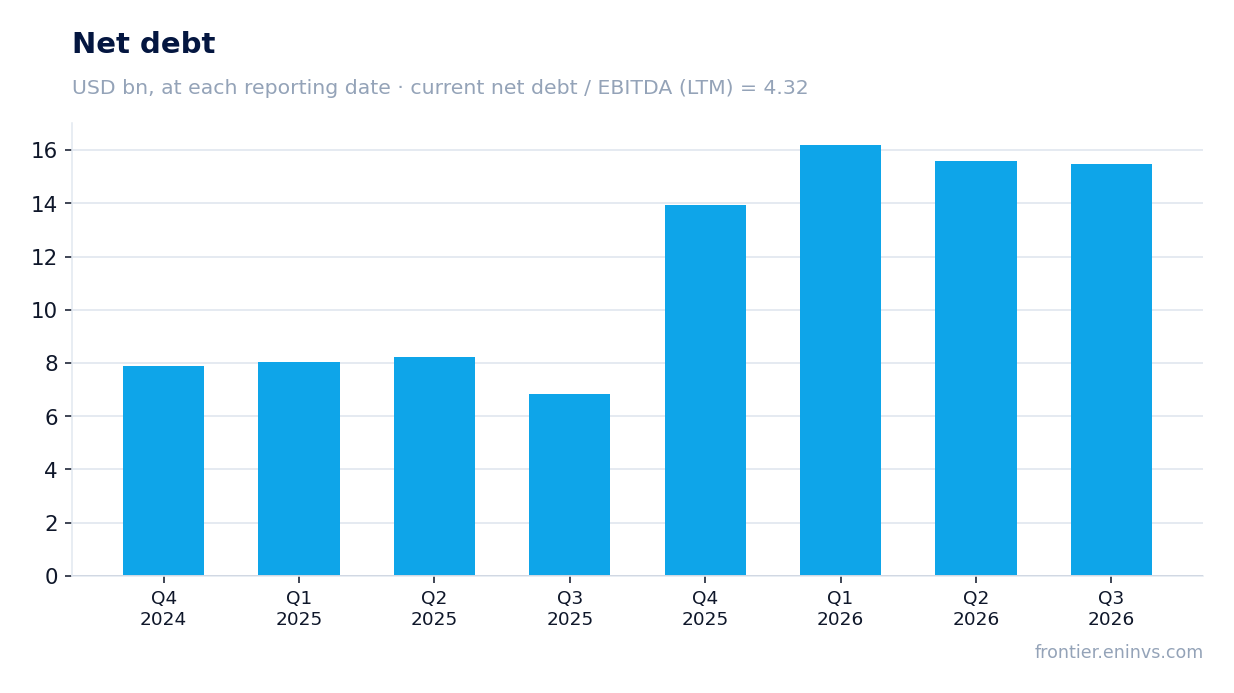
Net debt at September 30, 2026 was $15,470 million, or 4.32x trailing-twelve-month EBITDA. A year earlier, at September 30, 2025, it was $6,834 million, so it rose by $8.6 billion. Over the quarter debt fell from $15,575 million at June 30 to $15,470 million.
Debt rose to fund the Parkland acquisition. The company reports that its leverage ratio of net debt to adjusted EBITDA under the revolving credit facility was about 3.5x, and that it returned to its target in less than a year after the deal. That is below the 4.32x calculated on our data – the difference is in methodology.
Interest expense rose to $197 million from $131 million. Against quarterly EBITDA of $1,049 million, debt service costs about 19% of EBITDA. That is material but covered by cash flow.
The distribution has risen for eight consecutive quarters, yielding 4.2% at $1.0148
A distribution of $1.0148 per unit was declared for the third quarter of 2026, or $4.0592 annualised. That is 1.25% above the second quarter and more than 10% above a year earlier. It is the eighth consecutive quarterly increase, with a policy of at least 5% annual growth.
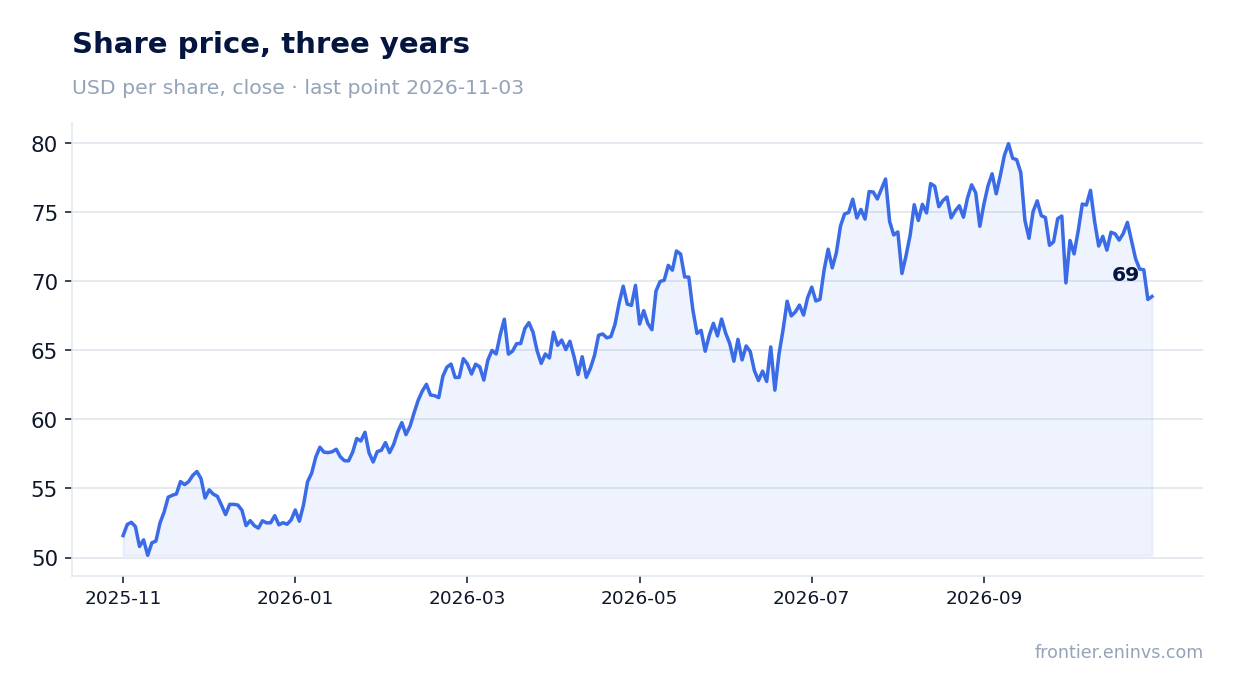
The trailing-twelve-month yield is 4.2%. At the pre-release price of $68.69, the annualised $4.0592 gives about 5.9% – above the 4.2% in the facts, because the fact counts what was actually paid over the year, not the annualised rate. Our estimate: at the current pace of growth, the 2026 payout could be about $4.0 per unit, giving about 5.8% at the current price.
Distribution coverage by adjusted DCF is more than twofold, so the risk of a cut is low. Only a fall in EBITDA or a debt increase requiring cash for repayment could reduce it.
EV/EBITDA of 7.0 is half its own three-year average of 14.0
The trailing-twelve-month EV/EBITDA is 7.0 against its own three-year average of 14.0, so the share trades at half its history. The trailing P/E is 6.2, ROE 7.9%. Market capitalisation is $9,454 million.
The low multiple reflects both leverage of 4.32x EBITDA and the fact that the market has not yet priced in the contribution of the acquired assets. On the portal's model, repricing EBITDA to current commodity prices at the target EV/EBITDA implies +220% upside to fair value. That is our own model, not a consensus.
The market reaction to the release was muted: the share added 0.3% on the publication day and 0.3% from the release to November 3. The market is waiting for confirmation that the acquired assets deliver sustainable profit.
Valuation on the latest reported figures
| Metric | Value |
|---|---|
| Market cap | 9.45 bn USD |
| P/E (LTM) | 6.2 |
| EV/EBITDA (LTM) | 7.0 |
| P/B | 1.18 |
| Net debt / EBITDA (LTM) | 4.32 |
| ROE | 7.9% |
| Dividend yield (12m) | 4.2% |
| EV/EBITDA, 3-year average | 14.0 |
Bottom line
The strong side of the report is cash flow: adjusted DCF of $588 million covers distributions of $267 million more than twofold, and the distribution has risen for eight consecutive quarters. The weak side is margin: the EBITDA margin compressed to 5.8% because growth comes from low-margin fuel distribution, while pipelines cut EBITDA. At a multiple of 7.0 against its own history of 14.0 and a yield of about 5.8%, the share looks attractive, but leverage of 4.32x EBITDA and dependence on the crack spread hold back the assessment. The verdict is 'rather attractive': the price is justified if the acquired assets hold profit at the current level.
Open the company's financial profile SUN →
See also: market overview · valuation map · stock screeners