PetroTal: Brent up 34% but EBITDA down 29% – the price never reached the P&L
Contents
On 13 November PetroTal released third-quarter 2026 results. Average Brent in the period was 91.3 dollars against 68 a year earlier (+34.2%), yet revenue fell 7.4% to 64.7 million dollars, EBITDA dropped 29.0% to 20.3 million and net profit turned negative at -5.5 million. At the year-ago volumes and costs, our calculation shows the price move should have produced revenue of 92.5 million and EBITDA of 51.3 million – the company earned 31.0 million of EBITDA less than the price allowed. Our conclusion: fairly valued – the portal model puts the upside to fair value at -9%. Our view: the share is fairly valued; upside on the portal model -9%.
Our view: is there upside
Our view in numbers
| Metric | Our read |
|---|---|
| Verdict | Neutral |
| Upside on the portal model | -9% |
| How the model works | spot model: EBITDA re-priced to current commodity prices at the target EV/EBITDA, against market cap |
| EV/EBITDA now and 3-year average | 2.5 vs 1.1 – a 132% premium to its history |
| Net debt / EBITDA | -0.73 – net cash |
| Strongest case for | A net cash position of 80.9 million dollars and operating cash flow of 34.1 million covering capex of 12.4 million almost threefold give the company a cushion most producers lack. |
| Strongest case against | With Brent at 91.3 dollars EBITDA was only 20.3 million against the 51.3 million the price allowed, and EV/EBITDA of 2.5, 132% above its own three-year average, leaves no cushion. |
| What would change the view | The verdict would move one step up if unit costs and volumes recover to the level today's Brent of 96.1 dollars pays for, and one step down if the EBITDA margin stays below 31.4% for another quarter. |
Key takeaways
— Brent rose 34.2% year on year, yet PetroTal's revenue still fell 7.4%
— At the year-ago volumes and costs, our calculation says the price should have delivered 51.3 million of EBITDA; the report shows 20.3 million – a 31.0 million gap
— The EBITDA margin compressed from 41.0% to 31.4%, and price does not explain it
— Net profit turned negative at -5.5 million dollars while operating profit was 4.8 million – items below the operating line made the difference
— Operating cash flow of 34.1 million covered capex of 12.4 million, and the net cash position reached 80.9 million
— EV/EBITDA of 2.5 is 132% above its own three-year average of 1.1 – on past prices the share is dearer than its history
— On the portal's spot model, EBITDA at current prices is 129.9 million against 95.9 million LTM, and EV/EBITDA is 2.0
Key figures, USD bn
| Metric | Q3 2025 | Q3 2026 | Change |
|---|---|---|---|
| Revenue | 0.07 | 0.06 | -7.4% |
| EBITDA | 0.03 | 0.02 | -29.0% |
| Operating profit | 0.02 | 0.00 | -73.3% |
| Net profit | 0.00 | -0.01 | -254.2% |
| Operating cash flow | 0.04 | 0.03 | -23.7% |
| Capex | 0.02 | 0.01 | -36.1% |
| EBITDA margin | 41.0% | 31.4% | -9.6 pp |
| Net margin | 5.2% | -8.6% | -13.8 pp |
Brent rose 34.2% year on year, yet PetroTal's revenue still fell 7.4%
Average Brent in the third quarter of 2026 was 91.3 dollars against 68 a year earlier – a rise of 34.2%. Against the previous quarter the price fell 5.6% from 96.8 dollars, and on 13 November spot stands at 96.1 dollars, 5.2% above the reported-period average.
Revenue for the quarter was 64.7 million dollars, 7.4% below a year earlier. The decline was milder than in the second quarter of 2026, when it was 9.3%: the pace of decline slowed but stayed negative.
For an oil producer this is the central question of the report: the price rose while sales in money terms fell. That points away from price and towards the volume sold or the price the company actually realised against Brent.
Commodity prices: period average and now
| Benchmark | Year ago | Q3 2026 | YoY | Spot 2026-11-13 |
|---|---|---|---|---|
| Brent, USD | 68,0 | 91,3 | +34,2% | 96,1 |
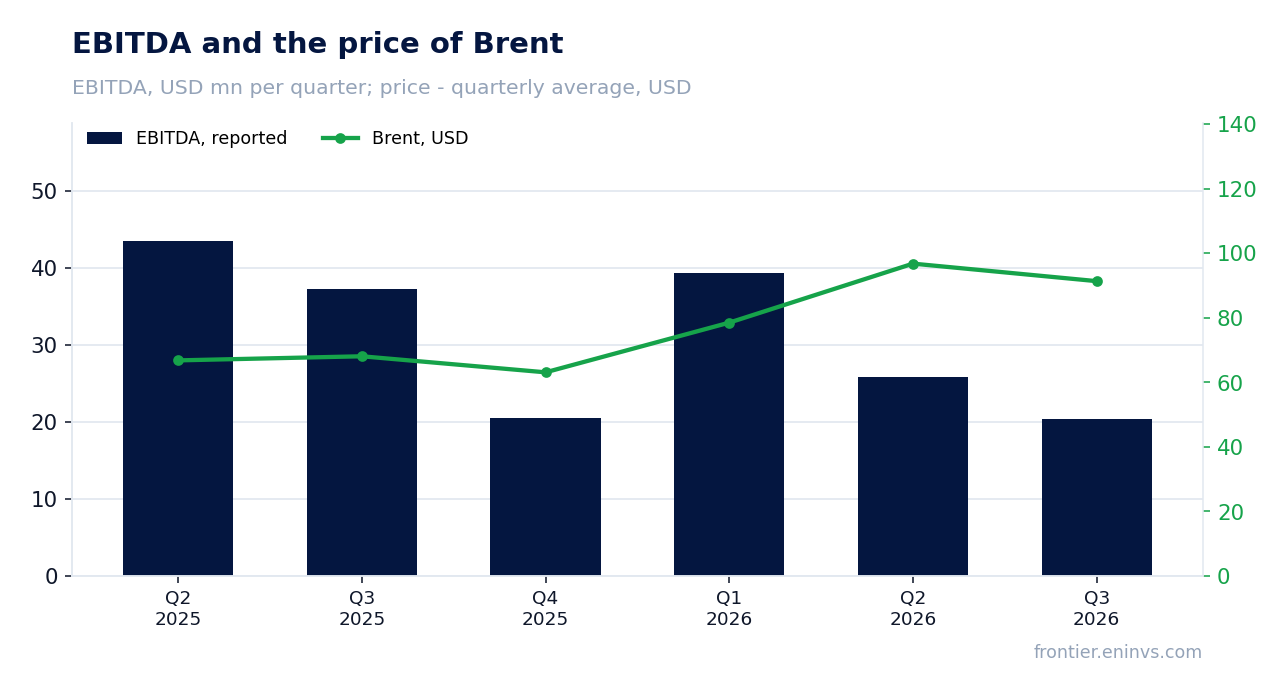
At the year-ago volumes and costs, our calculation says the price should have delivered 51.3 million of EBITDA; the report shows 20.3 million – a 31.0 million gap
Holding the volumes and non-commodity costs of the third quarter of 2025 and moving only the price, revenue would have been 92.5 million dollars and EBITDA 51.3 million. In fact the company reported 64.7 million of revenue and 20.3 million of EBITDA: a shortfall of 27.8 million on revenue and 31.0 million on EBITDA.
Against the previous quarter the picture is milder: at the volumes and costs of the second quarter of 2026, the price implied revenue of 66.9 million and EBITDA of 22.1 million, while the report showed 64.7 million and 20.3 million – a gap of 2.3 million and 1.8 million respectively.
A gap between price and result means the company either sold less oil, realised less per barrel against Brent, or saw unit costs rise. The facts carry no production or realised-price data, so the specific cause cannot be named – what is visible is that the price did not reach the P&L.
What the prices implied and what the company earned
| Base (Q3 2025) | Implied at period prices | Reported | Reported vs implied | |
|---|---|---|---|---|
| Revenue, USD mn | 69,8 | 92,5 | 64,7 | -30,1% |
| EBITDA, USD mn | 28,6 | 51,3 | 20,3 | -60,4% |
Revenue and EBITDA by quarter
| Period | Measure | bn USD |
|---|---|---|
| Q2 2025 | Revenue | 0.07791200000000001 |
| Q3 2025 | Revenue | 0.069825 |
| Q4 2025 | Revenue | 0.052821 |
| Q1 2026 | Revenue | 0.064136 |
| Q2 2026 | Revenue | 0.070705 |
| Q3 2026 | Revenue | 0.064663 |
| Q2 2025 | EBITDA | 0.043519 |
| Q3 2025 | EBITDA | 0.037223 |
| Q4 2025 | EBITDA | 0.020468999999999998 |
| Q1 2026 | EBITDA | 0.039333 |
| Q2 2026 | EBITDA | 0.025848 |
| Q3 2026 | EBITDA | 0.020317 |
EBITDA margin
| Period | Measure | % |
|---|---|---|
| Q2 2025 | EBITDA margin | 55.9 |
| Q3 2025 | EBITDA margin | 53.3 |
| Q4 2025 | EBITDA margin | 38.8 |
| Q1 2026 | EBITDA margin | 61.3 |
| Q2 2026 | EBITDA margin | 36.6 |
| Q3 2026 | EBITDA margin | 31.4 |
The EBITDA margin compressed from 41.0% to 31.4%, and price does not explain it
EBITDA for the quarter was 20.3 million dollars on revenue of 64.7 million – a margin of 31.4% against 41.0% a year earlier. The near-10-percentage-point compression came in a period of rising commodity prices, so the margin was not eaten by selling prices.
Our EBITDA is operating profit of 4.8 million plus depreciation of 15.5 million. Operating profit fell harder than EBITDA, which means the pressure came through operating costs rather than depreciation.
The net margin was -8.6% against 5.2% a year earlier. For a producer whose product price is rising, this margin dynamic is the main signal that unit costs or sales volumes are working against the company.
Net profit turned negative at -5.5 million dollars while operating profit was 4.8 million – items below the operating line made the difference
Operating profit for the quarter stayed positive at 4.8 million dollars, but net profit was -5.5 million. The 10.3 million gap arose below the operating line: those items are not in our EBITDA and explain only the net result.
A year earlier net profit was 3.6 million dollars, so the fall was 254.2%. Operating profit over the same period fell from 18.1 million to 4.8 million – the main pressure on the result came from operations, not from financing.
Over the last twelve months net profit remains positive at 6.8 million dollars, but the quarter is already loss-making. For a holder this means the LTM profit base rests on stronger earlier quarters, not on current momentum.
Operating cash flow of 34.1 million covered capex of 12.4 million, and the net cash position reached 80.9 million
Operating cash flow for the quarter was 34.1 million dollars – well above EBITDA of 20.3 million, typical of working-capital release. Capex was 12.4 million, so the flow covered it almost threefold.
At the end of September the company had a net cash position of 80.9 million dollars. Net debt to LTM EBITDA is -0.73 – there is no debt, there is a cash cushion.
On the portal's spot model at current prices, EBITDA is 129.9 million and net debt to EBITDA is -0.62. The balance sheet remains the company's strong side even in a weak quarter.
Valuation vs its own history
now vs the 3-year average
| Period | Measure | × |
|---|---|---|
| EV/EBITDA | Now | 2.4667720732232485 |
| EV/EBITDA | 3-year average | 1.0629210523870531 |
EV/EBITDA of 2.5 is 132% above its own three-year average of 1.1 – on past prices the share is dearer than its history
On an LTM EV/EBITDA of 2.5 the share trades 132% above its own three-year average of 1.1. That is a premium to its history, not a discount: on past earnings the company is valued dearer than usual.
P/E LTM is 50.6 – a high figure with LTM net profit of 6.8 million dollars and a market cap of 342.3 million. LTM profit was earned at weaker prices than today's, so P/E is a poor guide here.
On the portal's spot model at current prices, EV/EBITDA is 2.0 and the upside to fair value is -9%. The model already reflects today's Brent of 96.1 dollars, and even on that basis the cushion is negative.
Share price, three years
close, last point 2026-11-12
| Period | Measure | USD per share |
|---|---|---|
| 2025-11-12 | Closing price | 0.6700000166893005 |
| 2025-11-13 | Closing price | 0.44999998807907104 |
| 2025-11-14 | Closing price | 0.4300000071525574 |
| 2025-11-17 | Closing price | 0.4099999964237213 |
| 2025-11-18 | Closing price | 0.4000000059604645 |
| 2025-11-19 | Closing price | 0.4099999964237213 |
| 2025-11-20 | Closing price | 0.4099999964237213 |
| 2025-11-21 | Closing price | 0.38999998569488525 |
| 2025-11-24 | Closing price | 0.38999998569488525 |
| 2025-11-25 | Closing price | 0.38999998569488525 |
| 2025-11-26 | Closing price | 0.38999998569488525 |
| 2025-11-27 | Closing price | 0.38999998569488525 |
| 2025-11-28 | Closing price | 0.38999998569488525 |
| 2025-12-01 | Closing price | 0.4300000071525574 |
| 2025-12-02 | Closing price | 0.4099999964237213 |
| 2025-12-03 | Closing price | 0.41999998688697815 |
| 2025-12-04 | Closing price | 0.41999998688697815 |
| 2025-12-05 | Closing price | 0.4000000059604645 |
| 2025-12-08 | Closing price | 0.4000000059604645 |
| 2025-12-09 | Closing price | 0.4000000059604645 |
| 2025-12-10 | Closing price | 0.38999998569488525 |
| 2025-12-11 | Closing price | 0.3799999952316284 |
| 2025-12-12 | Closing price | 0.3799999952316284 |
| 2025-12-15 | Closing price | 0.3700000047683716 |
| 2025-12-16 | Closing price | 0.36000001430511475 |
| 2025-12-17 | Closing price | 0.3700000047683716 |
| 2025-12-18 | Closing price | 0.3700000047683716 |
| 2025-12-19 | Closing price | 0.38999998569488525 |
| 2025-12-22 | Closing price | 0.38999998569488525 |
| 2025-12-23 | Closing price | 0.38999998569488525 |
| 2025-12-24 | Closing price | 0.38999998569488525 |
| 2025-12-29 | Closing price | 0.3799999952316284 |
| 2025-12-30 | Closing price | 0.38999998569488525 |
| 2025-12-31 | Closing price | 0.38999998569488525 |
| 2026-01-02 | Closing price | 0.4000000059604645 |
| 2026-01-05 | Closing price | 0.4000000059604645 |
| 2026-01-06 | Closing price | 0.38999998569488525 |
| 2026-01-07 | Closing price | 0.4000000059604645 |
| 2026-01-08 | Closing price | 0.38999998569488525 |
| 2026-01-09 | Closing price | 0.38999998569488525 |
| 2026-01-12 | Closing price | 0.38999998569488525 |
| 2026-01-13 | Closing price | 0.41999998688697815 |
| 2026-01-14 | Closing price | 0.4399999976158142 |
| 2026-01-15 | Closing price | 0.4300000071525574 |
| 2026-01-16 | Closing price | 0.4300000071525574 |
| 2026-01-19 | Closing price | 0.4099999964237213 |
| 2026-01-20 | Closing price | 0.36000001430511475 |
| 2026-01-21 | Closing price | 0.36000001430511475 |
| 2026-01-22 | Closing price | 0.3700000047683716 |
| 2026-01-23 | Closing price | 0.3700000047683716 |
| 2026-01-26 | Closing price | 0.3700000047683716 |
| 2026-01-27 | Closing price | 0.3799999952316284 |
| 2026-01-28 | Closing price | 0.38999998569488525 |
| 2026-01-29 | Closing price | 0.4000000059604645 |
| 2026-01-30 | Closing price | 0.3799999952316284 |
| 2026-02-02 | Closing price | 0.4000000059604645 |
| 2026-02-03 | Closing price | 0.4000000059604645 |
| 2026-02-04 | Closing price | 0.41999998688697815 |
| 2026-02-05 | Closing price | 0.38999998569488525 |
| 2026-02-06 | Closing price | 0.4000000059604645 |
| 2026-02-09 | Closing price | 0.4099999964237213 |
| 2026-02-10 | Closing price | 0.4000000059604645 |
| 2026-02-11 | Closing price | 0.4000000059604645 |
| 2026-02-12 | Closing price | 0.4000000059604645 |
| 2026-02-13 | Closing price | 0.4000000059604645 |
| 2026-02-17 | Closing price | 0.4000000059604645 |
| 2026-02-18 | Closing price | 0.4000000059604645 |
| 2026-02-19 | Closing price | 0.4099999964237213 |
| 2026-02-20 | Closing price | 0.4099999964237213 |
| 2026-02-23 | Closing price | 0.4099999964237213 |
| 2026-02-24 | Closing price | 0.4099999964237213 |
| 2026-02-25 | Closing price | 0.4099999964237213 |
| 2026-02-26 | Closing price | 0.4099999964237213 |
| 2026-02-27 | Closing price | 0.4000000059604645 |
| 2026-03-02 | Closing price | 0.46000000834465027 |
| 2026-03-03 | Closing price | 0.44999998807907104 |
| 2026-03-04 | Closing price | 0.4399999976158142 |
| 2026-03-05 | Closing price | 0.47999998927116394 |
| 2026-03-06 | Closing price | 0.5 |
| 2026-03-09 | Closing price | 0.49000000953674316 |
| 2026-03-10 | Closing price | 0.5 |
| 2026-03-11 | Closing price | 0.49000000953674316 |
| 2026-03-12 | Closing price | 0.5299999713897705 |
| 2026-03-13 | Closing price | 0.5400000214576721 |
| 2026-03-16 | Closing price | 0.5099999904632568 |
| 2026-03-17 | Closing price | 0.5400000214576721 |
| 2026-03-18 | Closing price | 0.5600000023841858 |
| 2026-03-19 | Closing price | 0.5600000023841858 |
| 2026-03-20 | Closing price | 0.49000000953674316 |
| 2026-03-23 | Closing price | 0.5199999809265137 |
| 2026-03-24 | Closing price | 0.5199999809265137 |
| 2026-03-25 | Closing price | 0.5299999713897705 |
| 2026-03-26 | Closing price | 0.5199999809265137 |
| 2026-03-27 | Closing price | 0.5299999713897705 |
| 2026-03-30 | Closing price | 0.5799999833106995 |
| 2026-03-31 | Closing price | 0.5600000023841858 |
| 2026-04-01 | Closing price | 0.5099999904632568 |
| 2026-04-02 | Closing price | 0.5400000214576721 |
| 2026-04-06 | Closing price | 0.5299999713897705 |
| 2026-04-07 | Closing price | 0.550000011920929 |
| 2026-04-08 | Closing price | 0.5099999904632568 |
| 2026-04-09 | Closing price | 0.5099999904632568 |
| 2026-04-10 | Closing price | 0.49000000953674316 |
| 2026-04-13 | Closing price | 0.5099999904632568 |
| 2026-04-14 | Closing price | 0.49000000953674316 |
| 2026-04-15 | Closing price | 0.5 |
| 2026-04-16 | Closing price | 0.49000000953674316 |
| 2026-04-17 | Closing price | 0.4699999988079071 |
| 2026-04-20 | Closing price | 0.4699999988079071 |
| 2026-04-21 | Closing price | 0.5 |
| 2026-04-22 | Closing price | 0.5099999904632568 |
| 2026-04-23 | Closing price | 0.5099999904632568 |
| 2026-04-24 | Closing price | 0.5299999713897705 |
| 2026-04-27 | Closing price | 0.5400000214576721 |
| 2026-04-28 | Closing price | 0.5400000214576721 |
| 2026-04-29 | Closing price | 0.5400000214576721 |
| 2026-04-30 | Closing price | 0.5199999809265137 |
| 2026-05-01 | Closing price | 0.5299999713897705 |
| 2026-05-04 | Closing price | 0.5400000214576721 |
| 2026-05-05 | Closing price | 0.5299999713897705 |
| 2026-05-06 | Closing price | 0.5099999904632568 |
| 2026-05-07 | Closing price | 0.550000011920929 |
| 2026-05-08 | Closing price | 0.5600000023841858 |
| 2026-05-11 | Closing price | 0.5699999928474426 |
| 2026-05-12 | Closing price | 0.5699999928474426 |
| 2026-05-13 | Closing price | 0.5699999928474426 |
| 2026-05-14 | Closing price | 0.5799999833106995 |
| 2026-05-15 | Closing price | 0.5899999737739563 |
| 2026-05-19 | Closing price | 0.5699999928474426 |
| 2026-05-20 | Closing price | 0.5699999928474426 |
| 2026-05-21 | Closing price | 0.5699999928474426 |
| 2026-05-22 | Closing price | 0.6000000238418579 |
| 2026-05-25 | Closing price | 0.5699999928474426 |
| 2026-05-26 | Closing price | 0.5899999737739563 |
| 2026-05-27 | Closing price | 0.5799999833106995 |
| 2026-05-28 | Closing price | 0.5699999928474426 |
| 2026-05-29 | Closing price | 0.5799999833106995 |
| 2026-06-01 | Closing price | 0.6100000143051147 |
| 2026-06-02 | Closing price | 0.6000000238418579 |
| 2026-06-03 | Closing price | 0.6000000238418579 |
| 2026-06-04 | Closing price | 0.6000000238418579 |
| 2026-06-05 | Closing price | 0.5799999833106995 |
| 2026-06-08 | Closing price | 0.5899999737739563 |
| 2026-06-09 | Closing price | 0.5799999833106995 |
| 2026-06-10 | Closing price | 0.6000000238418579 |
| 2026-06-11 | Closing price | 0.6000000238418579 |
| 2026-06-12 | Closing price | 0.5899999737739563 |
| 2026-06-15 | Closing price | 0.5400000214576721 |
| 2026-06-16 | Closing price | 0.5 |
| 2026-06-17 | Closing price | 0.5099999904632568 |
| 2026-06-18 | Closing price | 0.5 |
| 2026-06-19 | Closing price | 0.5099999904632568 |
| 2026-06-22 | Closing price | 0.5099999904632568 |
| 2026-06-23 | Closing price | 0.49000000953674316 |
| 2026-06-24 | Closing price | 0.46000000834465027 |
| 2026-06-25 | Closing price | 0.46000000834465027 |
| 2026-06-26 | Closing price | 0.46000000834465027 |
| 2026-06-29 | Closing price | 0.44999998807907104 |
| 2026-06-30 | Closing price | 0.44999998807907104 |
| 2026-07-02 | Closing price | 0.46000000834465027 |
| 2026-07-03 | Closing price | 0.46000000834465027 |
| 2026-07-06 | Closing price | 0.44999998807907104 |
| 2026-07-07 | Closing price | 0.46000000834465027 |
| 2026-07-08 | Closing price | 0.49000000953674316 |
| 2026-07-09 | Closing price | 0.4699999988079071 |
| 2026-07-10 | Closing price | 0.47999998927116394 |
| 2026-07-13 | Closing price | 0.5 |
| 2026-07-14 | Closing price | 0.47999998927116394 |
| 2026-07-15 | Closing price | 0.47999998927116394 |
| 2026-07-16 | Closing price | 0.47999998927116394 |
| 2026-07-17 | Closing price | 0.47999998927116394 |
| 2026-07-20 | Closing price | 0.47999998927116394 |
| 2026-07-21 | Closing price | 0.47999998927116394 |
| 2026-07-22 | Closing price | 0.5099999904632568 |
| 2026-07-23 | Closing price | 0.5199999809265137 |
| 2026-07-24 | Closing price | 0.5 |
| 2026-07-27 | Closing price | 0.4699999988079071 |
| 2026-07-28 | Closing price | 0.46000000834465027 |
| 2026-07-29 | Closing price | 0.4699999988079071 |
| 2026-07-30 | Closing price | 0.4699999988079071 |
| 2026-07-31 | Closing price | 0.49000000953674316 |
| 2026-08-04 | Closing price | 0.46000000834465027 |
| 2026-08-05 | Closing price | 0.4699999988079071 |
| 2026-08-06 | Closing price | 0.49000000953674316 |
| 2026-08-07 | Closing price | 0.4699999988079071 |
| 2026-08-10 | Closing price | 0.49000000953674316 |
| 2026-08-11 | Closing price | 0.49000000953674316 |
| 2026-08-12 | Closing price | 0.47999998927116394 |
| 2026-08-13 | Closing price | 0.47999998927116394 |
| 2026-08-14 | Closing price | 0.5 |
| 2026-08-17 | Closing price | 0.5099999904632568 |
| 2026-08-18 | Closing price | 0.5099999904632568 |
| 2026-08-19 | Closing price | 0.5199999809265137 |
| 2026-08-20 | Closing price | 0.5400000214576721 |
| 2026-08-21 | Closing price | 0.550000011920929 |
| 2026-08-24 | Closing price | 0.5299999713897705 |
| 2026-08-25 | Closing price | 0.5099999904632568 |
| 2026-08-26 | Closing price | 0.5099999904632568 |
| 2026-08-27 | Closing price | 0.5400000214576721 |
| 2026-08-28 | Closing price | 0.5099999904632568 |
| 2026-08-31 | Closing price | 0.5199999809265137 |
| 2026-09-01 | Closing price | 0.550000011920929 |
| 2026-09-02 | Closing price | 0.5600000023841858 |
| 2026-09-03 | Closing price | 0.5400000214576721 |
| 2026-09-04 | Closing price | 0.550000011920929 |
| 2026-09-08 | Closing price | 0.550000011920929 |
| 2026-09-09 | Closing price | 0.5600000023841858 |
| 2026-09-10 | Closing price | 0.550000011920929 |
| 2026-09-11 | Closing price | 0.550000011920929 |
| 2026-09-14 | Closing price | 0.5600000023841858 |
| 2026-09-15 | Closing price | 0.5699999928474426 |
| 2026-09-16 | Closing price | 0.5799999833106995 |
| 2026-09-17 | Closing price | 0.5699999928474426 |
| 2026-09-18 | Closing price | 0.5799999833106995 |
| 2026-09-21 | Closing price | 0.550000011920929 |
| 2026-09-22 | Closing price | 0.550000011920929 |
| 2026-09-23 | Closing price | 0.5699999928474426 |
| 2026-09-24 | Closing price | 0.5899999737739563 |
| 2026-09-25 | Closing price | 0.5699999928474426 |
| 2026-09-28 | Closing price | 0.5600000023841858 |
| 2026-09-29 | Closing price | 0.550000011920929 |
| 2026-09-30 | Closing price | 0.5600000023841858 |
| 2026-10-01 | Closing price | 0.5600000023841858 |
| 2026-10-02 | Closing price | 0.5699999928474426 |
| 2026-10-05 | Closing price | 0.5699999928474426 |
| 2026-10-06 | Closing price | 0.550000011920929 |
| 2026-10-07 | Closing price | 0.5600000023841858 |
| 2026-10-08 | Closing price | 0.5600000023841858 |
| 2026-10-09 | Closing price | 0.5699999928474426 |
| 2026-10-13 | Closing price | 0.5799999833106995 |
| 2026-10-14 | Closing price | 0.5899999737739563 |
| 2026-10-15 | Closing price | 0.5899999737739563 |
| 2026-10-16 | Closing price | 0.6000000238418579 |
| 2026-10-19 | Closing price | 0.5899999737739563 |
| 2026-10-20 | Closing price | 0.5799999833106995 |
| 2026-10-21 | Closing price | 0.5799999833106995 |
| 2026-10-22 | Closing price | 0.5799999833106995 |
| 2026-10-23 | Closing price | 0.5899999737739563 |
| 2026-10-26 | Closing price | 0.5799999833106995 |
| 2026-10-27 | Closing price | 0.5699999928474426 |
| 2026-10-28 | Closing price | 0.5600000023841858 |
| 2026-10-29 | Closing price | 0.5600000023841858 |
| 2026-10-30 | Closing price | 0.5799999833106995 |
| 2026-11-02 | Closing price | 0.5400000214576721 |
| 2026-11-03 | Closing price | 0.5400000214576721 |
| 2026-11-04 | Closing price | 0.5099999904632568 |
| 2026-11-05 | Closing price | 0.5 |
| 2026-11-06 | Closing price | 0.5099999904632568 |
| 2026-11-09 | Closing price | 0.49000000953674316 |
| 2026-11-10 | Closing price | 0.5 |
| 2026-11-11 | Closing price | 0.5299999713897705 |
| 2026-11-12 | Closing price | 0.5299999713897705 |
On the portal's spot model, EBITDA at current prices is 129.9 million against 95.9 million LTM, and EV/EBITDA is 2.0
At today's commodity prices the company's EBITDA would be 129.9 million dollars against 95.9 million LTM – a rise of 35.4%. That is the earnings base the valuation should start from, because LTM reflects past prices.
On that base EV/EBITDA is 2.0 and net debt to EBITDA is -0.62. The multiple is lower than on LTM but still above the three-year average of 1.1.
Brent is what decides the verdict: at 96.1 dollars the cushion is negative, and a one-step upgrade in the assessment needs either a higher Brent or a recovery in volumes and unit costs to the level the price already pays for.
Valuation on the latest reported figures
| Metric | Value |
|---|---|
| Market cap | 0.34 bn USD |
| P/E (LTM) | 50.6 |
| EV/EBITDA (LTM) | 2.5 |
| P/B | 0.66 |
| Net debt / EBITDA (LTM) | -0.73 |
| Operating cash flow (LTM) | 0.09 bn |
| ROE | -4.2% |
| EV/EBITDA, 3-year average | 1.1 |
Net profit by quarter
| Period | Measure | bn USD |
|---|---|---|
| Q2 2025 | Net profit | 0.017513 |
| Q3 2025 | Net profit | 0.003599 |
| Q4 2025 | Net profit | −0.007777 |
| Q1 2026 | Net profit | 0.015297 |
| Q2 2026 | Net profit | 0.004796 |
| Q3 2026 | Net profit | −0.005549 |
Bottom line
The quarter's strong side remains the balance sheet: a net cash position of 80.9 million dollars and operating cash flow of 34.1 million that covered capex of 12.4 million almost threefold. The weakness is operational: with Brent at 91.3 dollars EBITDA was 20.3 million against the 51.3 million the price allowed, and the margin compressed from 41.0% to 31.4%. Part of the gap is explained by volumes and unit costs that the facts do not carry, so the durability of any recovery is not yet confirmed. On LTM the valuation is 132% above its own history, and even the portal's spot model gives -9% to fair value. Our conclusion: fairly valued – the portal model's upside is -9%. Our view: the share is fairly valued; upside on the portal model -9%.