TORM: profit up 2.6-fold, but revenue growth slowed from 110.3% to 45.8%
Contents
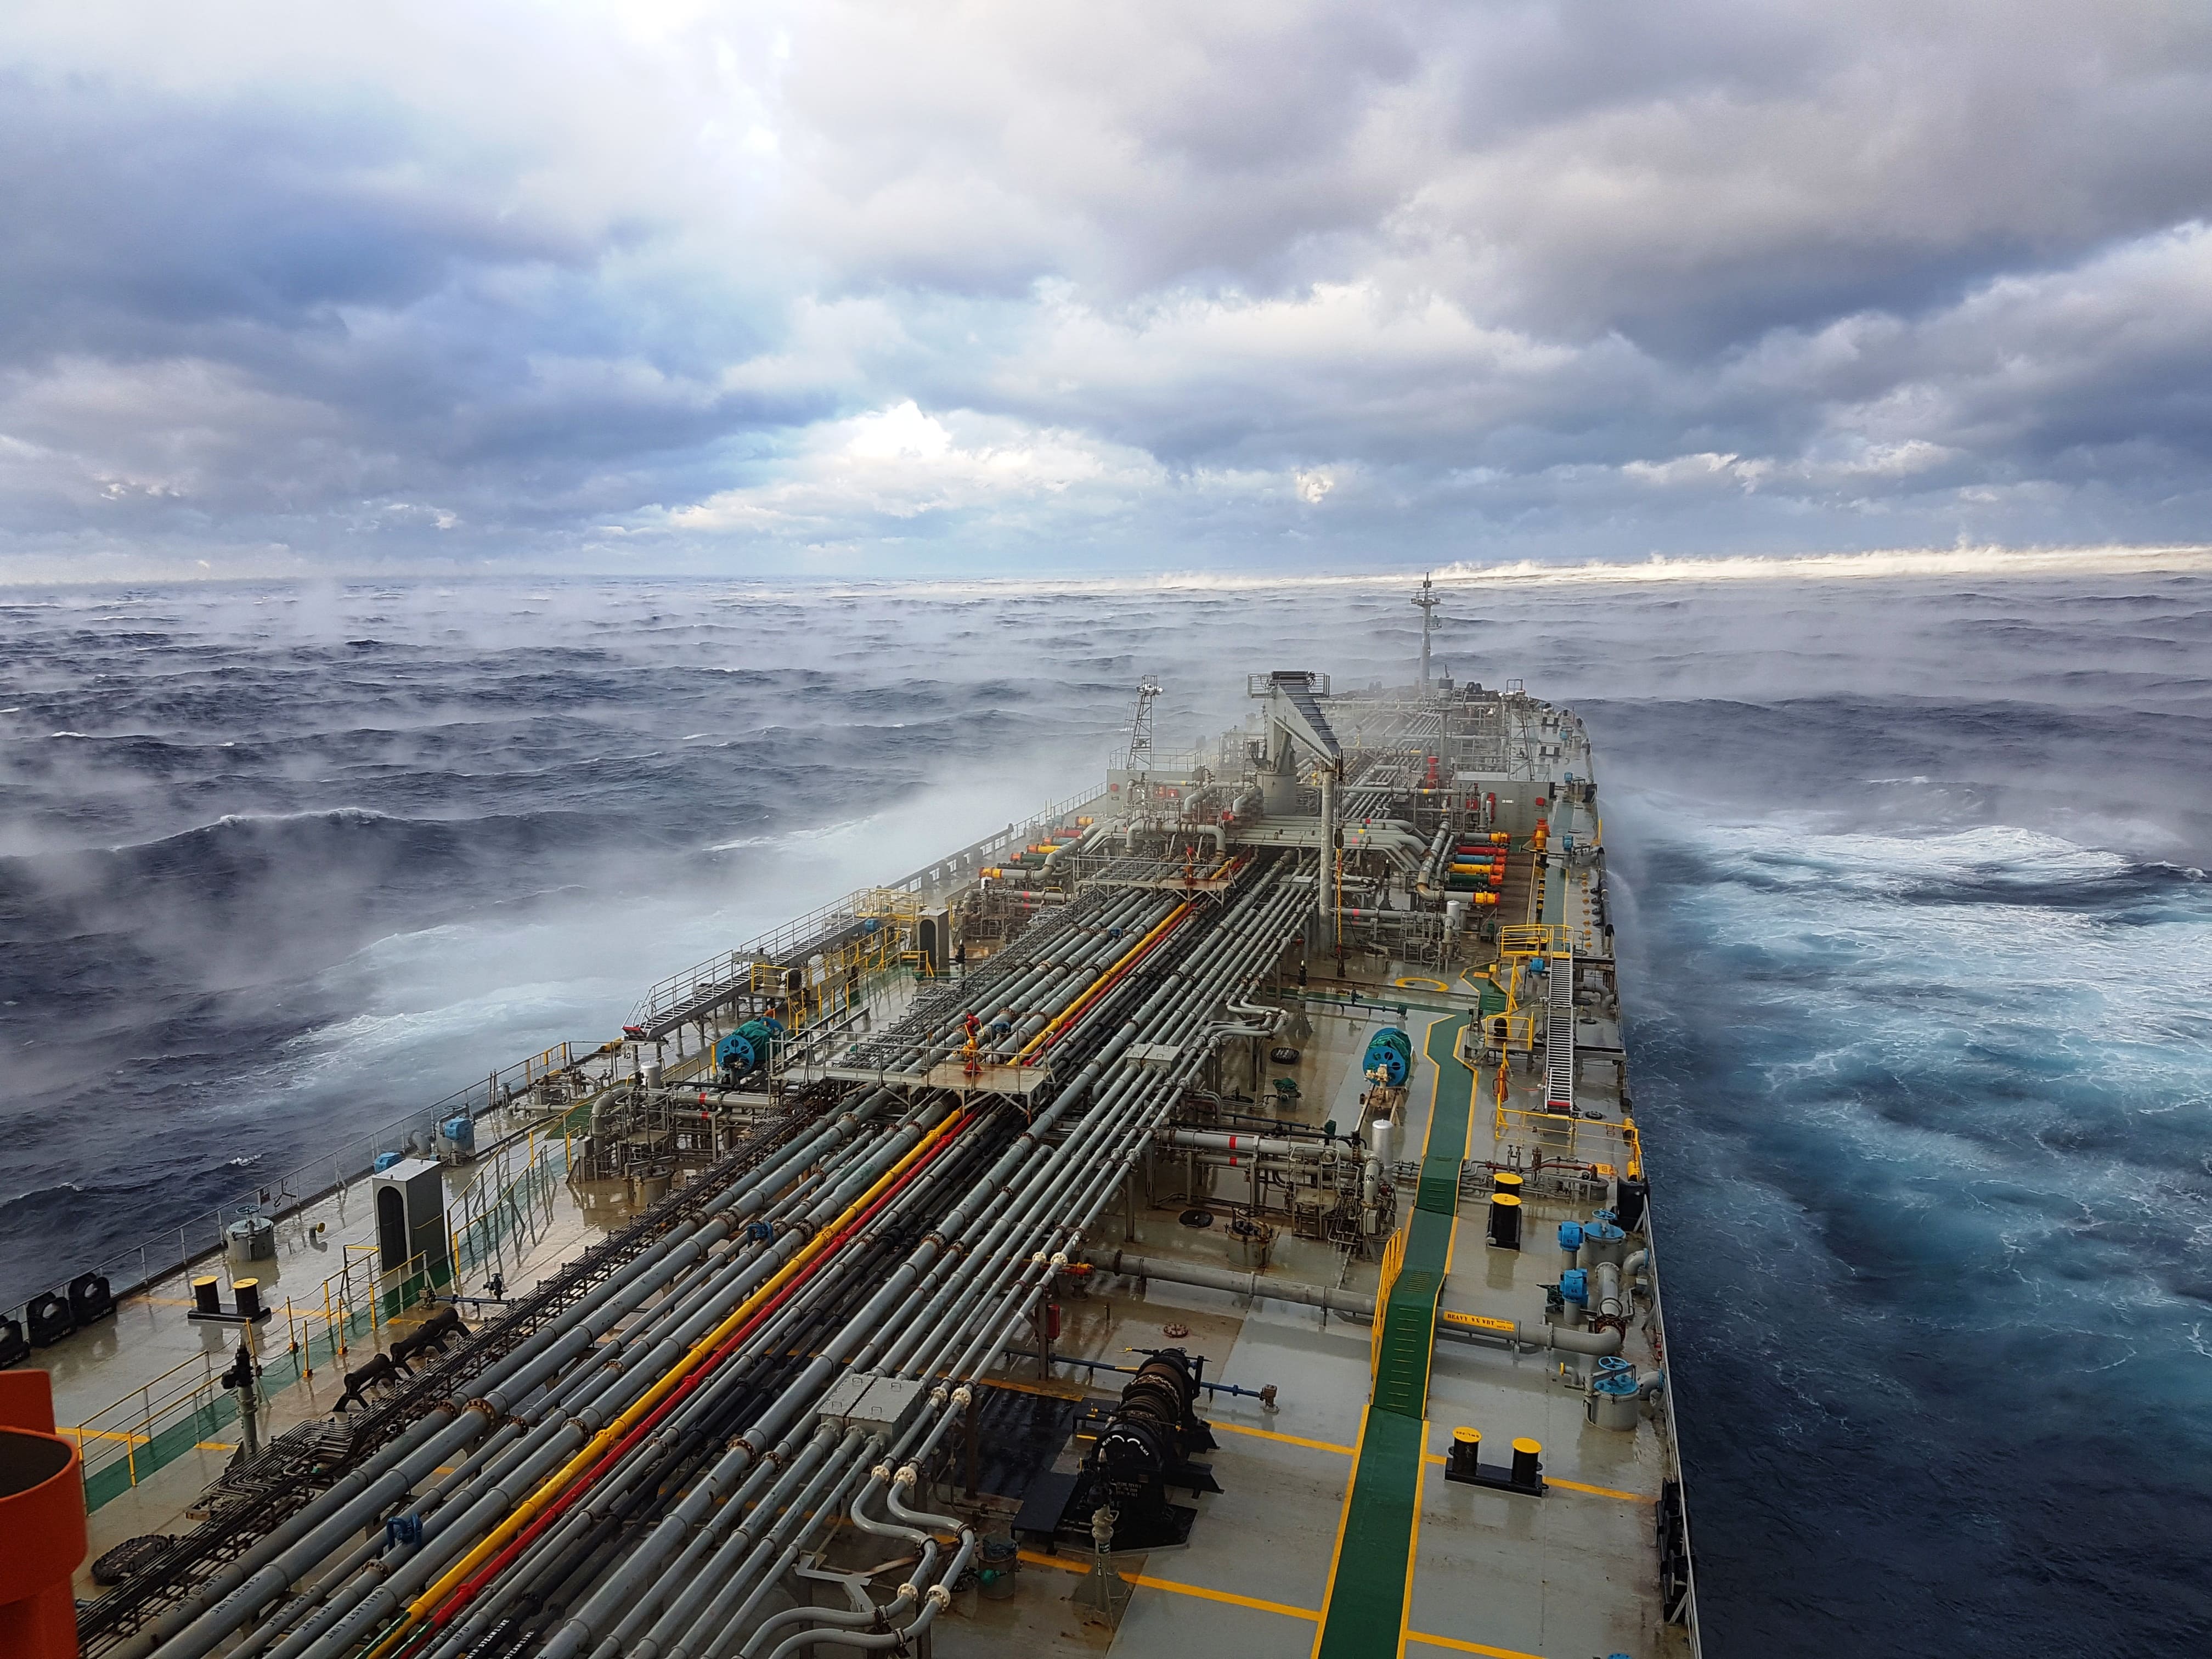
TORM's Q3 2026 results showed revenue of $499.4 million, EBITDA of $259.7 million and net profit of $199.1 million. Revenue grew 45.8% year on year, but this is a marked deceleration from 110.3% in Q2. The EBITDA margin reached 55.7% versus 45.4% a year earlier, and the net margin was 39.9% versus 22.7%. Our conclusion: rather attractive – the EV/EBITDA multiple of 4.1 is 7% below its own three-year average of 4.4, offering a moderate discount to history alongside a 12.9% dividend yield. Our view: the share is rather attractive at the current price; no portal model for this share; EV/EBITDA 4.1 against a 3-year average of 4.4, a 7% discount to its history.
Our view: is there upside
Our view in numbers
| Metric | Our read |
|---|---|
| Verdict | Rather attractive |
| Upside on the portal model | no portal model for this share |
| EV/EBITDA now and 3-year average | 4.1 vs 4.4 – a 7% discount to its history |
| Dividend yield, 12m | 12.9% |
| Net debt / EBITDA | 0.65 – low leverage |
| Strongest case for | A 12.9% dividend yield with net debt at just 0.65x EBITDA and quarterly operating cash flow of $264.5 million makes the share attractive for income. |
| Strongest case against | Revenue growth slowed from 110.3% to 45.8%, and if this trend continues, profit and the dividend will come under pressure. |
| What would change the view | If revenue exceeds $500 million next quarter and the EBITDA margin stays above 55%, the verdict could rise to 'attractive'. |
Key takeaways
— Revenue grew 45.8% year on year but slowed from 110.3% in Q2
— The EBITDA margin rose to 55.7% from 45.4% a year earlier, generating $259.7 million of EBITDA
— Net profit rose 156.6% to $199.1 million, with the net margin reaching 39.9%
— Operating cash flow of $264.5 million covered capital expenditure of $54.9 million almost fivefold
— Net debt of $689.1 million equals 0.65x LTM EBITDA
— A 12.9% dividend yield on trailing 12-month payouts remains the main argument for a holder
— EV/EBITDA of 4.1 is 7% below its own three-year average of 4.4 – the share is cheaper than its history
Key figures, USD bn
| Metric | Q3 2025 | Q3 2026 | Change |
|---|---|---|---|
| Revenue | 0.34 | 0.50 | +45.8% |
| EBITDA | 0.16 | 0.28 | +78.8% |
| Operating profit | 0.10 | 0.20 | +103.0% |
| Net profit | 0.08 | 0.20 | +156.6% |
| Operating cash flow | 0.12 | 0.26 | +121.3% |
| Capex | 0.04 | 0.05 | +50.4% |
| EBITDA margin | 45.4% | 55.7% | +10.3 pp |
| Net margin | 22.7% | 39.9% | +17.2 pp |
Revenue grew 45.8% year on year but slowed from 110.3% in Q2
In Q3 2026 TORM's revenue was $499.4 million, 45.8% above the same quarter a year earlier. That is strong growth, but it is markedly slower than the 110.3% increase in Q2.
The deceleration is largely explained by the high base: in Q2 2026 revenue reached $662.8 million, then fell to $499.4 million in Q3. The quarterly comparison shows that the revenue peak came in Q2, and in Q3 the company returned to a more moderate level.
For a holder, what matters more than the absolute record is the ability to keep revenue above $499 million. If the next quarter shows further deceleration in growth, that would be the first signal of a cooling market.
Revenue and EBITDA by quarter
| Period | Measure | bn USD |
|---|---|---|
| Q4 2023 | Revenue | 0.38780000000000003 |
| Q2 2024 | Revenue | 0.4377 |
| Q2 2025 | Revenue | 0.3152 |
| Q3 2025 | Revenue | 0.3426 |
| Q4 2025 | Revenue | 0.3526 |
| Q1 2026 | Revenue | 0.402 |
| Q2 2026 | Revenue | 0.6628 |
| Q3 2026 | Revenue | 0.49939999999999996 |
| Q4 2023 | EBITDA | 0.2344 |
| Q2 2024 | EBITDA | 0.25110000000000005 |
| Q2 2025 | EBITDA | 0.1213 |
| Q3 2025 | EBITDA | 0.15080000000000002 |
| Q4 2025 | EBITDA | 0.1536 |
| Q1 2026 | EBITDA | 0.197 |
| Q2 2026 | EBITDA | 0.4155 |
| Q3 2026 | EBITDA | 0.2597 |
EBITDA margin
| Period | Measure | % |
|---|---|---|
| Q4 2023 | EBITDA margin | 60.4 |
| Q2 2024 | EBITDA margin | 57.4 |
| Q2 2025 | EBITDA margin | 38.5 |
| Q3 2025 | EBITDA margin | 44.0 |
| Q4 2025 | EBITDA margin | 43.6 |
| Q1 2026 | EBITDA margin | 49.0 |
| Q2 2026 | EBITDA margin | 62.7 |
| Q3 2026 | EBITDA margin | 52.0 |
The EBITDA margin rose to 55.7% from 45.4% a year earlier, generating $259.7 million of EBITDA
EBITDA in Q3 2026 was $259.7 million, up 78.8% year on year. The EBITDA margin reached 55.7% versus 45.4% in Q3 2025 – an increase of 10.3 percentage points.
This margin level means the company maintains high operating efficiency even as revenue growth slows. Operating profit was $198.3 million, and the $61.4 million gap between EBITDA and operating profit reflects depreciation.
Margin resilience above 55% is a key argument that profitability was not a one-off. If the margin holds near this level, annual cash flow will remain strong.
Net profit by quarter
| Period | Measure | bn USD |
|---|---|---|
| Q4 2023 | Net profit | 0.18430000000000002 |
| Q2 2024 | Net profit | 0.1945 |
| Q2 2025 | Net profit | 0.0586 |
| Q3 2025 | Net profit | 0.07759999999999999 |
| Q4 2025 | Net profit | 0.0868 |
| Q1 2026 | Net profit | 0.12240000000000001 |
| Q2 2026 | Net profit | 0.3383 |
| Q3 2026 | Net profit | 0.1991 |
Net profit rose 156.6% to $199.1 million, with the net margin reaching 39.9%
TORM's net profit in Q3 2026 was $199.1 million, 156.6% above the Q3 2025 result. The net margin reached 39.9% versus 22.7% a year earlier.
Profit growth outpaces revenue growth, indicating improved profitability across the cost chain. On revenue of $499.4 million the company earned almost $200 million net – a high figure for the shipping business.
Profit over the last 12 months was $746.6 million, and with a market capitalisation of $3,474.7 million the P/E LTM is 4.65. This is a low earnings valuation that reflects the cyclical nature of the industry.
Operating cash flow of $264.5 million covered capital expenditure of $54.9 million almost fivefold
Operating cash flow in Q3 2026 was $264.5 million with capital expenditure of $54.9 million. Free cash flow before dividends exceeded $209 million, covering shareholder payouts.
Capital expenditure remains moderate relative to revenue – about 11% of quarterly turnover. This means the company is not burdened by a large investment programme and can direct a significant part of the flow to dividends.
Over the last 12 months operating cash flow reached $854.9 million. Such a volume of cash with capital expenditure below $55 million per quarter confirms that the dividend base is backed by real cash flow, not borrowed funds.
Valuation vs its own history
now vs the 3-year average
| Period | Measure | × |
|---|---|---|
| EV/EBITDA | Now | 4.059074493861243 |
| EV/EBITDA | 3-year average | 4.366043312930622 |
Net debt of $689.1 million equals 0.65x LTM EBITDA
At the end of Q3 2026 TORM's net debt was $689.1 million. With LTM EBITDA of $1,064.2 million, the net debt / EBITDA ratio is 0.65.
This debt level means the company could repay it in less than a year of operating profit. Low leverage provides a cushion against a fall in freight rates and allows dividend payments to be maintained even in a weak year.
Interest expenses are not disclosed in the facts, but at this debt level they are not the main risk to profit. The key question is not debt servicing but revenue resilience.
Share price, three years
close, last point 2026-11-10
| Period | Measure | USD per share |
|---|---|---|
| 2025-11-10 | Closing price | 23.479999542236328 |
| 2025-11-11 | Closing price | 23.3700008392334 |
| 2025-11-12 | Closing price | 23.5 |
| 2025-11-13 | Closing price | 23.0 |
| 2025-11-14 | Closing price | 23.020000457763672 |
| 2025-11-17 | Closing price | 22.860000610351562 |
| 2025-11-18 | Closing price | 23.139999389648438 |
| 2025-11-19 | Closing price | 22.8799991607666 |
| 2025-11-20 | Closing price | 21.969999313354492 |
| 2025-11-21 | Closing price | 22.479999542236328 |
| 2025-11-24 | Closing price | 21.719999313354492 |
| 2025-11-25 | Closing price | 21.260000228881836 |
| 2025-11-26 | Closing price | 21.1299991607666 |
| 2025-11-28 | Closing price | 21.40999984741211 |
| 2025-12-01 | Closing price | 20.93000030517578 |
| 2025-12-02 | Closing price | 21.149999618530273 |
| 2025-12-03 | Closing price | 21.329999923706055 |
| 2025-12-04 | Closing price | 21.270000457763672 |
| 2025-12-05 | Closing price | 21.239999771118164 |
| 2025-12-08 | Closing price | 21.1299991607666 |
| 2025-12-09 | Closing price | 20.670000076293945 |
| 2025-12-10 | Closing price | 20.75 |
| 2025-12-11 | Closing price | 20.760000228881836 |
| 2025-12-12 | Closing price | 20.510000228881836 |
| 2025-12-15 | Closing price | 20.469999313354492 |
| 2025-12-16 | Closing price | 20.030000686645508 |
| 2025-12-17 | Closing price | 20.0 |
| 2025-12-18 | Closing price | 19.670000076293945 |
| 2025-12-19 | Closing price | 19.530000686645508 |
| 2025-12-22 | Closing price | 19.459999084472656 |
| 2025-12-23 | Closing price | 19.389999389648438 |
| 2025-12-24 | Closing price | 19.420000076293945 |
| 2025-12-26 | Closing price | 19.530000686645508 |
| 2025-12-29 | Closing price | 19.959999084472656 |
| 2025-12-30 | Closing price | 19.540000915527344 |
| 2025-12-31 | Closing price | 19.579999923706055 |
| 2026-01-02 | Closing price | 19.790000915527344 |
| 2026-01-05 | Closing price | 19.90999984741211 |
| 2026-01-06 | Closing price | 20.469999313354492 |
| 2026-01-07 | Closing price | 22.06999969482422 |
| 2026-01-08 | Closing price | 22.850000381469727 |
| 2026-01-09 | Closing price | 22.469999313354492 |
| 2026-01-12 | Closing price | 22.459999084472656 |
| 2026-01-13 | Closing price | 23.440000534057617 |
| 2026-01-14 | Closing price | 23.260000228881836 |
| 2026-01-15 | Closing price | 22.729999542236328 |
| 2026-01-16 | Closing price | 22.670000076293945 |
| 2026-01-20 | Closing price | 22.09000015258789 |
| 2026-01-21 | Closing price | 22.670000076293945 |
| 2026-01-22 | Closing price | 22.40999984741211 |
| 2026-01-23 | Closing price | 22.670000076293945 |
| 2026-01-26 | Closing price | 22.84000015258789 |
| 2026-01-27 | Closing price | 23.329999923706055 |
| 2026-01-28 | Closing price | 24.530000686645508 |
| 2026-01-29 | Closing price | 24.299999237060547 |
| 2026-01-30 | Closing price | 24.34000015258789 |
| 2026-02-02 | Closing price | 24.520000457763672 |
| 2026-02-03 | Closing price | 24.709999084472656 |
| 2026-02-04 | Closing price | 24.290000915527344 |
| 2026-02-05 | Closing price | 24.139999389648438 |
| 2026-02-06 | Closing price | 24.899999618530273 |
| 2026-02-09 | Closing price | 24.829999923706055 |
| 2026-02-10 | Closing price | 25.25 |
| 2026-02-11 | Closing price | 25.530000686645508 |
| 2026-02-12 | Closing price | 24.969999313354492 |
| 2026-02-13 | Closing price | 25.889999389648438 |
| 2026-02-17 | Closing price | 25.81999969482422 |
| 2026-02-18 | Closing price | 26.540000915527344 |
| 2026-02-19 | Closing price | 27.170000076293945 |
| 2026-02-20 | Closing price | 27.469999313354492 |
| 2026-02-23 | Closing price | 27.270000457763672 |
| 2026-02-24 | Closing price | 27.670000076293945 |
| 2026-02-25 | Closing price | 27.739999771118164 |
| 2026-02-26 | Closing price | 29.18000030517578 |
| 2026-02-27 | Closing price | 30.1299991607666 |
| 2026-03-02 | Closing price | 30.940000534057617 |
| 2026-03-03 | Closing price | 30.899999618530273 |
| 2026-03-04 | Closing price | 30.760000228881836 |
| 2026-03-05 | Closing price | 28.989999771118164 |
| 2026-03-06 | Closing price | 28.239999771118164 |
| 2026-03-09 | Closing price | 28.670000076293945 |
| 2026-03-10 | Closing price | 28.350000381469727 |
| 2026-03-11 | Closing price | 27.229999542236328 |
| 2026-03-12 | Closing price | 24.639999389648438 |
| 2026-03-13 | Closing price | 24.270000457763672 |
| 2026-03-16 | Closing price | 25.290000915527344 |
| 2026-03-17 | Closing price | 24.850000381469727 |
| 2026-03-18 | Closing price | 25.760000228881836 |
| 2026-03-19 | Closing price | 26.3700008392334 |
| 2026-03-20 | Closing price | 25.709999084472656 |
| 2026-03-23 | Closing price | 26.610000610351562 |
| 2026-03-24 | Closing price | 28.1299991607666 |
| 2026-03-25 | Closing price | 27.649999618530273 |
| 2026-03-26 | Closing price | 27.190000534057617 |
| 2026-03-27 | Closing price | 27.469999313354492 |
| 2026-03-30 | Closing price | 27.3799991607666 |
| 2026-03-31 | Closing price | 27.899999618530273 |
| 2026-04-01 | Closing price | 28.010000228881836 |
| 2026-04-02 | Closing price | 29.100000381469727 |
| 2026-04-06 | Closing price | 29.579999923706055 |
| 2026-04-07 | Closing price | 29.5 |
| 2026-04-08 | Closing price | 29.90999984741211 |
| 2026-04-09 | Closing price | 29.790000915527344 |
| 2026-04-10 | Closing price | 29.31999969482422 |
| 2026-04-13 | Closing price | 30.350000381469727 |
| 2026-04-14 | Closing price | 29.5 |
| 2026-04-15 | Closing price | 30.280000686645508 |
| 2026-04-16 | Closing price | 29.770000457763672 |
| 2026-04-17 | Closing price | 30.299999237060547 |
| 2026-04-20 | Closing price | 30.690000534057617 |
| 2026-04-21 | Closing price | 30.040000915527344 |
| 2026-04-22 | Closing price | 30.149999618530273 |
| 2026-04-23 | Closing price | 30.530000686645508 |
| 2026-04-24 | Closing price | 31.15999984741211 |
| 2026-04-27 | Closing price | 31.270000457763672 |
| 2026-04-28 | Closing price | 31.969999313354492 |
| 2026-04-29 | Closing price | 32.09000015258789 |
| 2026-04-30 | Closing price | 32.54999923706055 |
| 2026-05-01 | Closing price | 32.560001373291016 |
| 2026-05-04 | Closing price | 33.060001373291016 |
| 2026-05-05 | Closing price | 34.869998931884766 |
| 2026-05-06 | Closing price | 32.90999984741211 |
| 2026-05-07 | Closing price | 33.11000061035156 |
| 2026-05-08 | Closing price | 33.91999816894531 |
| 2026-05-11 | Closing price | 34.09000015258789 |
| 2026-05-12 | Closing price | 34.56999969482422 |
| 2026-05-13 | Closing price | 32.63999938964844 |
| 2026-05-14 | Closing price | 31.559999465942383 |
| 2026-05-15 | Closing price | 32.029998779296875 |
| 2026-05-18 | Closing price | 32.4900016784668 |
| 2026-05-19 | Closing price | 31.68000030517578 |
| 2026-05-20 | Closing price | 32.70000076293945 |
| 2026-05-21 | Closing price | 32.4900016784668 |
| 2026-05-22 | Closing price | 31.290000915527344 |
| 2026-05-26 | Closing price | 30.770000457763672 |
| 2026-05-27 | Closing price | 29.81999969482422 |
| 2026-05-28 | Closing price | 27.959999084472656 |
| 2026-05-29 | Closing price | 27.239999771118164 |
| 2026-06-01 | Closing price | 28.020000457763672 |
| 2026-06-02 | Closing price | 28.139999389648438 |
| 2026-06-03 | Closing price | 28.170000076293945 |
| 2026-06-04 | Closing price | 28.100000381469727 |
| 2026-06-05 | Closing price | 28.440000534057617 |
| 2026-06-08 | Closing price | 28.690000534057617 |
| 2026-06-09 | Closing price | 28.959999084472656 |
| 2026-06-10 | Closing price | 29.18000030517578 |
| 2026-06-11 | Closing price | 28.950000762939453 |
| 2026-06-12 | Closing price | 30.399999618530273 |
| 2026-06-15 | Closing price | 30.049999237060547 |
| 2026-06-16 | Closing price | 29.719999313354492 |
| 2026-06-17 | Closing price | 29.020000457763672 |
| 2026-06-18 | Closing price | 29.40999984741211 |
| 2026-06-22 | Closing price | 30.270000457763672 |
| 2026-06-23 | Closing price | 29.139999389648438 |
| 2026-06-24 | Closing price | 28.700000762939453 |
| 2026-06-25 | Closing price | 27.700000762939453 |
| 2026-06-26 | Closing price | 26.809999465942383 |
| 2026-06-29 | Closing price | 26.309999465942383 |
| 2026-06-30 | Closing price | 26.059999465942383 |
| 2026-07-01 | Closing price | 26.25 |
| 2026-07-02 | Closing price | 27.700000762939453 |
| 2026-07-06 | Closing price | 27.989999771118164 |
| 2026-07-07 | Closing price | 28.350000381469727 |
| 2026-07-08 | Closing price | 29.040000915527344 |
| 2026-07-09 | Closing price | 28.059999465942383 |
| 2026-07-10 | Closing price | 29.479999542236328 |
| 2026-07-13 | Closing price | 28.860000610351562 |
| 2026-07-14 | Closing price | 29.424999237060547 |
| 2026-07-15 | Closing price | 29.639999389648438 |
| 2026-07-16 | Closing price | 29.399999618530273 |
| 2026-07-17 | Closing price | 28.450000762939453 |
| 2026-07-20 | Closing price | 29.079999923706055 |
| 2026-07-21 | Closing price | 29.899999618530273 |
| 2026-07-22 | Closing price | 29.479999542236328 |
| 2026-07-23 | Closing price | 30.190000534057617 |
| 2026-07-24 | Closing price | 30.280000686645508 |
| 2026-07-27 | Closing price | 29.799999237060547 |
| 2026-07-28 | Closing price | 29.799999237060547 |
| 2026-07-29 | Closing price | 29.829999923706055 |
| 2026-07-30 | Closing price | 30.239999771118164 |
| 2026-07-31 | Closing price | 30.309999465942383 |
| 2026-08-03 | Closing price | 30.18000030517578 |
| 2026-08-04 | Closing price | 29.360000610351562 |
| 2026-08-05 | Closing price | 28.6200008392334 |
| 2026-08-06 | Closing price | 29.489999771118164 |
| 2026-08-07 | Closing price | 29.489999771118164 |
| 2026-08-10 | Closing price | 29.190000534057617 |
| 2026-08-11 | Closing price | 28.6299991607666 |
| 2026-08-12 | Closing price | 28.969999313354492 |
| 2026-08-13 | Closing price | 29.3700008392334 |
| 2026-08-14 | Closing price | 30.079999923706055 |
| 2026-08-17 | Closing price | 30.610000610351562 |
| 2026-08-18 | Closing price | 30.200000762939453 |
| 2026-08-19 | Closing price | 30.969999313354492 |
| 2026-08-20 | Closing price | 31.059999465942383 |
| 2026-08-21 | Closing price | 31.799999237060547 |
| 2026-08-24 | Closing price | 31.639999389648438 |
| 2026-08-25 | Closing price | 31.469999313354492 |
| 2026-08-26 | Closing price | 30.079999923706055 |
| 2026-08-27 | Closing price | 31.799999237060547 |
| 2026-08-28 | Closing price | 32.619998931884766 |
| 2026-08-31 | Closing price | 32.810001373291016 |
| 2026-09-01 | Closing price | 33.209999084472656 |
| 2026-09-02 | Closing price | 33.849998474121094 |
| 2026-09-03 | Closing price | 34.18000030517578 |
| 2026-09-04 | Closing price | 35.18000030517578 |
| 2026-09-08 | Closing price | 34.939998626708984 |
| 2026-09-09 | Closing price | 35.459999084472656 |
| 2026-09-10 | Closing price | 34.599998474121094 |
| 2026-09-11 | Closing price | 35.08000183105469 |
| 2026-09-14 | Closing price | 35.34000015258789 |
| 2026-09-15 | Closing price | 34.93000030517578 |
| 2026-09-16 | Closing price | 36.599998474121094 |
| 2026-09-17 | Closing price | 36.630001068115234 |
| 2026-09-18 | Closing price | 38.22999954223633 |
| 2026-09-21 | Closing price | 37.119998931884766 |
| 2026-09-22 | Closing price | 34.630001068115234 |
| 2026-09-23 | Closing price | 34.41999816894531 |
| 2026-09-24 | Closing price | 34.29999923706055 |
| 2026-09-25 | Closing price | 34.31999969482422 |
| 2026-09-28 | Closing price | 35.41999816894531 |
| 2026-09-29 | Closing price | 36.150001525878906 |
| 2026-09-30 | Closing price | 38.04999923706055 |
| 2026-10-01 | Closing price | 38.79999923706055 |
| 2026-10-02 | Closing price | 40.0 |
| 2026-10-05 | Closing price | 41.04999923706055 |
| 2026-10-06 | Closing price | 39.04999923706055 |
| 2026-10-07 | Closing price | 38.91999816894531 |
| 2026-10-08 | Closing price | 40.060001373291016 |
| 2026-10-09 | Closing price | 39.939998626708984 |
| 2026-10-12 | Closing price | 40.91999816894531 |
| 2026-10-13 | Closing price | 41.11000061035156 |
| 2026-10-14 | Closing price | 39.90999984741211 |
| 2026-10-15 | Closing price | 38.689998626708984 |
| 2026-10-16 | Closing price | 38.20000076293945 |
| 2026-10-19 | Closing price | 37.61000061035156 |
| 2026-10-20 | Closing price | 38.0099983215332 |
| 2026-10-21 | Closing price | 39.349998474121094 |
| 2026-10-22 | Closing price | 38.529998779296875 |
| 2026-10-23 | Closing price | 39.88999938964844 |
| 2026-10-26 | Closing price | 41.06999969482422 |
| 2026-10-27 | Closing price | 40.369998931884766 |
| 2026-10-28 | Closing price | 41.709999084472656 |
| 2026-10-29 | Closing price | 43.04499816894531 |
| 2026-10-30 | Closing price | 42.689998626708984 |
| 2026-11-02 | Closing price | 39.81999969482422 |
| 2026-11-03 | Closing price | 40.2599983215332 |
| 2026-11-04 | Closing price | 37.63999938964844 |
| 2026-11-05 | Closing price | 34.310001373291016 |
| 2026-11-06 | Closing price | 34.38999938964844 |
| 2026-11-09 | Closing price | 34.540000915527344 |
| 2026-11-10 | Closing price | 34.290000915527344 |
A 12.9% dividend yield on trailing 12-month payouts remains the main argument for a holder
TORM's dividend yield over the last 12 months is 12.9% of the current price. This is a high figure that reflects both the generosity of payouts and the market's low valuation of the share.
Our estimate of the 2026 dividend is based on current profit and cash flow. With quarterly net profit of $199.1 million and operating flow of $264.5 million, the company has the means for payouts, but the final dividend size depends on the board's decision and distribution policy.
A yield of 12.9% significantly exceeds the risk-free rate, making the share attractive to income-oriented investors. However, the sustainability of payouts depends on maintaining high margins and cash flow in the coming quarters.
What could reduce the payout: revenue falling below $400 million per quarter, an EBITDA margin drop below 45%, or higher capital expenditure. At the current debt level of 0.65x EBITDA, the company can maintain the dividend even with a moderate deterioration in conditions.
EV/EBITDA of 4.1 is 7% below its own three-year average of 4.4 – the share is cheaper than its history
TORM's EV/EBITDA multiple over the last 12 months is 4.1. The three-year average is 4.4, meaning the current valuation is 7% below its own history.
A 7% discount is moderate, but it means the market values the company cheaper than on average over the last three years. With a 12.9% dividend yield and P/E LTM of 4.65, the share looks undervalued relative to its earnings.
For comparison: EV/EBITDA of 4.1 versus an average of 4.4 is not deep undervaluation but rather a small cushion. If profit stays at the current level, the multiple may remain low due to the cyclical nature of the industry.
Valuation on the latest reported figures
| Metric | Value |
|---|---|
| Market cap | 3.47 bn USD |
| P/E (LTM) | 4.7 |
| EV/EBITDA (LTM) | 4.1 |
| P/B | 1.58 |
| Net debt / EBITDA (LTM) | 0.65 |
| Operating cash flow (LTM) | 0.85 bn |
| ROE | 31.4% |
| Dividend yield (12m) | 12.9% |
| EV/EBITDA, 3-year average | 4.4 |
Bottom line
TORM delivered a strong quarter: revenue of $499.4 million, EBITDA of $259.7 million, net profit of $199.1 million. The EBITDA margin of 55.7% and net margin of 39.9% confirm high efficiency, while operating cash flow of $264.5 million covered capital expenditure almost fivefold. However, revenue growth slowed from 110.3% to 45.8%, and that is the main question for a holder. A 12.9% dividend yield and an EV/EBITDA multiple of 4.1 versus an average of 4.4 (a 7% discount) make the share rather attractive. Our conclusion: rather attractive – the 7% discount to its own history offers a moderate cushion, and the dividend remains the main support. Our view: the share is rather attractive at the current price; no portal model for this share; EV/EBITDA 4.1 against a 3-year average of 4.4, a 7% discount to its history.