Semen Indonesia: 9M profit up 4.6-fold, but a 1.9% margin leaves little room
Contents
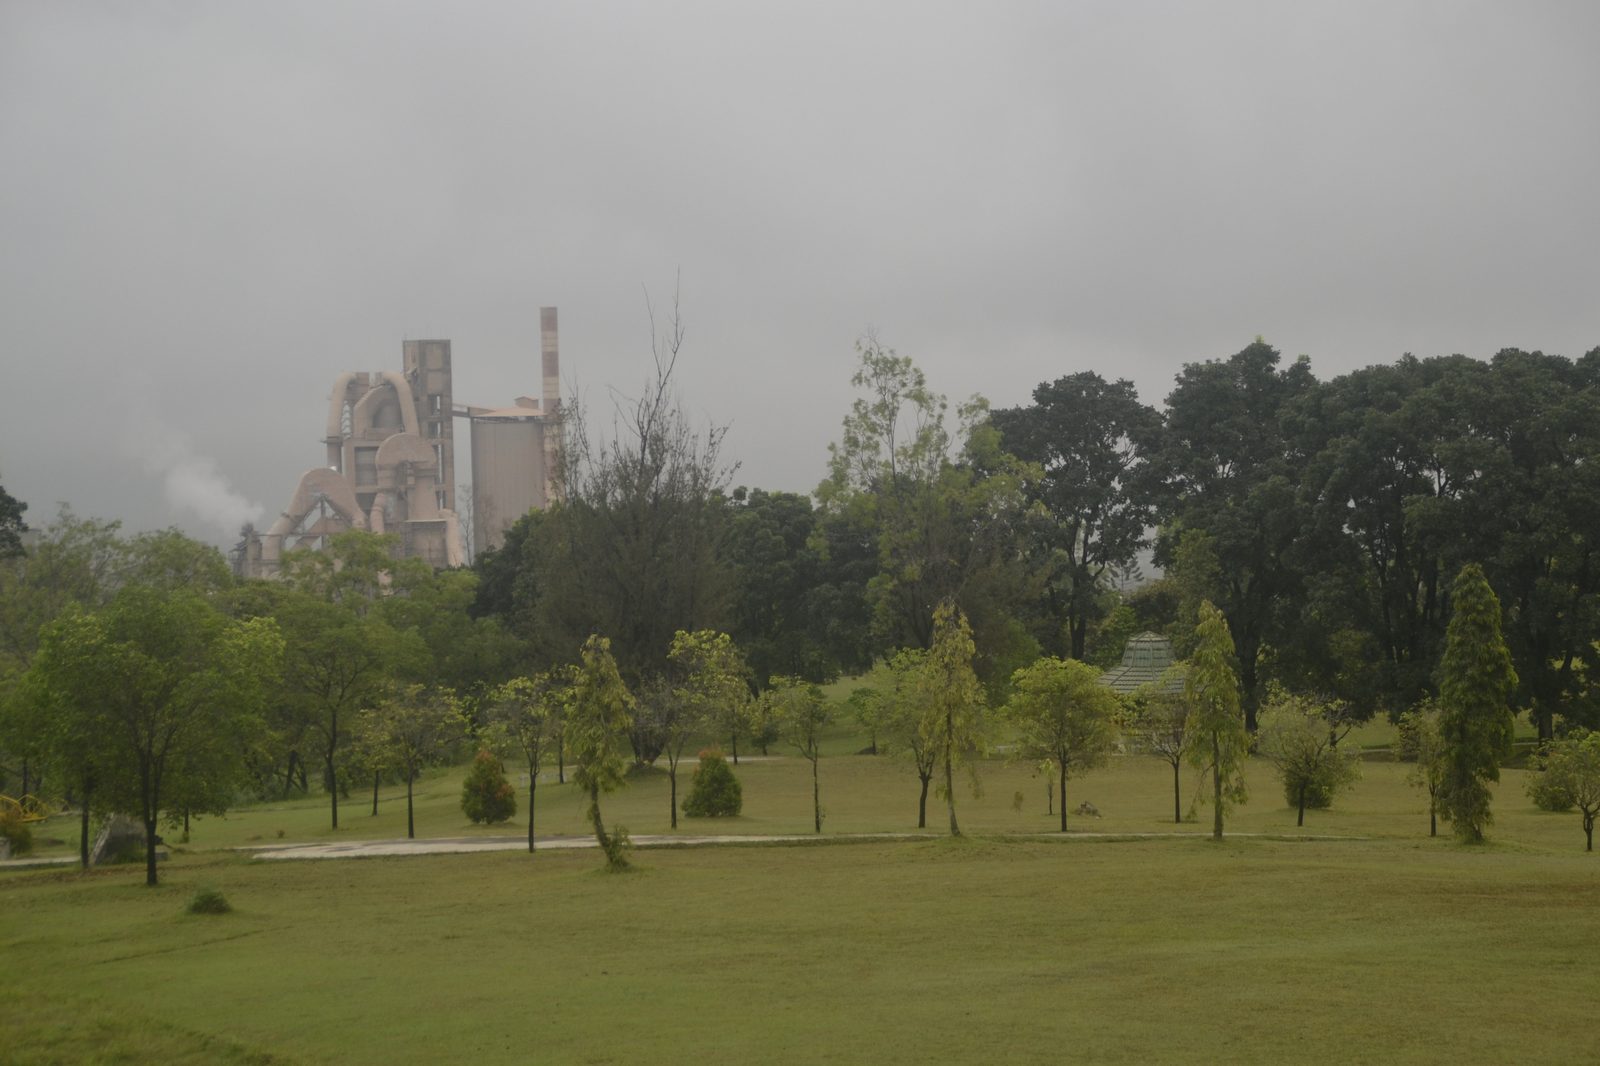
On 25 November Semen Indonesia reported results for 9M 2026. Revenue came in at IDR 27,668,401 mn (+9.3% YoY), net profit at IDR 531,841 mn (+363.1%), and operating cash flow at IDR 3,008,578 mn. Net margin remains low at 1.9% versus 0.5% a year earlier, while the balance sheet shows net cash of IDR 620,879 mn. Our conclusion: rather attractive – the portal's model puts the upside at +37%. Our view: the share is rather attractive at the current price; upside on the portal model +37%.
Our view: is there upside
Our view in numbers
| Metric | Our read |
|---|---|
| Verdict | Rather attractive |
| Upside on the portal model | +37% |
| How the model works | fundamental value-creation model: EBITDA growth times the target multiple, against market cap |
| EV/EBITDA now and 3-year average | 2.1 vs 4.5 – a 54% discount to its history |
| Dividend yield, 12m | 1.9% |
| Net debt / EBITDA | -0.09 – net cash |
| Strongest case for | EV/EBITDA of 2.1 versus its own 3-year average of 4.5 is a 54% discount, and the portal's model gives +37% upside. |
| Strongest case against | The 1.9% net margin remains low, and the 4.6-fold profit growth rests on a weak prior-year base. |
| What would change the view | A sustained margin above 2.5% in the next report would lift the verdict one step, while a revenue decline of more than 5% YoY would lower it one step. |
Key takeaways
— Revenue rose 9.3% in 9M, but a 1.9% margin shows growth is not yet turning into profit
— Net profit grew 4.6-fold, almost entirely on a low year-ago base
— Net cash of IDR 620,879 mn removes debt risk but does not help the margin
— Operating cash flow of IDR 3,008,578 mn covers profit, but capex could eat it
— EV/EBITDA of 2.1 is a 54% discount to its own 3-year average of 4.5
— A 1.9% dividend yield against a higher policy rate makes the dividend a secondary argument
Key figures, IDR bn
| Metric | 9M 2025 | 9M 2026 | Change |
|---|---|---|---|
| Revenue | 25 305 | 27 668 | +9.3% |
| EBITDA | 3 284 | — | — |
| Operating profit | 888 | — | — |
| Net profit | 115 | 532 | +363.1% |
| Operating cash flow | 1 790 | 3 009 | +68.1% |
| Capex | 580 | — | — |
| EBITDA margin | 13.0% | — | — |
| Net margin | 0.5% | 1.9% | +1.4 pp |
Revenue rose 9.3% in 9M, but a 1.9% margin shows growth is not yet turning into profit
Revenue for 9M 2026 was IDR 27,668,401 mn, up 9.3% year on year. This is a notable acceleration versus quarterly dynamics: in Q1 2026 revenue grew 8.3% YoY, while in Q1 2025 it fell 8.6%. However, revenue growth is not yet translating into profit.
Net margin for the period was 1.9% versus 0.5% a year earlier. The 1.4 percentage point improvement looks positive, but the absolute level remains low: every billion of revenue yields only IDR 19 mn of net profit. At such a margin, even a small cost change can swing profit significantly.
The main driver of revenue growth was sales volume rather than prices, but the report does not break this down by region. Without that, it is impossible to say which segment drove the result. For an investor, the key point is that revenue growth exists but is not matched by adequate profit growth.
Net profit grew 4.6-fold, almost entirely on a low year-ago base
Net profit for 9M 2026 was IDR 531,841 mn, 4.6 times the figure for the same period of 2025. This growth is explained by a low base: a year earlier profit was only IDR 114,800 mn, corresponding to a 0.5% margin. So the current result is a recovery, not organic growth.
LTM net profit (trailing twelve months) was IDR 596,443 mn. This is above the reported 9M profit, indicating that Q4 2025 profit was positive. However, LTM profit is still small relative to LTM revenue of IDR 37,607,500 mn – LTM margin is about 1.6%.
The 4.6-fold profit growth looks impressive, but it was achieved against a weak prior year. The sustainability of this growth will depend on whether the company can keep its margin above 1.9% in future periods. There is no separate Q3 data yet, which limits the assessment.
Net cash of IDR 620,879 mn removes debt risk but does not help the margin
As of 30 September 2026, the company has a net cash position of IDR 620,879 mn. This means cash and equivalents exceed debt obligations. Net debt / EBITDA LTM is -0.09 – a negative value confirming the net cash position.
Net debt dynamics: on 30 June 2026 it was IDR 2,930.0 bn, and on 30 September 2026 it was minus IDR 620.9 bn, a decrease of IDR 3,550.9 bn over the quarter. A year earlier, on 30 September 2025, net debt was IDR 5,256.9 bn, and over 12 months it fell by IDR 5,877.8 bn. This is a strong balance sheet improvement.
The absence of debt burden gives the company freedom for investment and dividends, but does not solve the low-margin problem. At a 1.9% margin, even without debt the company does not generate enough profit for high payouts. Net cash is a cushion, not a growth driver.
Operating cash flow of IDR 3,008,578 mn covers profit, but capex could eat it
Operating cash flow for 9M 2026 was IDR 3,008,578 mn, significantly exceeding net profit of IDR 531,841 mn. This is a good sign: the company generates real cash, not just accounting profit. The cash flow to profit ratio is 5.7x, indicating high earnings quality.
However, capital expenditure could substantially reduce free cash flow. The facts do not provide 9M 2026 capex, but in Q1 2026 capex was IDR 187,307 mn. Extrapolating this level to the full year gives capex of about IDR 750 bn, which still leaves free cash flow positive.
LTM operating cash flow was IDR 4,943,726 mn. This is a solid amount that covers both capex and potential dividends. But with a low margin, the main risk is that cash flow could shrink if market conditions deteriorate. For now, cash flow is one of the main arguments in the company's favour.
Valuation vs its own history
now vs the 3-year average
| Period | Measure | × |
|---|---|---|
| EV/EBITDA | Now | 2.0777842677663436 |
| EV/EBITDA | 3-year average | 4.479213063004177 |
EV/EBITDA of 2.1 is a 54% discount to its own 3-year average of 4.5
The EV/EBITDA LTM multiple is 2.1, which is 54% below its own 3-year average of 4.5. This means the stock trades significantly cheaper than its average over the past three years. Such a discount may be justified by the low margin and uncertainty, but it creates potential for re-rating.
P/E LTM is 16.9, which does not look cheap for a company with a 1.9% margin. However, P/E may be distorted by the low profit base. EV/EBITDA is more indicative as it accounts for debt, which is currently absent (net cash position).
According to the portal's model, which values value creation through EBITDA growth and a target multiple, the upside to fair value is +37%. This is our own estimate, not market consensus. It rests on the current EV/EBITDA undervaluation and expected profit recovery.
A 1.9% dividend yield against a higher policy rate makes the dividend a secondary argument
The trailing 12-month dividend yield is 1.9%. This is a modest level, especially considering that the policy rate in Indonesia is likely higher. The facts do not give the policy rate, but for emerging markets a yield below the rate is typical.
The company paid dividends for 2025, but the exact amount is not in the facts. Our estimate: with LTM profit of IDR 596,443 mn and a payout ratio of about 30%, the dividend could be around IDR 179 bn, which at a market cap of IDR 10,069,638 mn gives a yield of about 1.8%. This is close to the current 1.9% yield.
The dividend is not the main argument for the stock. The main driver is the EV/EBITDA undervaluation and the potential for profit recovery. If profit grows, the dividend could increase, but for now a 1.9% yield does not compensate for the low-margin risks.
Valuation on the latest reported figures
| Metric | Value |
|---|---|
| Market cap | 10 070 bn IDR |
| P/E (LTM) | 16.9 |
| EV/EBITDA (LTM) | 2.1 |
| P/B | 0.23 |
| Net debt / EBITDA (LTM) | -0.09 |
| Operating cash flow (LTM) | 4 944 bn |
| ROE | 1.6% |
| Dividend yield (12m) | 1.9% |
| EV/EBITDA, 3-year average | 4.5 |
Bottom line
The strong side of the report is the 4.6-fold profit recovery and net cash of IDR 620,879 mn. However, profit growth is largely due to the low prior-year base, and the 1.9% margin remains fragile. Operating cash flow of IDR 3,008,578 mn covers profit, but capex could reduce it. The key question for a holder is whether the company can keep its margin above 1.9% and realise the upside embedded in the valuation. Our conclusion: rather attractive – the portal's model puts the upside at +37%. Our view: the share is rather attractive at the current price; upside on the portal model +37%.