ITC: revenue up 3.2% but profit down 18.7% as margin compresses
ITC's Q3 2026 results showed revenue up 3.2% year-on-year to INR 201.2 bn, but net profit fell 18.7% to INR 41.7 bn and EBITDA declined 6.9% to INR 56.4 bn. EBITDA margin contracted from 34.3% to 30.9%, and net margin from 26.3% to 20.7%. At the current price the shares look neutral: the discount to the company's own EV/EBITDA history is offset by margin deterioration and falling profit.
Key takeaways
— Q3 2026 revenue rose 3.2% year-on-year to INR 201.2 bn, but this is slower than the previous quarter's 3.2% growth – an acceleration relative to Q1 2026's 11.1% decline
— EBITDA fell 6.9% year-on-year to INR 56.4 bn, with margin down from 34.3% to 30.9% – cost pressure intensified
— Net profit declined 18.7% year-on-year to INR 41.7 bn, with net margin down from 26.3% to 20.7%
— Leverage remains low: net debt at 30 September 2026 was minus INR 5.9 bn, and net debt/EBITDA for the trailing twelve months was minus 0.02
— Trailing twelve-month dividend yield is 5.1%, above many instruments, but payouts depend on profit, which is falling
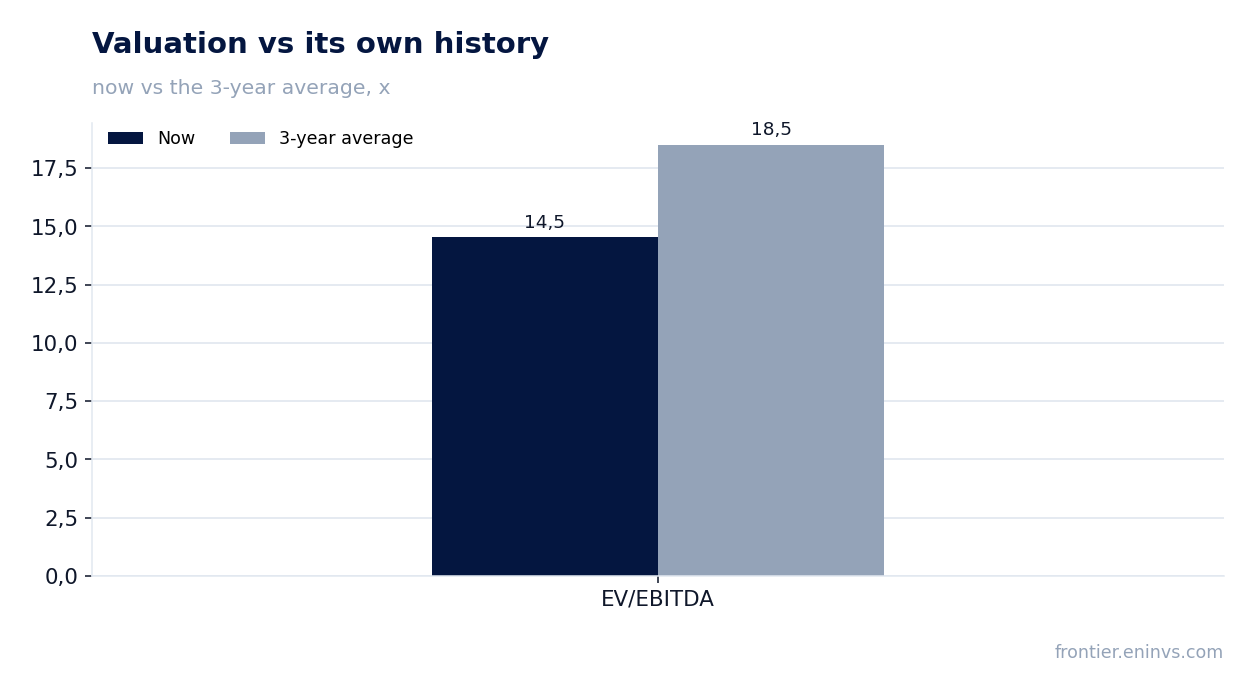
— EV/EBITDA for the last twelve months is 14.5, 21% below its own three-year average of 18.5 – the stock is cheaper than its history
— On the portal's model, upside to fair value is minus 20% – the stock trades above our fundamental estimate
Attractiveness
Key figures, INR bn
| Metric | Q3 2025 | Q3 2026 | Change |
|---|---|---|---|
| Revenue | 195 | 201 | +3.2% |
| EBITDA | 66.8 | 62.2 | -6.9% |
| Operating profit | 62.6 | 51.5 | -17.7% |
| Net profit | 51.3 | 41.7 | -18.7% |
| EBITDA margin | 34.3% | 30.9% | -3.4 pp |
| Net margin | 26.3% | 20.7% | -5.6 pp |
Q3 2026 revenue rose 3.2% year-on-year to INR 201.2 bn, but this is slower than the previous quarter's 3.2% growth – an acceleration relative to Q1 2026's 11.1% decline
ITC's Q3 2026 revenue was INR 201.2 bn, up 3.2% year-on-year. This continues the recovery from a weak Q1 2026, when revenue fell 11.1% year-on-year. Growth turned positive in Q2 2026 at 3.2% and held at that level in Q3.
The quarterly sales trend shows the company has overcome the early-year slump. However, growth remains moderate: the sequential increase from quarter to quarter is small. The main contribution likely came from key segments, but without a breakdown by division in the report we cannot name a specific driver.
For an investor, the quality of growth matters more than the fact of it. Revenue growth of 3.2% alongside falling EBITDA and profit suggests that additional sales are not generating proportional returns. This could be due to a shift in revenue mix or to cost increases not visible in the report.
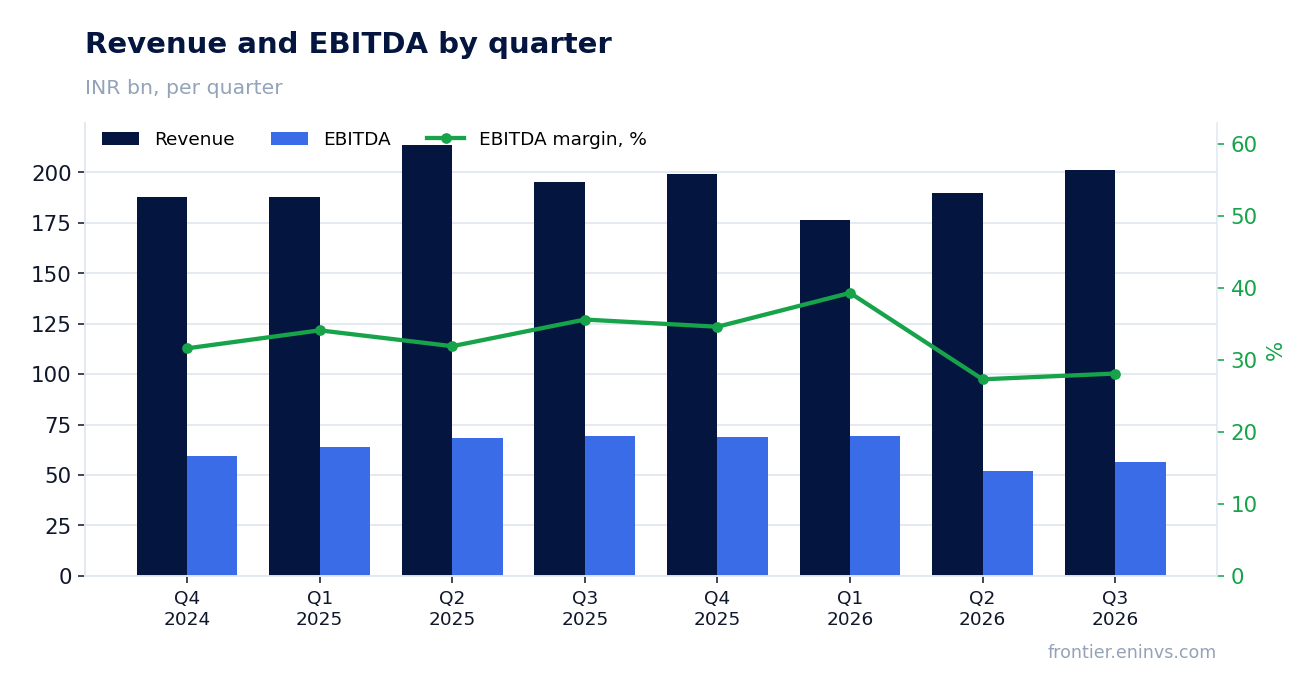
EBITDA fell 6.9% year-on-year to INR 56.4 bn, with margin down from 34.3% to 30.9% – cost pressure intensified
Q3 2026 EBITDA was INR 56.4 bn, down 6.9% year-on-year. The EBITDA margin contracted by 3.4 percentage points, from 34.3% to 30.9%. This means revenue growth was not accompanied by improved operating efficiency.
The margin decline could stem from several factors: higher raw material costs, increased personnel expenses, or a shift in sales mix toward lower-margin products. The report does not provide a cost breakdown, so we can only note the fact of margin compression without naming a specific cause.
Operating profit also fell, to INR 51.5 bn, down 17.7% year-on-year. This decline is deeper than the EBITDA drop, pointing to higher depreciation or other operating expenses. In any case, cost pressure has intensified, and this is the main negative of the report.
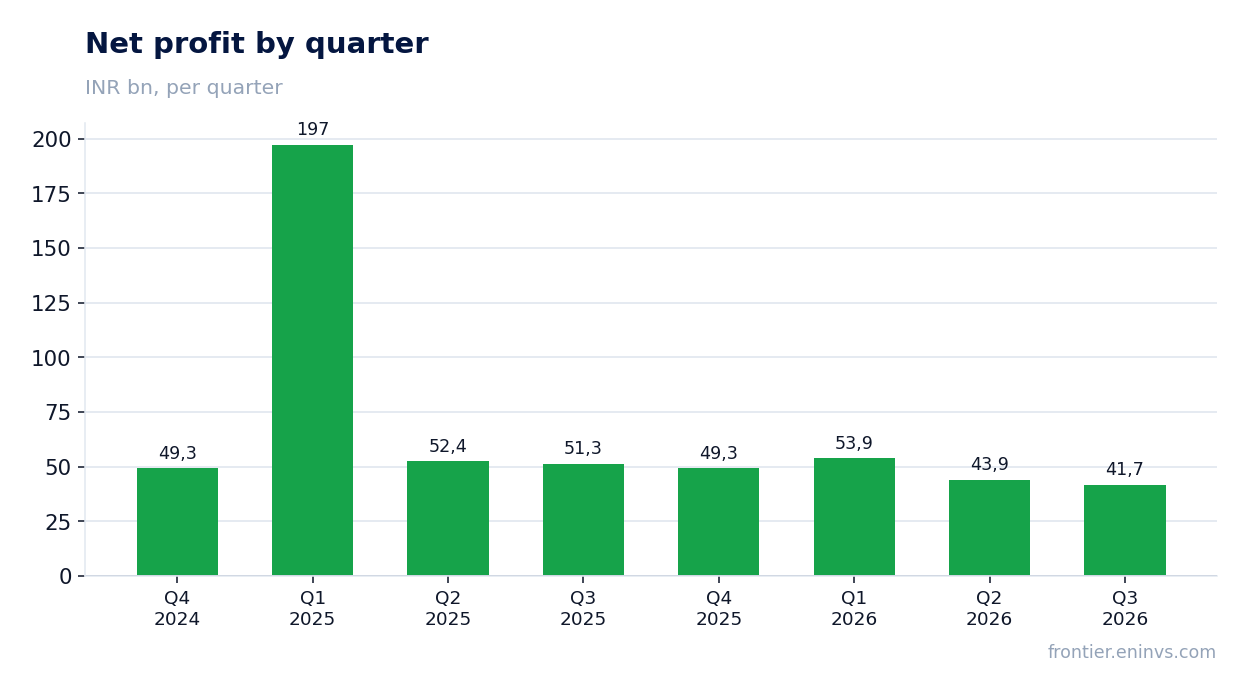
Net profit declined 18.7% year-on-year to INR 41.7 bn, with net margin down from 26.3% to 20.7%
Q3 2026 net profit was INR 41.7 bn, down 18.7% year-on-year. Net margin fell from 26.3% to 20.7%, a decline of 5.6 percentage points. This is a much sharper drop than the EBITDA decline, indicating factors below the operating line.
One such factor could be higher interest expenses or lower other income. However, the provided data does not include information on interest expenses or one-off items, so we cannot pinpoint what exactly caused such a strong fall in net profit.
It is important to note that trailing twelve-month (LTM) profit was INR 188.8 bn, but this does not offset the negative dynamics in the reporting quarter. The 18.7% profit decline is a serious signal for investors, especially against the backdrop of revenue growth.
Leverage remains low: net debt at 30 September 2026 was minus INR 5.9 bn, and net debt/EBITDA for the trailing twelve months was minus 0.02
ITC's net debt at 30 September 2026 was minus INR 5.9 bn, meaning the company has a positive cash position. Over the six months since 31 March 2026, net debt changed from INR 15.4 bn to minus INR 5.9 bn, a decrease of INR 21.3 bn. This means the company directed significant funds to debt repayment or accumulated cash.
The net debt/EBITDA ratio for the trailing twelve months is minus 0.02, confirming the absence of debt burden. Such a level is typical for companies with a strong balance sheet and stable cash flow.
Low leverage gives the company flexibility for investment or dividend payments, but it does not offset the weak operating results of the quarter. For an investor, it is important that the financial position remains sound even as profit declines.
Trailing twelve-month dividend yield is 5.1%, above many instruments, but payouts depend on profit, which is falling
ITC's trailing twelve-month dividend yield is 5.1%. This is an attractive level for income-oriented investors. However, dividend sustainability depends on profit, which fell 18.7% year-on-year in Q3 2026.
The company has not disclosed the dividend for 2026, but if current profit and the payout ratio hold, the dividend could be lower than in previous periods. Our estimate for the current year's dividend will depend on final profit and the board's decision.
A yield of 5.1% looks competitive, but investors should consider the risk of a payout cut if profit continues to decline. At the same time, low leverage and positive cash flow allow the company to maintain dividends even with a temporary profit decline.
EV/EBITDA for the last twelve months is 14.5, 21% below its own three-year average of 18.5 – the stock is cheaper than its history
The EV/EBITDA multiple for the last twelve months is 14.5, 21% below its own three-year average of 18.5. This means the stock trades cheaper than usual relative to its history. However, a lower multiple may reflect not only undervaluation but also deteriorating fundamentals.
The decline in profit and margin in Q3 2026 could lead to further downward revisions in investor expectations. If profit continues to fall, the current multiple may not look so low. Importantly, the discount to history comes amid worsening operating results.
For comparison, the P/E for the last twelve months is 18.8, which may also indicate a moderate valuation. But without a historical comparison for P/E, we cannot judge its level. The main argument for cheapness is EV/EBITDA below its average.
On the portal's model, upside to fair value is minus 20% – the stock trades above our fundamental estimate
According to our fundamental model, ITC's fair value is 20% below the current market price. This means that despite the discount to the historical multiple, our model indicates overvaluation. The model incorporates EBITDA growth and a target multiple, and current metrics do not justify the market price.
The minus 20% upside is a significant argument against buying the stock at the current level. However, the model may not account for balance sheet quality and dividend yield, which support the stock. Nevertheless, the fundamental valuation signals downside risk.
Investors should weigh this signal against the 5.1% dividend yield and low leverage. If profit recovers, the model may revise its estimate, but for now it points to no margin of safety.
Valuation on the latest reported figures
| Metric | Value |
|---|---|
| Market cap | 3 548 bn INR |
| P/E (LTM) | 18.8 |
| EV/EBITDA (LTM) | 14.5 |
| P/B | 4.89 |
| Net debt / EBITDA (LTM) | -0.02 |
| ROE | 23.1% |
| Dividend yield (12m) | 5.1% |
| EV/EBITDA, 3-year average | 18.5 |
Bottom line
ITC's Q3 2026 report presented a mixed picture: revenue grew 3.2%, but profit fell 18.7% and margin compressed. The strengths remain low leverage and a 5.1% dividend yield, but weak operating results and overvaluation on the portal's model (minus 20%) outweigh them. The stock trades cheaper than its history on EV/EBITDA, but this does not offset deteriorating fundamentals. The verdict is neutral: the arguments for and against roughly balance out.
Open the company's financial profile ITC →
See also: market overview · valuation map · stock screeners