United Medical Group: revenue up 40%, but profit down – the cost of expansion
On August 25, United Medical Group released its results for the first half of 2026: revenue grew 40.4% year-on-year, EBITDA rose 24.6%, but net profit fell 17.3%. In this review, we examine what lies behind this divergence and how it affects the company's valuation.
Key takeaways
— Revenue for the half-year grew 40.4% to RUB 32.2 billion, but EBITDA margin fell from 41.0% to 36.4%
— Net profit fell 17.3% due to rising costs and, likely, one-off factors
— Debt burden stands at 0.83 EBITDA for the last 12 months – a moderate level
— Free cash flow for the half-year is not disclosed, but operating cash flow for 12 months is RUB 12.8 billion
— Capex and dividends: payments over the year – RUB 0.0 per share, model expects continued zero dividends
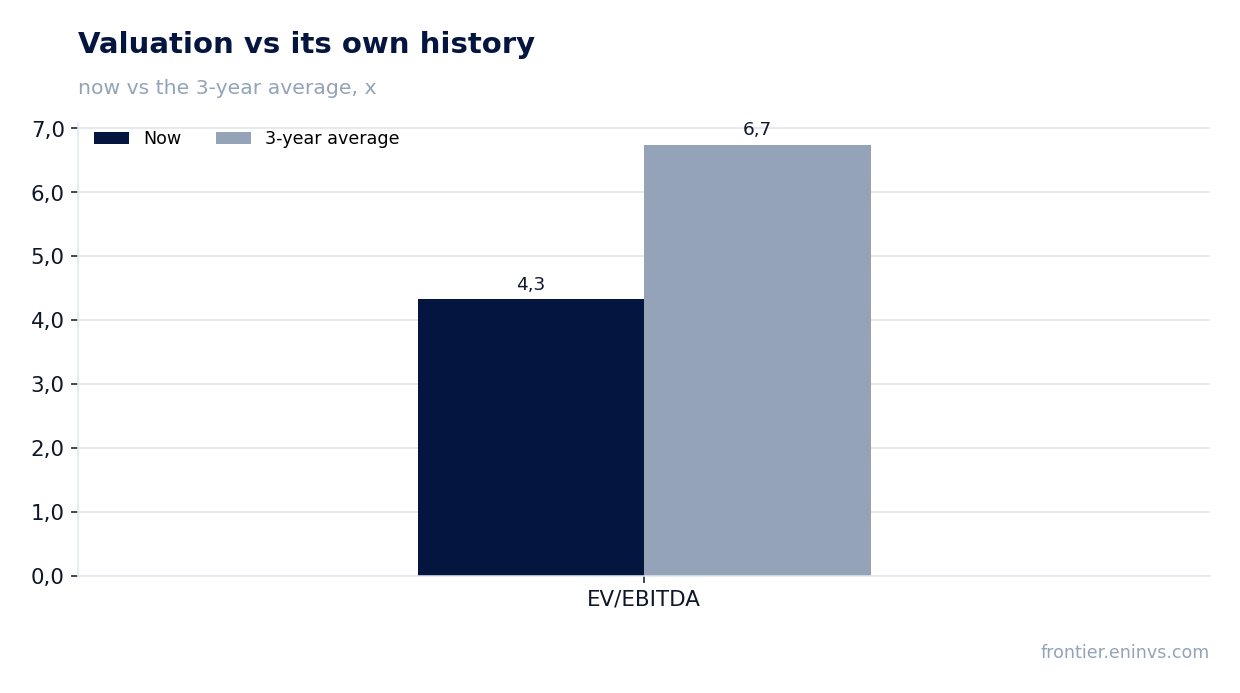
— Valuation: EV/EBITDA for 12 months – 4.3, below the 3-year average (6.7)
— Return on equity – 48.2% – is high, but needs to be tested for sustainability
Key figures, RUB bn
| Metric | H1 2025 | H1 2026 | Change |
|---|---|---|---|
| Revenue | 12.6 | 17.7 | +40.4% |
| EBITDA | 5.16 | 6.43 | +24.6% |
| Operating profit | 4.32 | 4.55 | +5.5% |
| Net profit | 5.33 | 4.41 | -17.3% |
| Operating cash flow | 6.65 | 6.81 | +2.3% |
| EBITDA margin | 41.0% | 36.4% | -4.6 pp |
| Net margin | 42.3% | 24.9% | -17.4 pp |
Revenue for the half-year grew 40.4% to RUB 32.2 billion, but EBITDA margin fell from 41.0% to 36.4%
For the first half of 2026, United Medical Group's revenue reached RUB 32.2 billion, up 40.4% year-on-year. This is strong growth, likely driven by network expansion and higher patient numbers.
However, EBITDA margin declined: the half-year margin was 36.4% versus 41.0% in H1 2025. EBITDA grew 24.6%, but slower than revenue, indicating rising operating costs – possibly for staff, rent, or supplies.
The margin decline is a key signal: the company is growing, but efficiency is falling. If the trend continues, it will pressure profits in the coming periods.
Net profit fell 17.3% due to rising costs and, likely, one-off factors
Net profit for H1 2026 was RUB 5,285 million for the last 12 months, but for the reported period it fell 17.3% year-on-year. This is a sharp contrast with revenue and EBITDA growth.
The profit decline amid growing EBITDA means non-operating costs rose – possibly interest on debt, taxes, or one-off write-offs. Net margin fell from 42.3% to 24.9% – almost halved.
Such a margin drop needs explanation in the next report: if it is one-off, profit may recover; if not, the business has become structurally less profitable.
Debt burden stands at 0.83 EBITDA for the last 12 months – a moderate level
At the latest reporting date, net debt stood at RUB 12,557 million, or 0.83 of EBITDA for the last 12 months. This is a moderate level, posing no critical risks to debt service.
Over the last 12 months, net debt increased by RUB 11.6 billion, although it decreased by RUB 12.5 billion in the previous reporting period. This dynamic indicates active use of borrowed financing, possibly for expansion investments.
With EBITDA for 12 months at RUB 15,206 million, the company generates sufficient funds to service debt, but the growth in debt requires monitoring.
Free cash flow for the half-year is not disclosed, but operating cash flow for 12 months is RUB 12.8 billion
Operating cash flow for the last 12 months was RUB 12,800 million – a solid figure, exceeding EBITDA (RUB 15,206 million) by 84%. This means profit converts well into cash.
However, free cash flow for the half-year is not disclosed, so it is impossible to assess how much remains after capital expenditures. Judging by debt growth, investments are significant.
For shareholders, it is important to see in the next report how much the company spends on capex and whether operating cash flow covers these expenses.
Capex and dividends: payments over the year – RUB 0.0 per share, model expects continued zero dividends
Over the last 12 months, the company paid no dividends – RUB 0.0 per share. Our model estimates the next payment also at RUB 0.0, indicating a continued no-payout policy.
Meanwhile, the fair yield for this stock, in our view, is 12.0%, and the implied payout ratio is 0.68 of profit. That is, there is potential for dividends, but the company prefers to reinvest funds.
For income-seeking investors, this is a negative: business growth is not accompanied by payouts.
Valuation: EV/EBITDA for 12 months – 4.3, below the 3-year average (6.7)
The current EV/EBITDA multiple for the last 12 months is 4.3, notably below the three-year average (6.7). The stock trades at a discount to its own history.
P/E for 12 months is 10.1, which also looks moderate. Market capitalization is RUB 53,244 million.
The discount may reflect market concerns about declining margins and rising debt. If the company shows margin recovery, valuation could move upward.
Return on equity – 48.2% – is high, but needs to be tested for sustainability
ROE for the last 12 months is 48.2% – an exceptionally high figure, indicating strong profit generation on invested capital.
However, with net profit falling and debt rising, such an ROE level may be unsustainable. If profit continues to decline, ROE will fall.
It is worth monitoring this indicator over time: consistently high ROE confirms business quality, while a decline signals problems.
Valuation on the latest reported figures
| Metric | Value |
|---|---|
| Market cap | 53.2 bn ₽ |
| P/E (LTM) | 10.1 |
| EV/EBITDA (LTM) | 4.3 |
| P/B | 1.47 |
| Net debt / EBITDA (LTM) | 0.83 |
| Operating cash flow (LTM) | 12.8 bn |
| ROE | 48.2% |
| EV/EBITDA, 3-year average | 6.7 |
Bottom line
United Medical Group shows strong revenue growth – 40.4% for the half-year, confirming the demand for its services. However, the decline in EBITDA margin from 41.0% to 36.4% and the fall in net profit by 17.3% are worrying signals: growth is achieved at the cost of efficiency. Debt burden remains moderate (0.83 EBITDA), but debt growth requires attention. The stock's valuation is below its own history (EV/EBITDA 4.3 vs 6.7), which may be justified if margins do not recover. The key question for holders is whether the company can restore profitability without losing growth momentum.
Open the company's financial profile GEMC →
See also: market overview · valuation map · stock screeners