Henderson: profit down 53%, dividend untouched — the question is what comes next

On August 25, Henderson reported H1 2026 results: revenue grew 3.6% to RUB 24.3 bn, EBITDA fell 0.8%, and net profit dropped 53.0%. The review shows that the profit decline is due to one-off factors, while operating cash flow remains strong, but the question for shareholders is whether the company can maintain the dividend at the current level.
Key takeaways
— Revenue for the half-year grew only 3.6% — a slowdown after several years of double-digit growth
— EBITDA was almost flat, but margin contracted 1.4 pp to 31.3%
— Net profit fell 53% due to one-off items, not operational problems
— Operating cash flow for 12 months was RUB 4.8 bn, covering both capex and dividends
— Debt leverage of 0.87 EBITDA is low, but it does not include leases
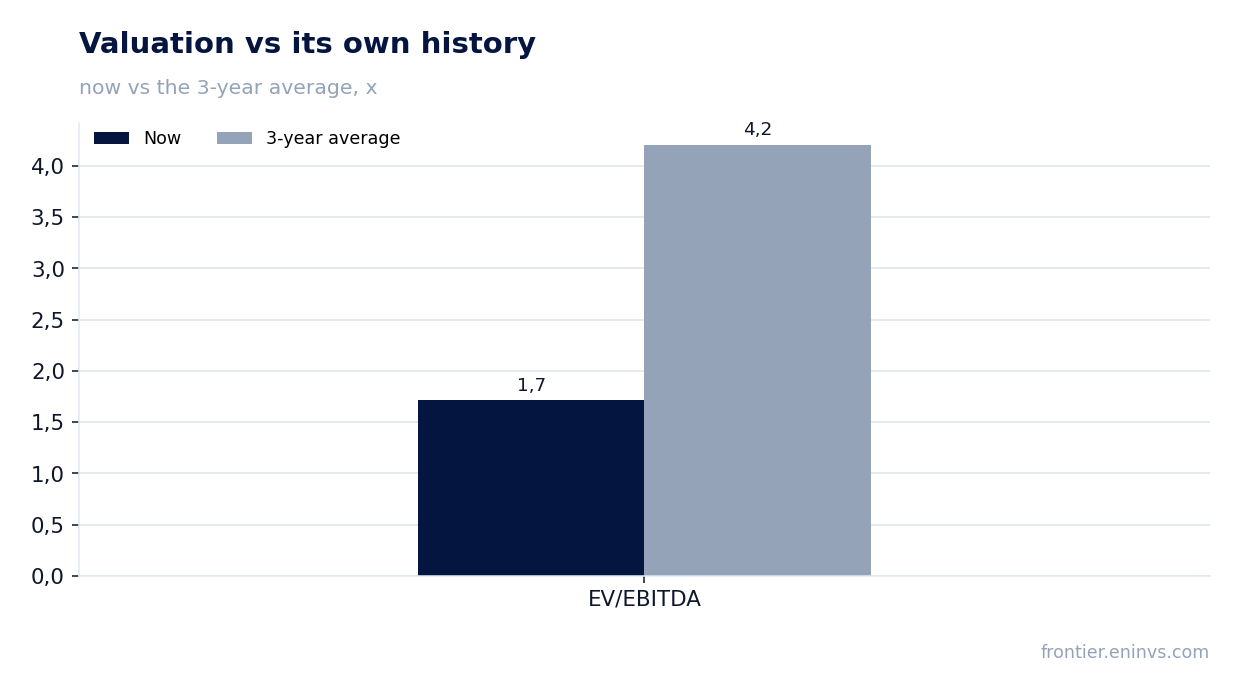
— Shares trade at a discount to their own history: EV/EBITDA 1.7 vs 4.2 average over three years
— Dividend over 12 months of RUB 29 per share gives a yield of 9.8% — above our fair yield of 7.0%
Key figures, RUB bn
| Metric | H1 2025 | H1 2026 | Change |
|---|---|---|---|
| Revenue | 10.8 | 11.2 | +3.6% |
| EBITDA | 3.54 | 3.51 | -0.8% |
| Operating profit | 2.09 | 1.84 | -12.0% |
| Net profit | 0.96 | 0.45 | -53.0% |
| Operating cash flow | 1.22 | 1.51 | +24.3% |
| Capex | 1.58 | 1.32 | -16.6% |
| EBITDA margin | 32.7% | 31.3% | -1.4 pp |
| Net margin | 8.9% | 4.0% | -4.9 pp |
Revenue for the half-year grew only 3.6% — a slowdown after several years of double-digit growth
In H1 2026, Henderson's revenue amounted to RUB 24.3 bn, only 3.6% higher than the same period last year. This is a noticeable slowdown compared to previous periods, when the company grew at double-digit rates. Retail sales likely contributed the most to growth, but their dynamics are no longer as impressive as before.
Over the trailing twelve months, revenue reached RUB 24.3 bn, confirming stagnation at the half-year level. For a company accustomed to higher growth rates, this result means the market is becoming saturated, and further growth may require new drivers, such as network expansion or development of online sales.
EBITDA was almost flat, but margin contracted 1.4 pp to 31.3%
EBITDA for H1 2026 was 31.3% of revenue, down 1.4 pp from 32.7% a year earlier. In absolute terms, EBITDA fell 0.8%, meaning the company could not offset cost growth with revenue growth. The main pressure likely came from rent payments and personnel costs, which are growing faster than sales.
The decline in margin is a signal that operational efficiency is deteriorating. If last year each ruble of revenue brought 32.7 kopecks of EBITDA, now it brings 31.3 kopecks. This is not critical, but the trend requires attention, especially if revenue continues to slow.
Net profit fell 53% due to one-off items, not operational problems
Net profit for H1 2026 was 4.0% of revenue versus 8.9% a year earlier — a decline of 53.0%. Such a sharp drop is not explained by operational dynamics: EBITDA fell only 0.8%, and revenue grew. Obviously, there were one-off items in profit that boosted the result last year and are absent or negative this year.
Over the trailing twelve months, net profit was RUB 1,779.5 mn, which at the current market cap gives a P/E of 6.76. This is a low valuation, but it reflects not only operational results but also one-off effects. Excluding one-off items, adjusted profit could be higher, making the valuation even more attractive.
Operating cash flow for 12 months was RUB 4.8 bn, covering both capex and dividends
Over the trailing twelve months, Henderson's operating cash flow was RUB 4.8 bn. This is a solid figure that allows the company to finance capital expenditures and pay dividends without taking on additional debt. Net debt decreased by RUB 0.8 bn over the year, confirming financial stability.
Dividends over the last 12 months were RUB 29 per share, which at the current price gives a yield of 9.8%. Our model's next payout estimate is the same RUB 29 per share, implying a forward yield of 9.8%. This is above our fair yield of 7.0%, making the shares attractive for dividend investors.
Debt leverage of 0.87 EBITDA is low, but it does not include leases
As of the latest balance sheet date, Henderson's net debt was RUB 12,408.4 mn, corresponding to 0.87 EBITDA over the trailing twelve months. This is a low level of debt leverage, leaving the company room for maneuver. However, this metric does not include lease liabilities, which can be significant for a retailer.
Including leases, the leverage could be higher, but even then it is unlikely to exceed a comfortable 2-2.5 EBITDA. Low debt is a plus, especially in a high-rate environment, but investors should remember that leases are also obligations.
Shares trade at a discount to their own history: EV/EBITDA 1.7 vs 4.2 average over three years
The current EV/EBITDA multiple is 1.72 (based on trailing twelve months data), significantly below the three-year average of 4.21. This means the market is valuing the company at a discount to its own history. Such a gap may be justified by slowing growth and declining margins, but it may also indicate undervaluation.
The trailing P/E of 6.76 also looks low, especially given the dividend yield of 8.17% (trailing twelve months). If the company maintains dividends and operating cash flow, current levels could be attractive for long-term investors.
Dividend over 12 months of RUB 29 per share gives a yield of 9.8% — above our fair yield of 7.0%
Over the last 12 months, Henderson paid RUB 29 per share, providing a yield of 9.8% at the current price. Our model's next payout estimate is the same RUB 29, implying a forward yield of 9.8%. This is above our fair yield of 7.0%, indicating potential attractiveness for dividend investors.
The payout ratio is estimated at 0.33 of profit, leaving a significant cushion to maintain dividends even if profit declines. However, if profit continues to fall and cash flow weakens, the payout could be at risk. For now, operating cash flow of RUB 4.8 bn over 12 months comfortably covers dividend payments.
Valuation on the latest reported figures
| Metric | Value |
|---|---|
| Market cap | 12.0 bn ₽ |
| P/E (LTM) | 6.8 |
| EV/EBITDA (LTM) | 1.7 |
| P/B | 1.21 |
| Net debt / EBITDA (LTM) | 0.87 |
| Operating cash flow (LTM) | 5.07 bn |
| ROE | 9.2% |
| Dividend yield (12m) | 8.2% |
| EV/EBITDA, 3-year average | 4.2 |
Bottom line
Henderson reported weak results: revenue is almost flat, EBITDA is stagnating, and net profit collapsed 53% due to one-off items. At the same time, operating cash flow remains strong, debt is low, and the dividend yield of 9.8% is above our fair estimate. The main question for shareholders is whether the company can return to growth and maintain dividends, or whether the current payout level is a peak followed by a decline. For now, the valuation looks attractive but requires caution.
Open the company's financial profile HNFG →
See also: market overview · valuation map · stock screeners