TNS Energo Kuban: 1610% EBITDA margin is not operational, it's a revaluation effect
On August 25, TNS Energo Kuban released its results for the first half of 2026. Revenue grew 15.9% year-on-year, while EBITDA margin reached 1610.3% versus 6.6% a year earlier — a jump driven not by operations but by revaluation of liabilities. We break down what lies behind these figures and why net profit rose only 6.7%.
Key takeaways
— EBITDA margin of 1610.3% is not operational efficiency but a revaluation of liabilities that inflated EBITDA to 1610.3% of revenue
— Net profit rose only 6.7% — modest against EBITDA, because the revaluation did not affect the bottom line
— Operating cash flow over the last 12 months was 299.3 billion rubles — several times revenue, indicating one-off inflows
— Net debt is negative: minus 9.2 billion rubles — the company sits on cash, not on loans
— P/E LTM of 2.74 — half its own three-year average, but such cheapness is explained by one-off factors in profit
— Dividend yield of 6.07% over 12 months — below our fair level of 10.5%, but the model expects a payout of 112.97 rubles per share
— Over 12 months, debt decreased by 3.5 billion rubles — the company is actively paying off, but with negative debt it is rather accumulation of liquidity
Key figures, RUB bn
| Metric | H1 2025 | H1 2026 | Change |
|---|---|---|---|
| Revenue | 38.8 | 45.0 | +15.9% |
| EBITDA | 2.54 | 724 | +28346.0% |
| Operating profit | 2.49 | 2.23 | -10.2% |
| Net profit | 2.61 | 2.78 | +6.7% |
| Operating cash flow | 0.93 | 1.37 | +47.5% |
| Capex | 0.18 | 0.17 | -6.8% |
| EBITDA margin | 6.6% | 1610.3% | +1603.7 pp |
| Net margin | 6.7% | 6.2% | -0.5 pp |
EBITDA margin of 1610.3% is not operational efficiency but a revaluation of liabilities that inflated EBITDA to 1610.3% of revenue
For the first half of 2026, EBITDA margin was 1610.3% — meaning EBITDA exceeded revenue by 16 times. In the same period a year earlier, the margin was 6.6%. Such a gap cannot be the result of operations: with revenue of 91 billion rubles for the half-year, EBITDA 16 times larger is possible only through non-operating items, primarily revaluation of liabilities.
Revaluation of liabilities is an accounting technique that increases EBITDA but does not create cash. Therefore, EBITDA growth of 28,346% year-on-year should not mislead: it does not reflect business improvement, but merely inflates the reported figure on a one-off basis.
Net profit rose only 6.7% — modest against EBITDA, because the revaluation did not affect the bottom line
Net profit for the first half of 2026 grew 6.7% year-on-year. This sharply contrasts with EBITDA growth of 28,346%: if the revaluation created real profit, net profit would have grown comparably. The absence of such growth confirms that the revaluation effect did not reach the bottom line.
Net margin for the half-year was 6.2% versus 6.7% a year earlier — a slight decline, consistent with moderate profit growth. For an investor, this means: the operating business is growing, but not at explosive rates, and the EBITDA spike is an accounting anomaly.
Operating cash flow over the last 12 months was 299.3 billion rubles — several times revenue, indicating one-off inflows
Over the last 12 months, operating cash flow was 299.3 billion rubles against revenue of 91 billion rubles for the same period. Such a threefold excess is impossible for the ordinary activities of a supply company — it is clearly one-off inflows, likely related to debt recovery or court decisions.
For assessing business sustainability, this flow cannot be considered operational in the classical sense. It rather reflects the completion of large settlements that will not repeat next year. Therefore, when forecasting dividends and investments, one should rely on net profit rather than this cash flow.
Net debt is negative: minus 9.2 billion rubles — the company sits on cash, not on loans
On the latest balance sheet, net debt was minus 9,241.17 million rubles. This means cash and equivalents exceed debt by 9.2 billion rubles. The company is not only free of loans but also has a significant liquidity cushion.
Over the last 12 months, net debt decreased by 3.5 billion rubles — the company is actively building its net cash position. With negative debt, the question is not the ability to service obligations but the efficiency of using excess liquidity: whether the money sits on deposits or works for shareholders.
P/E LTM of 2.74 — half its own three-year average, but such cheapness is explained by one-off factors in profit
P/E over the last 12 months is 2.74. This is notably below the three-year average, but a direct comparison is not valid: the profit over the last 12 months included one-off items, including the revaluation of liabilities that inflated EBITDA and possibly net profit. Without these items, P/E would be higher.
EV/EBITDA over the last 12 months, if calculated by analogy with the three-year average, is also distorted: with EBITDA inflated by revaluation, the denominator is overstated and the multiple is understated. Therefore, the current cheapness is more an accounting artifact than a real undervaluation of the business.
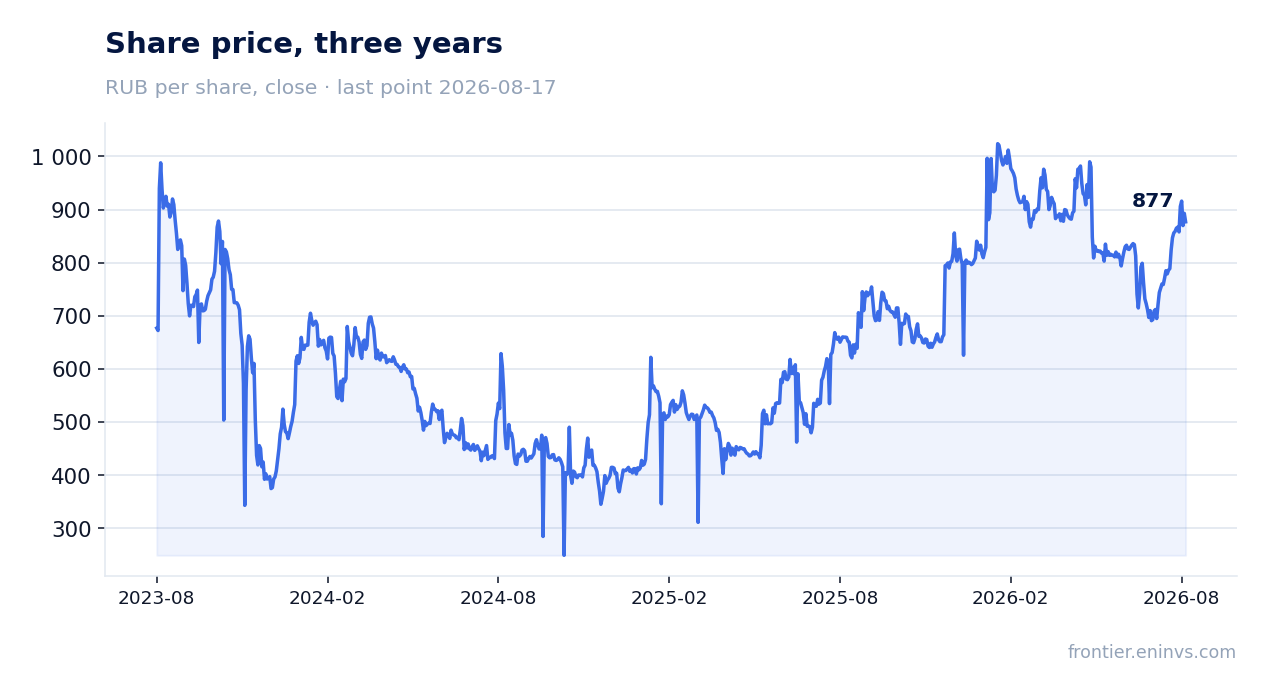
Dividend yield of 6.07% over 12 months — below our fair level of 10.5%, but the model expects a payout of 112.97 rubles per share
Over the last 12 months, the company paid 0.0 rubles per share, so the dividend yield of 6.07% is likely the result of share price growth rather than actual payments. Our model estimates the next payout at 112.97 rubles per share, giving a forward yield of 13.3% — above our fair level of 10.5%.
The payout ratio according to the model is 0.36 of profit — the company allocates just over a third of net profit to dividends. This is a moderate policy that leaves funds for development and debt repayment, but with negative debt and excess liquidity, shareholders may expect higher payouts.
Over 12 months, debt decreased by 3.5 billion rubles — the company is actively paying off, but with negative debt it is rather accumulation of liquidity
Over the last 12 months, net debt decreased by 3.5 billion rubles. Given that debt is already negative, this reduction means not so much repayment of loans as growth of cash on accounts. The company is accumulating liquidity, which is also visible from operating cash flow of 299.3 billion rubles.
Such dynamics are typical for companies preparing for large payments — dividends or investments. For a shareholder, this is a positive signal: resources for payments exist, and the model expects a dividend of 112.97 rubles per share. But if accumulation continues without payments, it will weigh on valuation.
Valuation on the latest reported figures
| Metric | Value |
|---|---|
| Market cap | 15.2 bn ₽ |
| P/E (LTM) | 2.7 |
| P/B | 1.16 |
| Operating cash flow (LTM) | 299 bn |
| ROE | 80.2% |
| Dividend yield (12m) | 6.1% |
Bottom line
Bottom line: for the first half of 2026, TNS Energo Kuban showed strong revenue growth of 15.9%, but the EBITDA margin of 1610.3% is an accounting artifact of revaluation, not an operational breakthrough. Net profit grew modestly — by 6.7%, and that is the real pace of the business. The company sits on cash: net debt is minus 9.2 billion rubles, and over 12 months it decreased by another 3.5 billion rubles. The main question for a holder is when excess liquidity will turn into dividends: the model expects a payout of 112.97 rubles per share with a forward yield of 13.3%, above our fair level of 10.5%. If payments do not follow, the cheap valuation (P/E 2.74) may turn out to be a value trap.
Open the company's financial profile KBSB →
See also: market overview · valuation map · stock screeners