LUKOIL, 1H2026: dividend base of 19.1% for the half-year, interim dividend of RUB 732-771
On 28 August PJSC LUKOIL published its condensed interim consolidated IFRS statements for the six months of 2026. Revenue was RUB 2,059 bn, EBITDA RUB 815 bn, and net income attributable to shareholders RUB 431 bn. On the day of the release the share rose 6.3% against a gain of 1.0% in the MOEX index.
The half-year is strong, but the visible acceleration in profit is half a base effect, and the key number in the report is not profit but the dividend base: RUB 519 bn of adjusted free cash flow, about RUB 890 per share, or 19.1% of the price for six months. Adjusted for the actual payout practice, the interim dividend comes to RUB 732-771, or 15.8-16.6% for a single half-year.
- Revenue grew only 8%, while operating profit grew 2.5 times. The entire gain came from two cost lines, not from sales.
- The 1H2025 base contains a one-off expense of RUB 141 bn for the share-ownership programme. Without it, operating profit grew 59%, not 2.5 times.
- Taxes other than income tax fell 14% while revenue rose. That is about RUB 100 bn and the largest single source of new margin.
- Adjusted free cash flow for the half-year is RUB 519 bn, or 19.1% of market capitalisation. The policy explicitly requires the interim dividend to be calculated from six-month data, i.e. from this report.
- There will be no dividend decision at the 31 August board meeting. The agenda has a single item: the half-year results and progress against the budget.
- The balance sheet is now net cash: RUB 661 bn of cash against RUB 319 bn of total debt including leases.
- Cash flows cannot be compared year on year. The 1H2025 base still contains the divested foreign business.
- A fifth of the dividend base is growth in payables and tax liabilities, not earned cash. Without it the base would be RUB 404 bn, or RUB 690 per share.
- An annual yield cannot be derived from this half-year. Operating margin is 29.7% against 14.0% for all of 2025: the half-year is a peak, and in 2H2025 the continuing business delivered RUB 5 bn to shareholders.
- The shares trade at 1.8x EV/EBITDA on a last-twelve-months basis. That is the price of sanctions risk, not of operating weakness.
Revenue rose 8% and operating profit 2.5 times: the whole difference sits in two cost lines
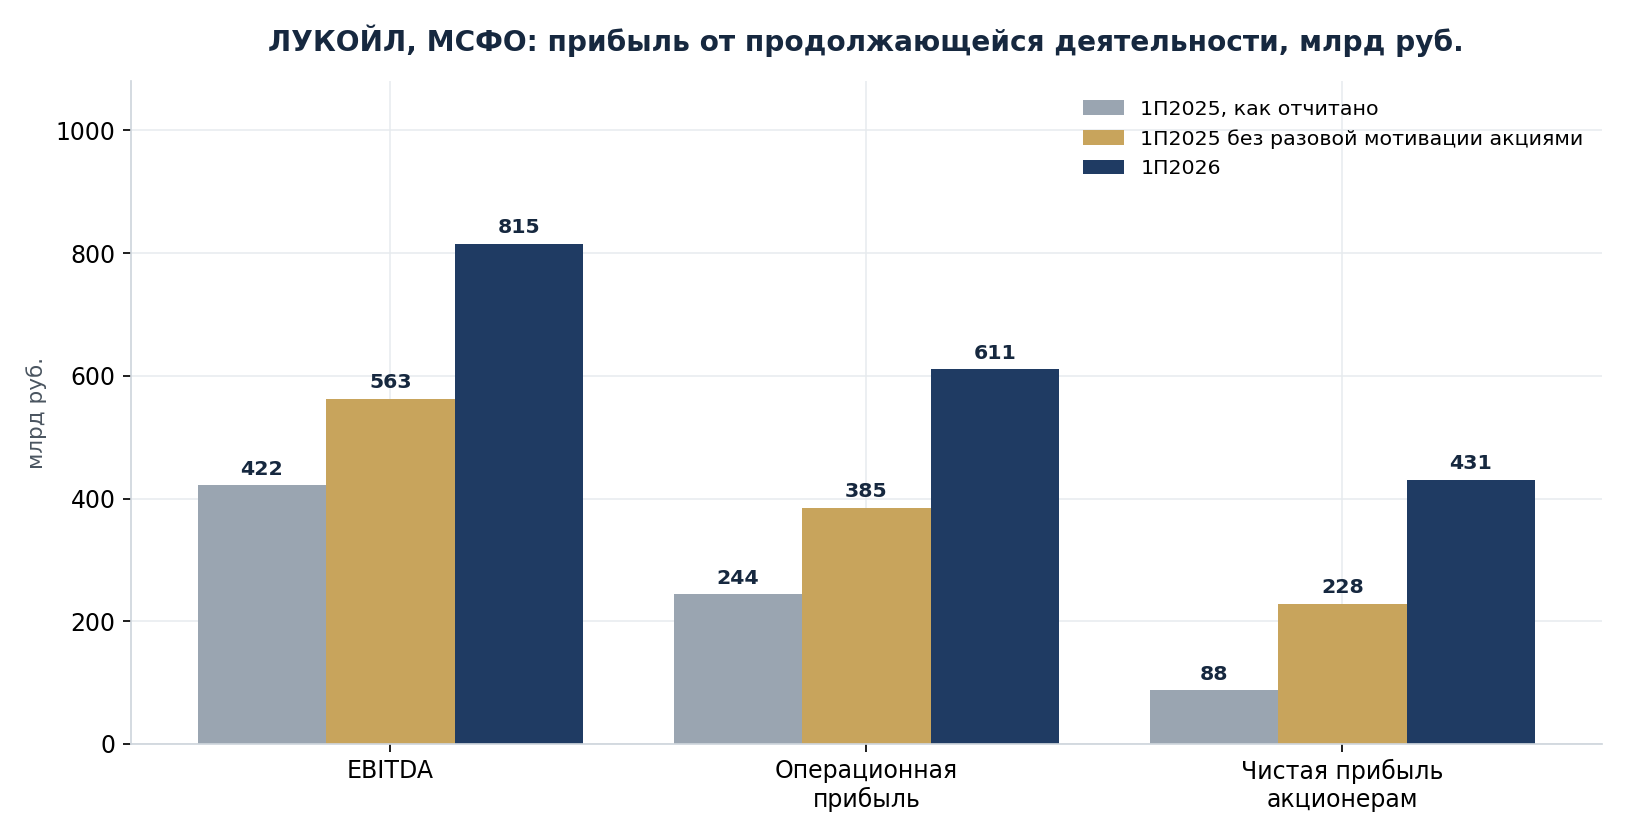
Sales revenue rose from RUB 1,907.6 bn to RUB 2,059.3 bn, i.e. by 8.0%. Operating profit increased from RUB 244.0 bn to RUB 610.9 bn, and EBITDA from RUB 421.9 bn to RUB 815.3 bn. The EBITDA margin was 39.6% against 22.1% a year earlier.
Two lines explain almost the whole gap. Selling, general and administrative expenses fell from RUB 242.2 bn to RUB 76.7 bn. Taxes other than income tax, together with export duties, declined from RUB 700.4 bn to RUB 600.9 bn. The other items behaved normally: operating expenses up 4%, transport up 10%, depreciation and amortisation up 15%.
RUB 141 bn of share-based compensation in last year's base accounts for two thirds of the visible acceleration
In Note 28 the company discloses that the expense under the key-employee share-ownership programme, recognised in 1H2025 within selling, general and administrative expenses, was RUB 140.9 bn. The programme involves about 30.0 mn ordinary shares, and the accounting entry was made against an increase in non-controlling interest. There is no similar expense for 1H2026 in the report.
If this one-off expense is added back to the base, the picture changes. 1H2025 operating profit becomes RUB 384.9 bn, and the 2026 growth is plus 59%, not 2.5 times. EBITDA becomes RUB 562.8 bn and growth plus 45%. Profit from continuing operations attributable to shareholders is RUB 228.4 bn, plus 89%, rather than 4.9 times.
Growth of 45-59% is still a strong result. But it is a result of a different order than the headline growth of 4.9 times.
The tax line added more to profit than sales did
Taxes and export duties fell by RUB 99.6 bn while revenue grew by RUB 151.7 bn. The company also reports excise duties net in this line, including the reverse excise, so the line is sensitive not only to production and prices but also to the damper.
It is impossible to determine from this document how much of the saving came from the damper and how much from volumes and prices. Segment data and the revenue breakdown are given as n/a with reference to Government Resolution No. 1102, which allows strategic companies to reduce disclosure. This is a limitation of the report, not a conclusion drawn from it.
Net cash position of RUB 343 bn: the balance sheet is stronger than before the sale of foreign assets
Cash rose from RUB 543.8 bn to RUB 661.4 bn, and another RUB 36.3 bn sits in other short-term financial assets. Total debt is RUB 82.0 bn short-term and RUB 236.7 bn long-term, i.e. RUB 318.7 bn together with lease liabilities of RUB 165.9 bn. The net cash position is RUB 342.7 bn.
Finance income for the half-year is RUB 43.7 bn against finance costs of RUB 22.4 bn: the financial block brings in a net RUB 21.3 bn. A separate item is dividends payable of RUB 259.7 bn within other current liabilities, against RUB 506.5 bn at the end of 2025. These are dividends declared but not yet paid: the cash physically remains in the company.
The half-year dividend base is RUB 519 bn, about RUB 890 per share, or 19.1-19.3% of the price
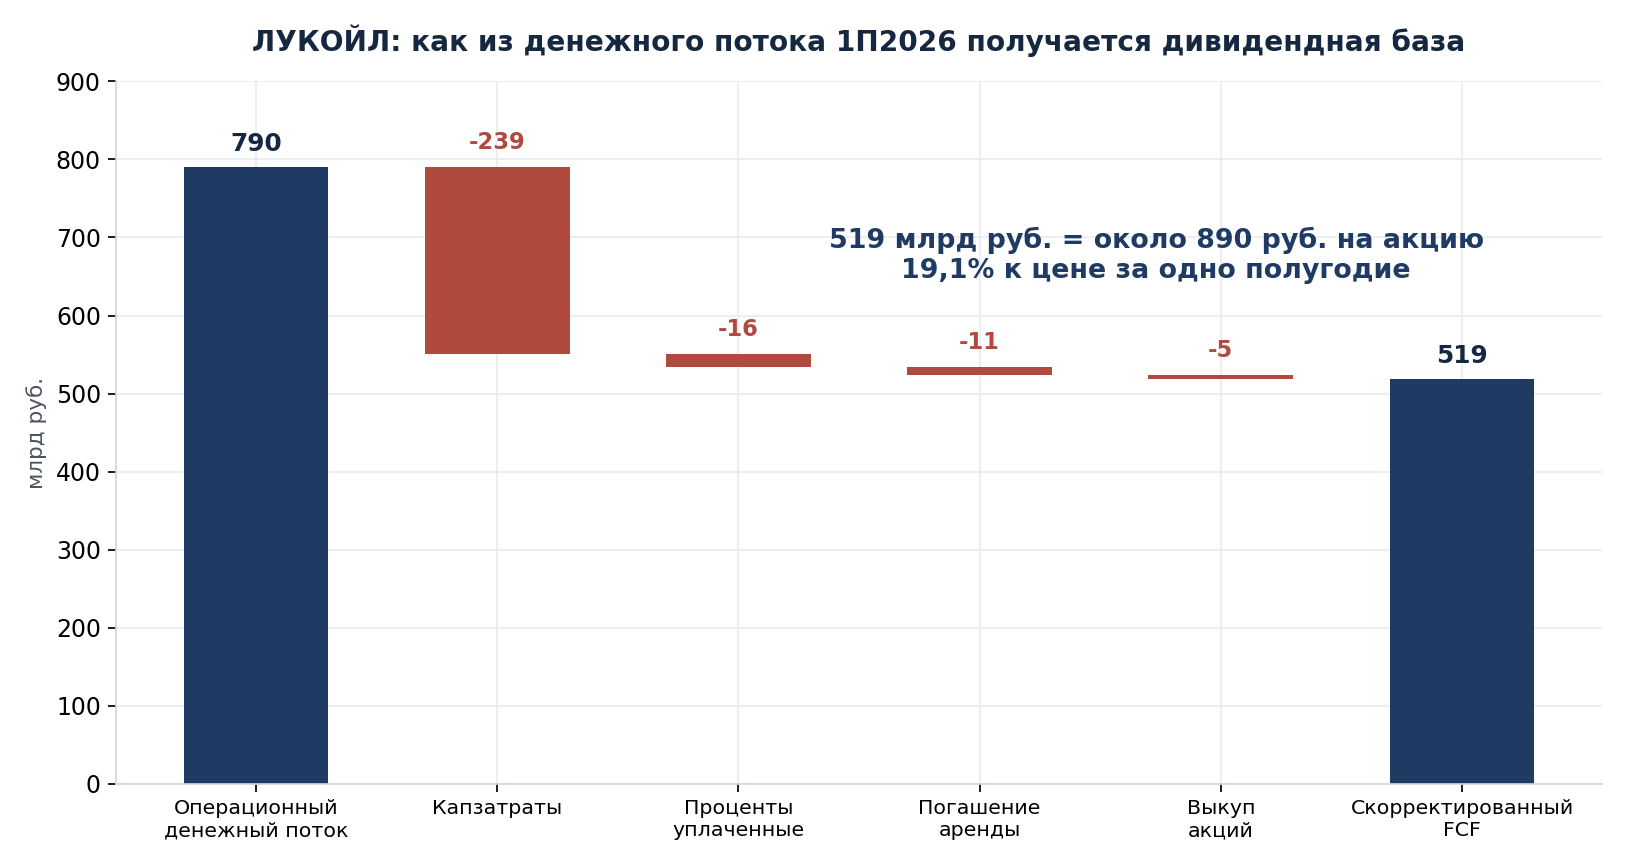
LUKOIL's dividend policy, as revised in December 2019, works as follows: the total dividend on shares outstanding, net of shares held by group entities, is at least 100% of adjusted free cash flow. The flow itself is calculated under IFRS as operating cash flow less capital expenditure, interest paid, repayment of lease liabilities and the cost of buying back the company's shares. The policy requires the interim dividend to be calculated from the six-month statements, i.e. from exactly this report.
Plugging in: operating cash flow of 790.0 less capex of 239.1 less interest paid of 16.5 less lease repayments of 10.7 less share buybacks of 4.5 equals RUB 519.2 bn.
Shares outstanding at 30 June were 585.9 mn; the actual base for the May payment was 581.3 mn shares (RUB 161.6 bn at a dividend of RUB 278). The half-year dividend base is therefore RUB 886-893 per share, roughly RUB 890. Under the policy the dividend per share is rounded to a whole rouble.
Against the price of RUB 4,633, these RUB 890 are 19.1% for a single half-year. The same result comes from the capitalisation side: a dividend base of RUB 519 bn on a capitalisation of RUB 2,714 bn.
A fifth of the base is growth in liabilities, not earned cash
Operating cash flow of RUB 790 bn includes a RUB 115 bn inflow from working capital: payables added RUB 53 bn and liabilities for taxes other than income tax added RUB 73 bn. The latter is visible in the balance sheet too: mineral extraction tax payable rose from RUB 56.5 bn to RUB 88.1 bn, additional income tax from RUB 30.6 bn to RUB 55.2 bn, and VAT from RUB 61.4 bn to RUB 98.1 bn. These are deferred payments, not earnings of the half-year.
Without this inflow the dividend base would be RUB 404 bn, or RUB 690 per share, i.e. 14.9% of the price instead of 19.1%. The policy formula uses operating cash flow as it is, so working capital is part of the base by definition, and in earlier years it worked both ways: in 1H2024 working capital, on the contrary, absorbed RUB 152 bn, and a dividend was still declared. We therefore calculate below from the base as it is, and keep the adjustment as an assessment of the quality of that base.
The actual payout is 82-87% of the formula: the interim dividend guide is RUB 730-775, or 15.8-16.7% of the price
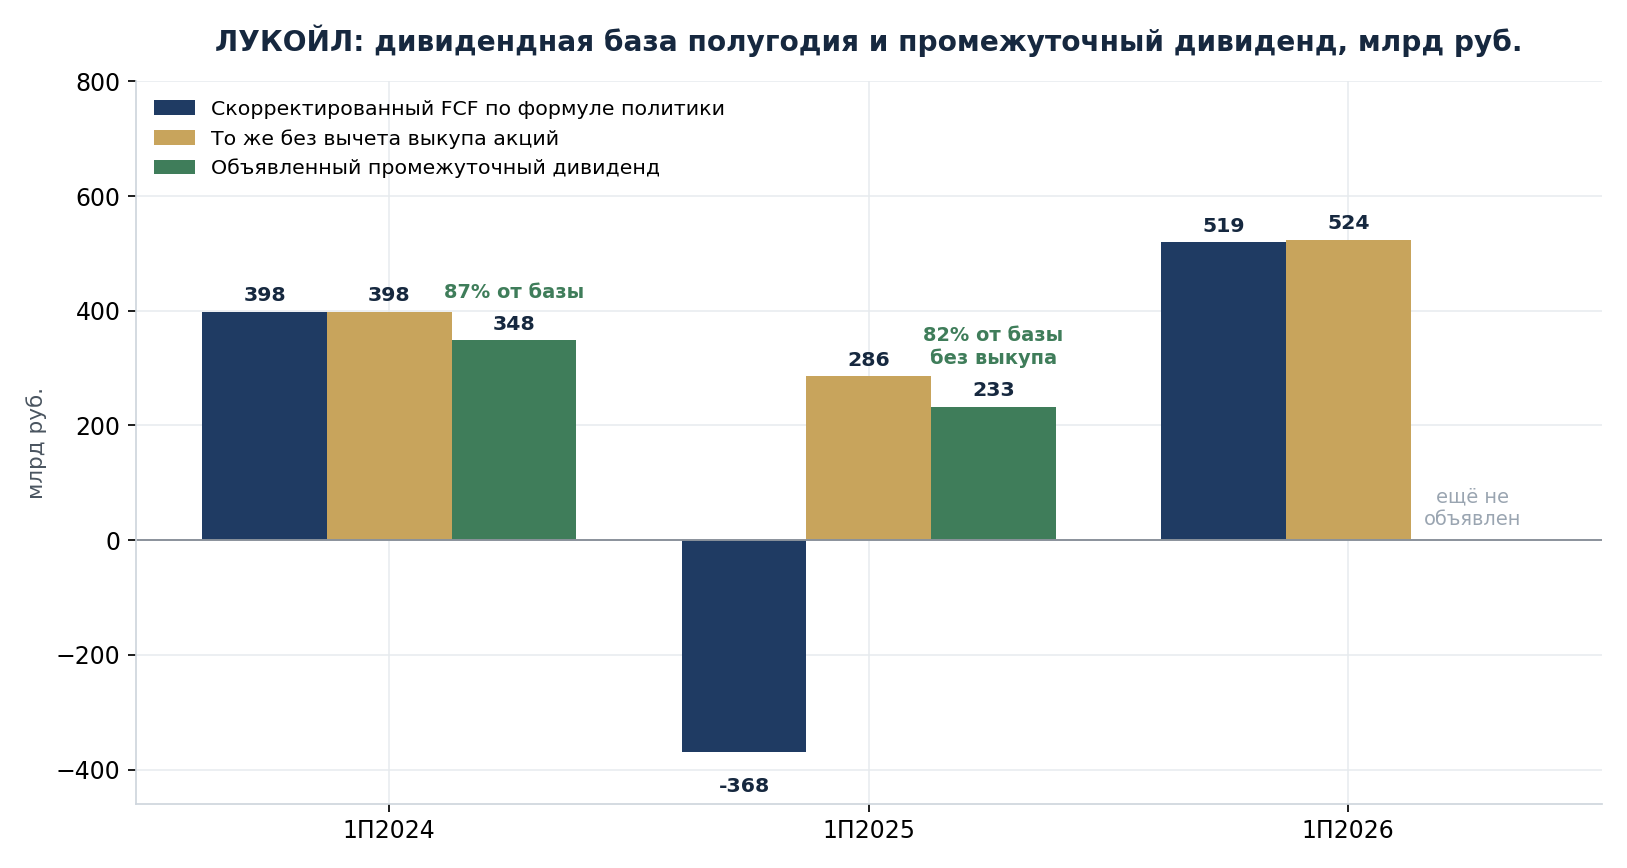
The formula sets a floor, but the history of the last two years shows that the board declares less than the calculated amount.
- For 1H2024, adjusted cash flow was RUB 398.5 bn. An interim dividend of RUB 514 per share was declared, which on 677.7 mn shares outstanding is about RUB 348 bn, or 87% of the base.
- For 1H2025 the formula gave minus RUB 368.3 bn: the share buyback of RUB 654.3 bn was included in the flow. Without that deduction the base would have been RUB 286.0 bn. An interim dividend of RUB 397 was declared, i.e. about RUB 233 bn, or 82% of the base excluding the buyback.
Applying the same 82-87% to the half-year base gives a guide of RUB 732-771 per share, which is 15.8-16.6% of the price for a single half-year. If the board pays exactly to the letter of the policy, the figure would be RUB 886-893, or 19.1%.
But an annual yield cannot be derived from this half-year
The temptation to multiply by two is strong, and the arithmetic gives an attractive number. The final dividend related to the interim as 111% for 2023, 105% for 2024 and 70% for 2025, i.e. the full year came out 1.7-2.1 times larger than the interim payment. From the guide of RUB 732-771 this gives RUB 1,245-1,630 for 2026, or 27-35%.
This number should not be trusted, and here is why. The operating margin of 1H2026 is 29.7% against 14.0% for all of 2025 and 23.9% for 2024: the half-year is a peak. In 2H2025 the continuing business delivered only RUB 5 bn to shareholders on EBITDA of RUB 470 bn - at LUKOIL there may be a chasm between the operating result and what reaches the shareholder. In addition, a fifth of the base is deferred tax payments.
The market itself does not believe this number either. Dividends actually paid over the last twelve months are RUB 675, 14.6% of the price; the share trades at RUB 4,633 and cost RUB 5,872 in January. Had the market been pricing a 27-35% annual yield, the price would be different. A reasonable reading: the half-year figure is a fact, the annual figure is a scenario in which the peak half-year repeats, and the market is pricing that it will not repeat or will not reach the shareholder.
Calendar: on 31 August the board meets without a dividend item
On 24 August the company disclosed that a board meeting is scheduled for 31 August with a single agenda item: the group's results for 1H2026 and progress against the 2026 budget and investment programme. There are no dividends on the agenda.
LUKOIL takes the interim dividend decision in the autumn. For 2024 the record date fell on 16 December 2024 (RUB 514), for 2025 on 9 January 2026 (RUB 397). The final dividend for 2025 is RUB 278 with a record date of 1 May 2026; the total for 2025 is RUB 675 per share.
Valuation: 1.8x EV/EBITDA is the price of sanctions risk, not of operating weakness
At a price of RUB 4,633 (29 August, 16:00 MSK) and 585.9 mn shares outstanding, capitalisation is RUB 2,714 bn and enterprise value, after the net cash position, is RUB 2,372 bn.
Last-twelve-months EBITDA is RUB 1,286 bn (892 for 2025 less 422 for 1H2025 plus 815 for 1H2026). EV/EBITDA is 1.8x. If the half-year is doubled, it is 1.5x.
Earnings are more complicated. Last-twelve-months profit from continuing operations attributable to shareholders is RUB 436 bn, P/E 6.2x. But in 2H2025 the continuing business brought shareholders only RUB 5.0 bn: RUB 92.5 bn for the year against RUB 87.5 bn in 1H. Other expenses ate the profit - RUB 230.2 bn for the year against RUB 16.6 bn in 1H. On a doubled 1H2026 the P/E is 3.2x. The trailing dividend yield is 14.6% (RUB 675 over the last twelve months by record dates).
What is not visible in the report
2025 ended for LUKOIL with a net loss attributable to shareholders of RUB 1,064 bn: discontinued operations, i.e. the divested foreign business, contributed minus RUB 1,157 bn. Shareholders' equity fell from RUB 6,826 bn to RUB 3,358 bn, and stood at RUB 3,630 bn on 30 June 2026.
Because of this, year-on-year comparison of cash flows is not valid: the operating cash flow of 1H2025 (RUB 711.6 bn) includes RUB 279.7 bn from discontinued operations. The 1H2026 flow of RUB 790.0 bn already reflects the pure Russian business.
The disclosed statements contain no segment breakdown, production and refining volumes, or sales geography: all the cells are marked n/a. What is happening inside can be judged only from the aggregates.
Why LUKOIL gets 16% and Tatneft 5.9%: the policy makes the difference, not the business
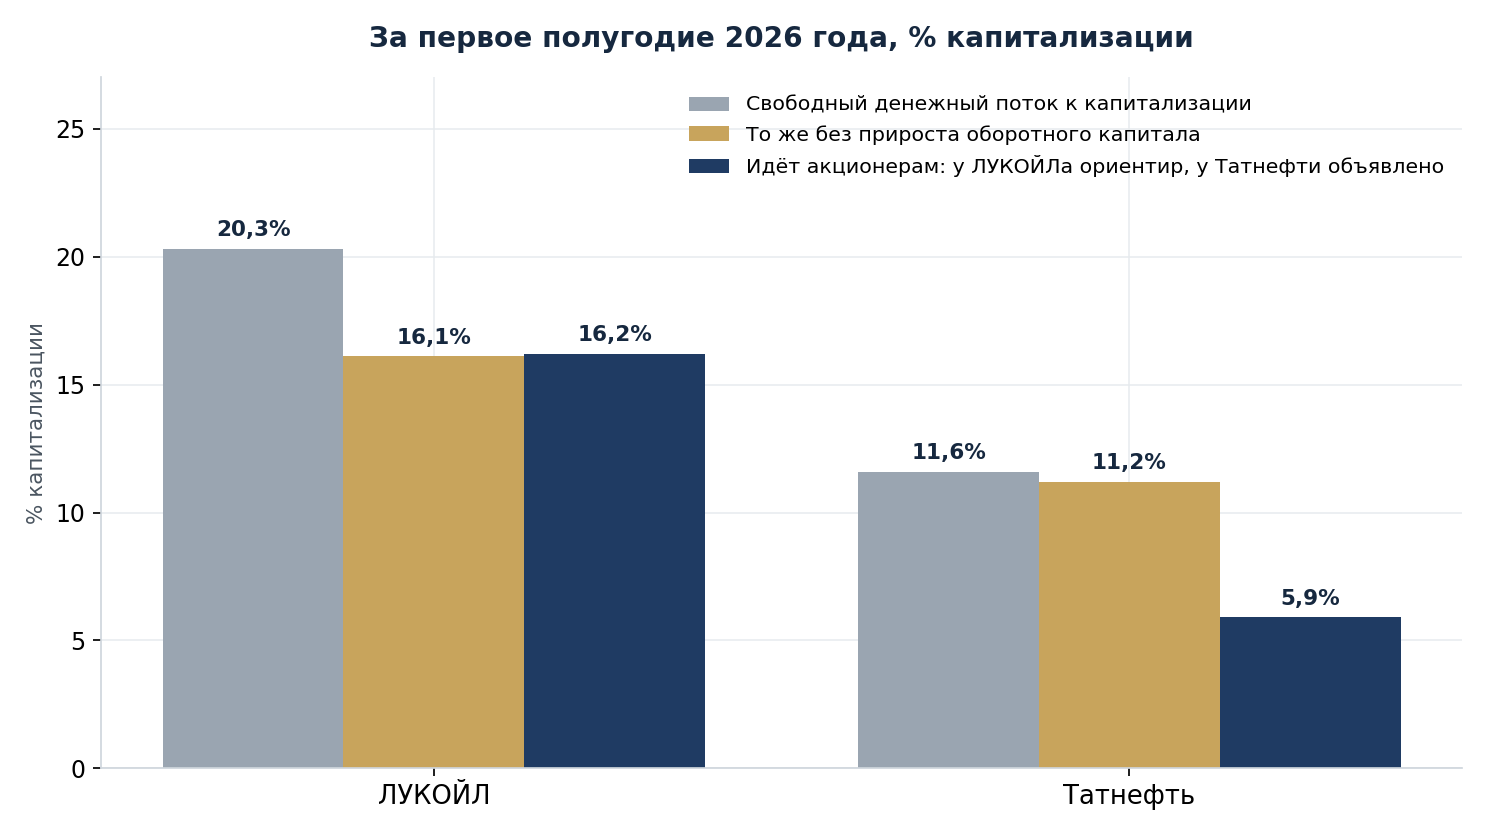
LUKOIL's half-year yield looks almost three times higher than that of Tatneft, which declared RUB 32.88, i.e. 5.9%. In cash terms the gap is noticeably smaller.
- Free cash flow to capitalisation for the half-year: LUKOIL 20.3%, Tatneft 11.6%.
- The same excluding working-capital growth: LUKOIL 16.1%, Tatneft 11.2% - a gap of less than one and a half times.
- What reaches the shareholder for the half-year: for LUKOIL an estimated 15.8-16.6%, for Tatneft a declared 5.9%.
The reason is the design of the policies. LUKOIL distributes practically all of its adjusted cash flow, Tatneft half of its accounting profit, and accumulates the rest: cash rose from RUB 66.9 bn to RUB 144.2 bn, and bank deposits from RUB 21.3 bn to RUB 131.5 bn. The difference in yield is a difference in who gets the cash flow, not in the quality of the business.
Conclusion
Russian LUKOIL after the sale of its foreign assets is a company with an EBITDA margin of about 40%, a net cash position of RUB 343 bn and a dividend base of RUB 519 bn for the half-year, i.e. 19.1% of capitalisation. If the payout practice is maintained, the interim dividend in the autumn is of the order of RUB 732-771 per share, or 15.8-16.6% of the price, and up to RUB 890, or 19.1%, to the letter of the policy. An annual yield should not be derived from this: the half-year is a margin peak, a fifth of the base is deferred tax payments, and the sustainability of the margin cannot be checked - the company discloses no segments, no volumes and no tax structure.
Extended issuer cards and the history of financial indicators are on our portal: frontier.eninvs.com. Related review: Tatneft.
See also: market overview · valuation map · stock screeners