Novatek: revenue and EBITDA rose, but tax, not gas, trimmed the profit
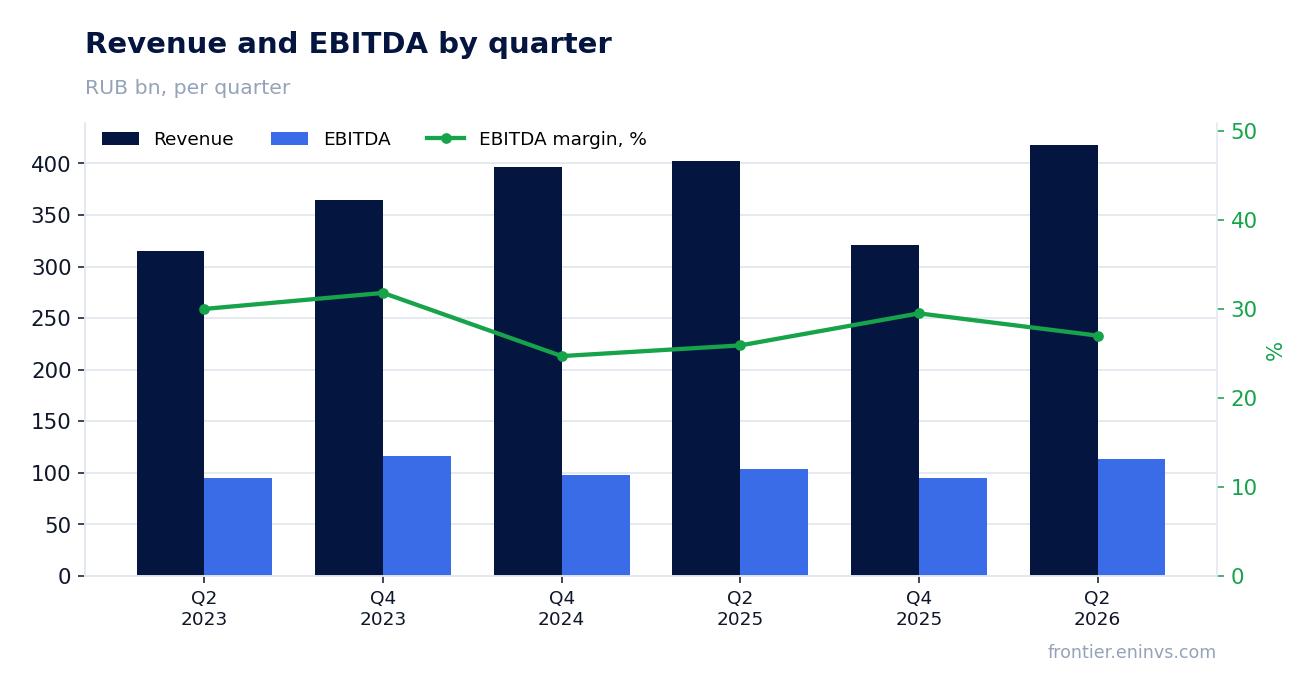
On 24 July Novatek reported results for the second quarter of 2026. Revenue was RUB 418.2 bn (+4.0% YoY), EBITDA – RUB 113.1 bn (+8.6%), net profit – RUB 110.5 bn (-2.8%). The EBITDA margin rose to 27.0% from 25.9%, but the net margin fell to 26.4% from 28.3%: the operating improvement did not reach the bottom line because of tax. At RUB 1,001.5 the share trades below its own history on EV/EBITDA, while the 7.5% dividend yield is below what we consider fair, so the view on the share is rather positive, but without a cushion in the dividend.
Key takeaways
— Revenue added 4.0% while EBITDA rose 8.6% – the margin climbed to 27.0%
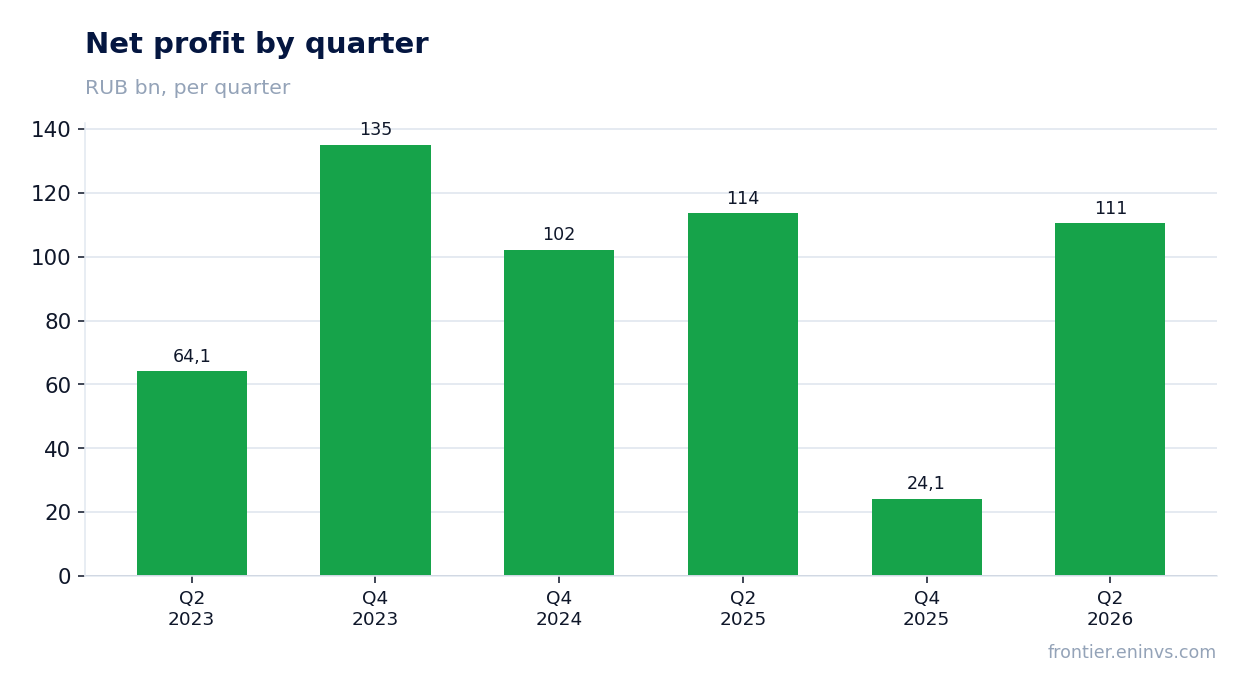
— Net profit fell 2.8% even though operating profit rose: the gap was created by income tax
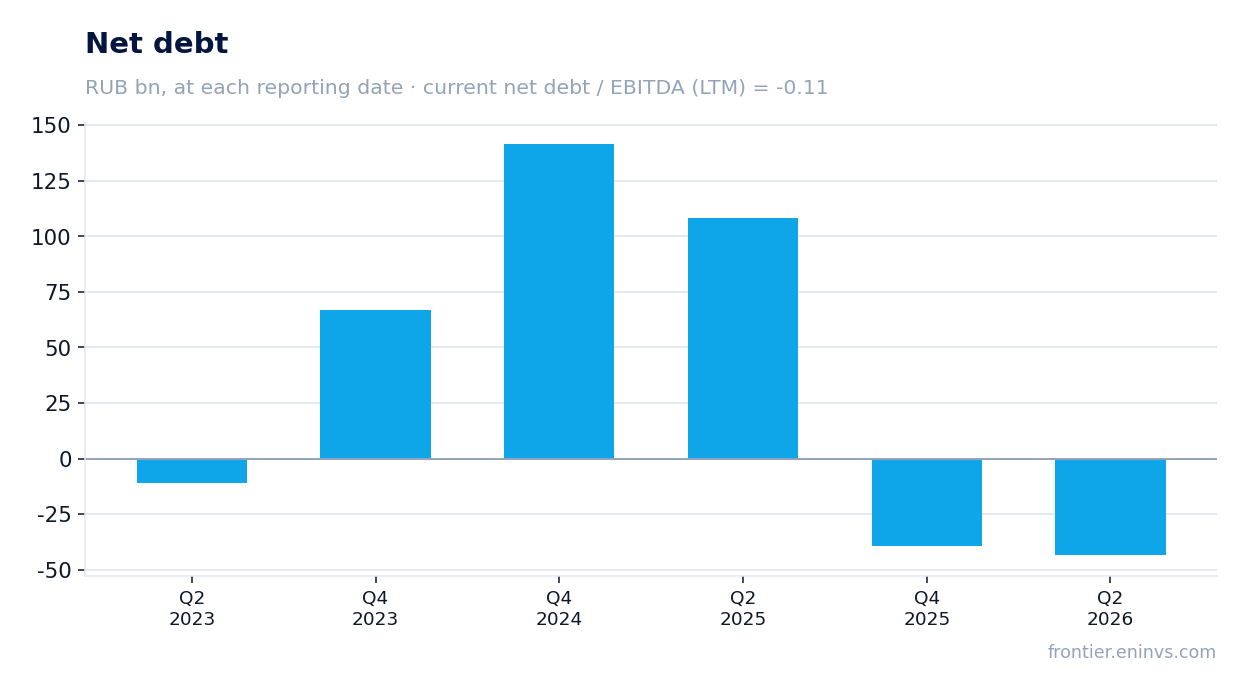
— Net debt turned negative: from RUB 108.4 bn on 30 June 2025 to -43.5 bn on 30 June 2026
— Operating cash flow for the half-year was RUB 172.2 bn against RUB 43.9 bn of investment
— Our estimate for the 2026 dividend is RUB 82.73 per share, a 7.4% yield against the 10.5% we consider fair
— EV/EBITDA of 8.3 is below its own three-year average of 9.0 – the share is cheaper than its history
— The portal's model puts the upside to fair value at +31%
Attractiveness
Key figures, RUB bn
| Metric | Q2 2025 | Q2 2026 | Change |
|---|---|---|---|
| Revenue | 402 | 418 | +4.0% |
| EBITDA | 104 | 113 | +8.6% |
| Operating profit | 77.5 | 85.3 | +10.1% |
| Net profit | 114 | 111 | -2.8% |
| Operating cash flow | 97.8 | 86.1 | -12.0% |
| EBITDA margin | 25.9% | 27.0% | +1.1 pp |
| Net margin | 28.3% | 26.4% | -1.9 pp |
Revenue added 4.0% while EBITDA rose 8.6% – the margin climbed to 27.0%
Revenue for the second quarter of 2026 was RUB 418.2 bn, 4.0% more than a year earlier. The growth is modest but steady: the company sells gas and liquid hydrocarbons domestically and abroad, and the quarter brought no sharp price swings.
EBITDA rose 8.6% to RUB 113.1 bn, outpacing revenue. This means costs grew slower than income, and the EBITDA margin climbed to 27.0% from 25.9% a year earlier. Operating leverage worked in the company's favour.
Operating profit was RUB 85.3 bn, also above last year's level. The main contribution to the margin came from cost control rather than one-off items: in the half-year report depreciation rose moderately, to RUB 55.4 bn from 53.1 bn, and materials and services – to RUB 40.5 bn from 35.0 bn.
Net profit fell 2.8% even though operating profit rose: the gap was created by income tax
Net profit for the second quarter was RUB 110.5 bn, 2.8% less than a year earlier, despite operating profit growth. The reason is income tax: in the half-year report current tax rose to RUB 60.1 bn from 42.0 bn a year earlier, while deferred tax benefit shrank to RUB 13.6 bn from 20.4 bn.
As a result, the net margin fell to 26.4% from 28.3%, even though the EBITDA margin rose. The gap between operating and net results is not a deterioration of the business but a rise in the tax burden.
Profit attributable to Novatek shareholders for the half-year was RUB 218.7 bn against 225.7 bn a year earlier. This confirms that the pressure on net profit comes from tax, not from operations.
Net debt turned negative: from RUB 108.4 bn on 30 June 2025 to -43.5 bn on 30 June 2026
As of 30 June 2026 net debt was -RUB 43.5 bn, meaning cash exceeds debt obligations. A year earlier, on 30 June 2025, net debt was positive at RUB 108.4 bn. The change over 12 months is minus RUB 151.9 bn.
Since the start of the year net debt fell from -RUB 39.3 bn on 31 December 2025 to -RUB 43.5 bn on 30 June 2026, a change of minus RUB 4.2 bn. The company is building its cash cushion: cash and equivalents at the end of the half-year were RUB 311.7 bn against 234.3 bn a year earlier.
The net debt to LTM EBITDA ratio is -0.11, meaning the company operates with a net cash position. This removes debt risk and gives freedom for investment and payouts.
Operating cash flow for the half-year was RUB 172.2 bn against RUB 43.9 bn of investment
For the first half of 2026 operating cash flow was RUB 172.2 bn, below last year's 195.7 bn. The decline is due to higher tax payments and working capital changes: other operating cash movements were minus RUB 59.5 bn against minus 38.0 bn a year earlier.
Investment for the half-year was RUB 43.9 bn against 70.9 bn a year earlier. Lower capex freed up cash: free cash flow for the half-year exceeded RUB 128 bn.
Financing activities absorbed RUB 154.9 bn – shareholder payouts and debt repayment. Despite this, cash at the end of the period rose to RUB 311.7 bn from 337.9 bn at the start of the year, meaning the company spent part of its cushion but kept it substantial.
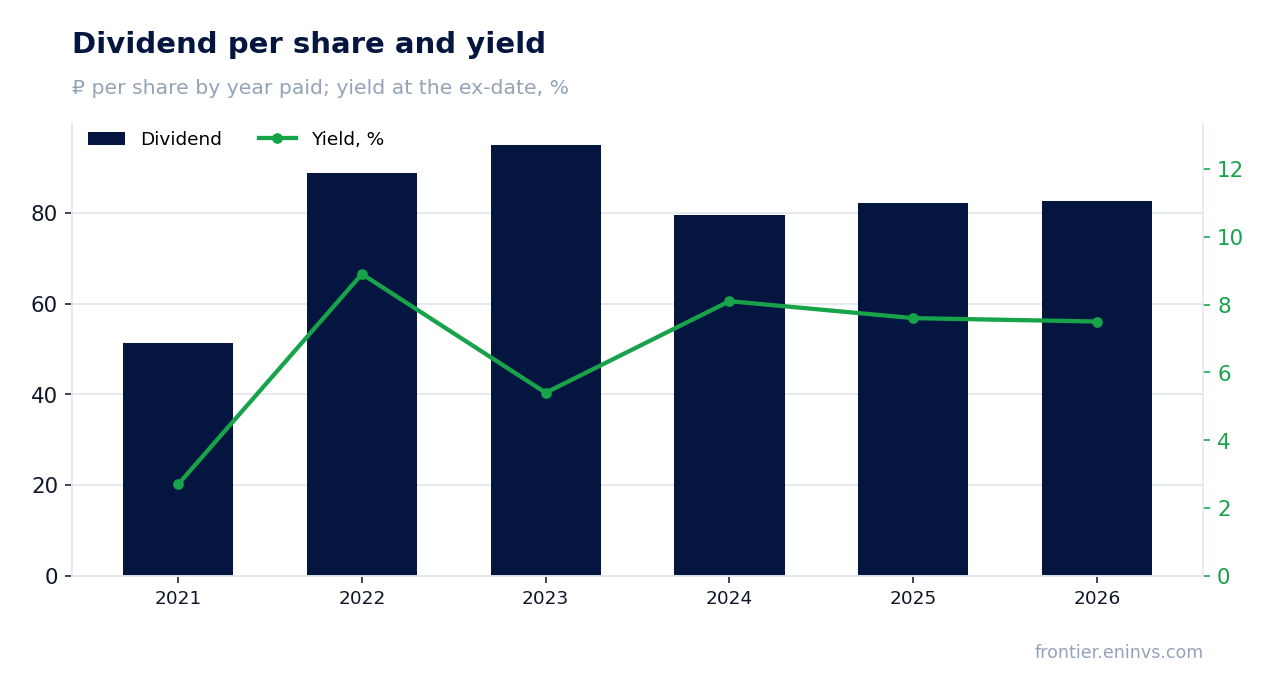
Our estimate for the 2026 dividend is RUB 82.73 per share, a 7.4% yield against the 10.5% we consider fair
The latest payment for calendar 2026 is RUB 82.73 per share, a 7.5% yield at the ex-date price. This matches our estimate of the annual dividend calculated by the payout model: RUB 82.73 per share at a payout ratio of 0.55 of profit.
At the current price of RUB 1,001.5 the forward yield on our estimate is 7.4%. This is below the yield we consider fair for this name – 10.5% – and below the key rate of 14.0%. The payout history shows the company pays consistently: RUB 82.15 in 2025, 79.59 in 2024, 95.08 in 2023.
The dividend rests on profit and cash flow. With LTM net profit of RUB 179.8 bn and free cash flow covering the payouts, the risk of a lower payout is not high. But if profit falls due to taxes or gas prices, the payout ratio could be revised downwards.
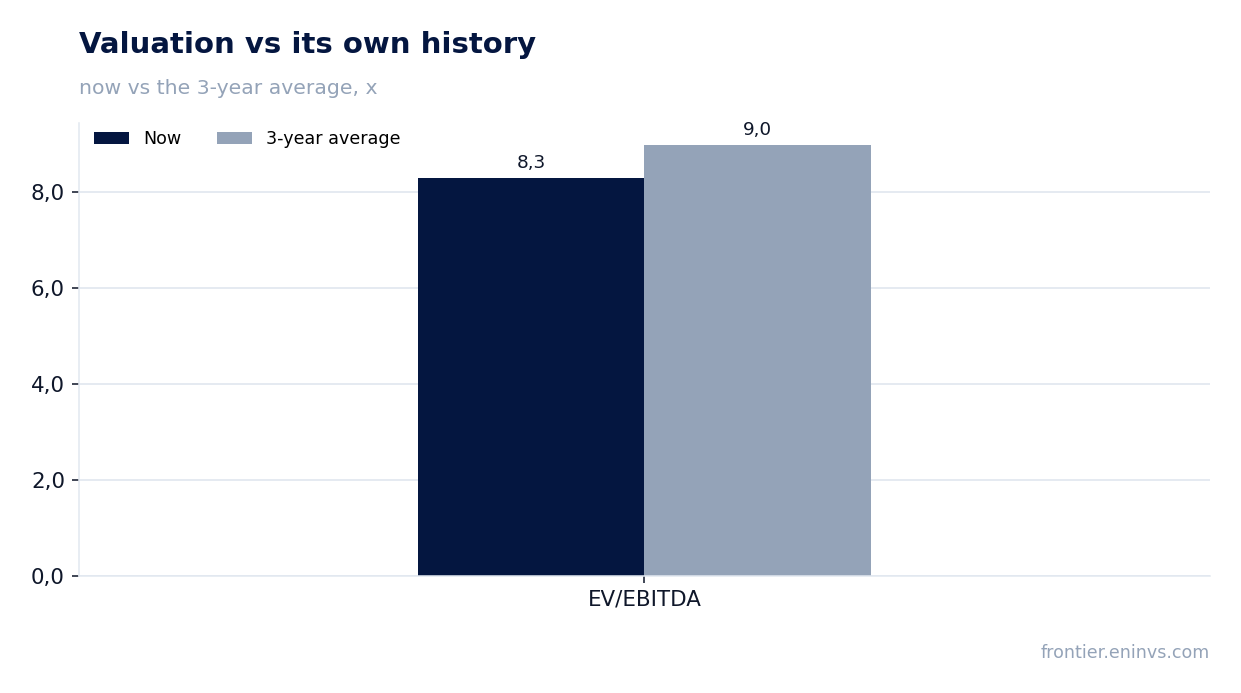
EV/EBITDA of 8.3 is below its own three-year average of 9.0 – the share is cheaper than its history
On the LTM EV/EBITDA multiple of 8.3 the share trades below its own three-year average of 9.0 – 8% cheaper. This is the only valid comparison: we do not compare with the sector or peers, as no such data is in the facts.
The LTM P/E is 19.0, which looks moderate given the 26.4% net margin and 15.1% ROE. The market values the company at RUB 3.4 trn – the largest independent gas producer in Russia.
The portal's model, which reprices EBITDA at current commodity prices against the target EV/EBITDA, puts the upside to fair value at +31%. This is our own estimate, not a market consensus.
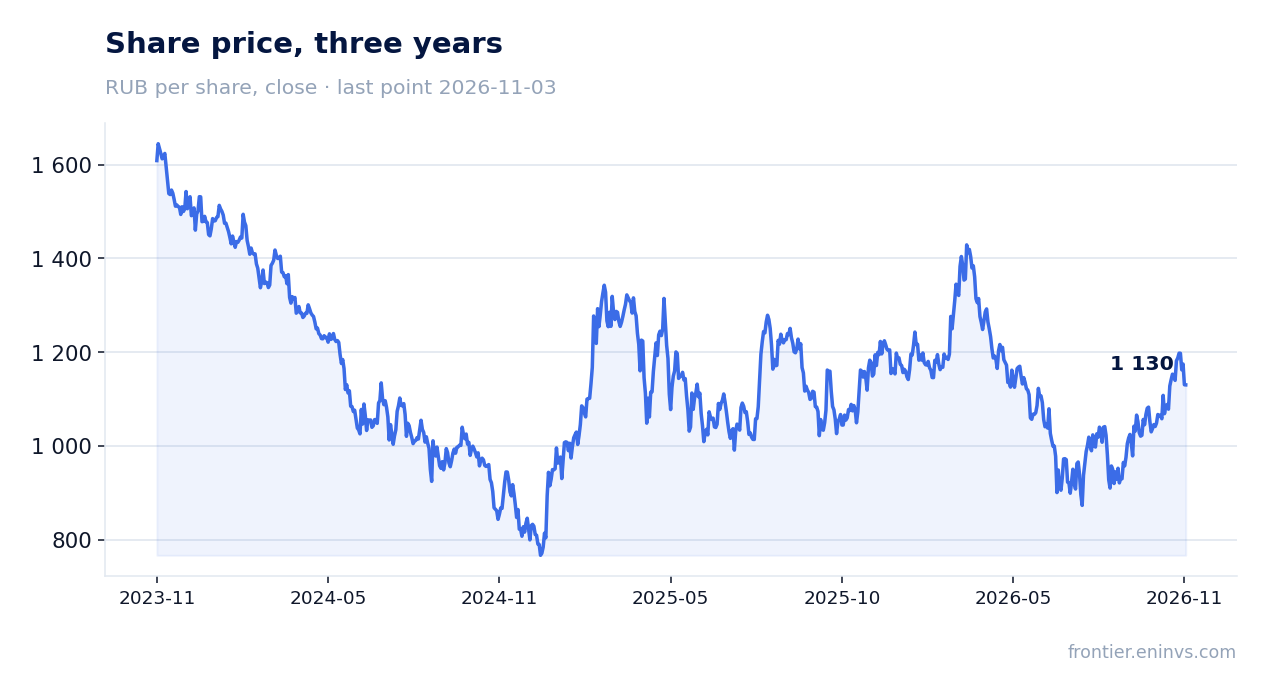
The portal's model puts the upside to fair value at +31%
Our model values the share at 31% above the current price of RUB 1,001.5. The calculation relies on current commodity prices and the target EV/EBITDA multiple, not on analyst consensus.
Since the report was published the share has risen 12.9% – the market reacted positively to the results. Before the release the price was RUB 1,001.5; on the release day the share added 1.7%.
The share is held in the portal's live model strategy RU Commodity-Upside. This is a fact, not an argument for the verdict: membership is determined by the strategy's screen.
Valuation on the latest reported figures
| Metric | Value |
|---|---|
| Market cap | 3 412 bn ₽ |
| P/E (LTM) | 19.0 |
| EV/EBITDA (LTM) | 8.3 |
| P/B | 1.20 |
| Net debt / EBITDA (LTM) | -0.11 |
| Operating cash flow (LTM) | 480 bn |
| ROE | 15.1% |
| Dividend yield (12m) | 7.5% |
| EV/EBITDA, 3-year average | 9.0 |
Dividend per share, ₽, and yield at the ex-date
| Year paid | Dividend | Yield |
|---|---|---|
| 2021 | 51.41 | 2.7% |
| 2022 | 88.77 | 8.9% |
| 2023 | 95.08 | 5.4% |
| 2024 | 79.59 | 8.1% |
| 2025 | 82.15 | 7.6% |
| 2026 | 82.73 | 7.5% |
Bottom line
The strong side of the report is EBITDA growth of 8.6% and a margin of 27.0%, plus a net cash position: net debt of -RUB 43.5 bn against 108.4 bn a year earlier. The weak side is the 2.8% fall in net profit due to tax and the decline in operating cash flow for the half-year. The 7.4% dividend yield is below the 10.5% we consider fair, which limits appeal for an income-oriented holder. But the EV/EBITDA multiple of 8.3 is below its own history, and the portal's model puts the upside at +31%. The verdict is rather attractive: the share is cheaper than its history and has a debt cushion, but the dividend does not offer enough premium to the key rate.
Open the company's financial profile NVTK →
See also: market overview · valuation map · stock screeners