Ozon 2Q2026: record EBITDA, a shrinking basket and a cautious guidance
On July 30, 2026, MKPAO Ozon published its [results for the second quarter of 2026](https://ir.ozon.com/ru/sth/ozon-obyavlyaet-finansovye-rezultaty-za-vtoroy-kvartal-2026-goda-db970cd3). Revenue grew 47% year on year to RUB 334.2 bn, adjusted EBITDA rose 48% to a record RUB 57.9 bn, and net profit was RUB 10.1 bn versus RUB 0.4 bn a year earlier. By the evening of July 30 the shares were down about 3.8%, while the MOEX index fell 1.2%.
Below is a breakdown of what stands behind these figures: by segment, by unit economics, by cash flow and against the company's own guidance. The issuer's card with the history of its metrics is on our portal.
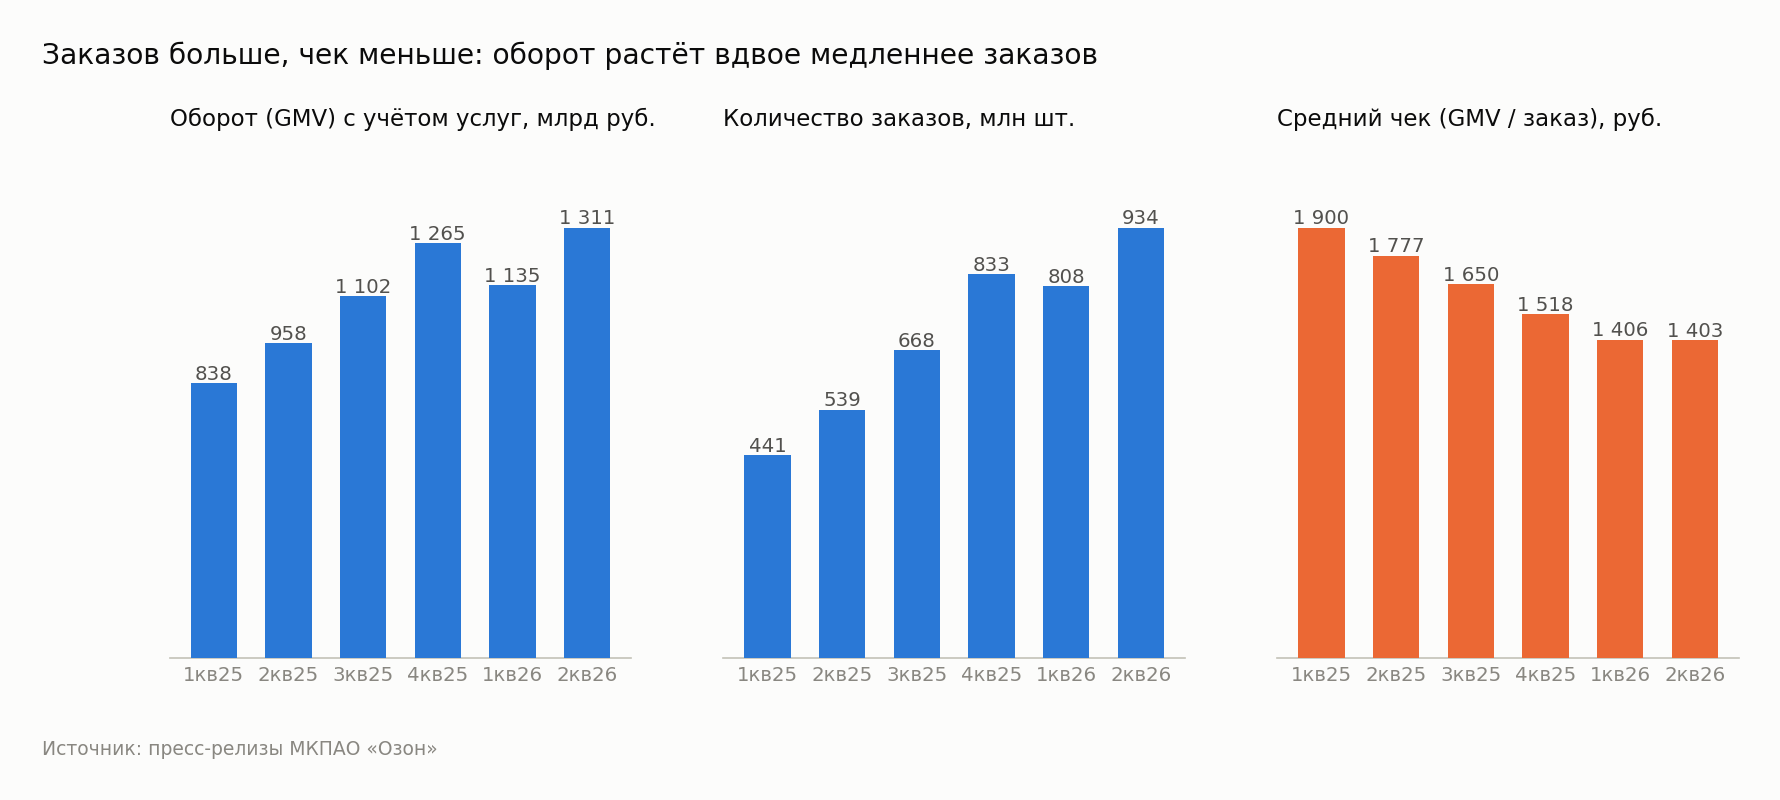
Turnover grew 37% while orders grew 73%: shoppers are splitting their baskets
Turnover including services (GMV – the total value of all orders on the platform plus service revenue) reached RUB 1,310.8 bn, up 37% year on year. The number of orders grew 73% to 934.3 mn. The gap means one thing: the average basket is falling. For the quarter it was RUB 1,403 versus RUB 1,777 a year earlier, i.e. down 21%.
The active buyer base grew more modestly – 14% to 69.2 mn. All the rest of the order growth came from frequency: over the last 12 months each buyer places about 47 orders versus roughly 30 a year earlier.
This is a deliberate strategy – since the start of 2025 the company has been promoting inexpensive everyday goods, including groceries. But there is also a market backdrop: according to SberIndex, Russians' spending on electronics is falling 17% year on year, i.e. expensive categories are shrinking across the whole market, not only at Ozon.
A side effect is that the marketplace share (third-party sellers' goods) of turnover declined to 81.6% from 84.3% a year earlier. The company sells more of its own goods, which is a lower-margin model: revenue from goods sales is growing 35%, while services are growing 50%.
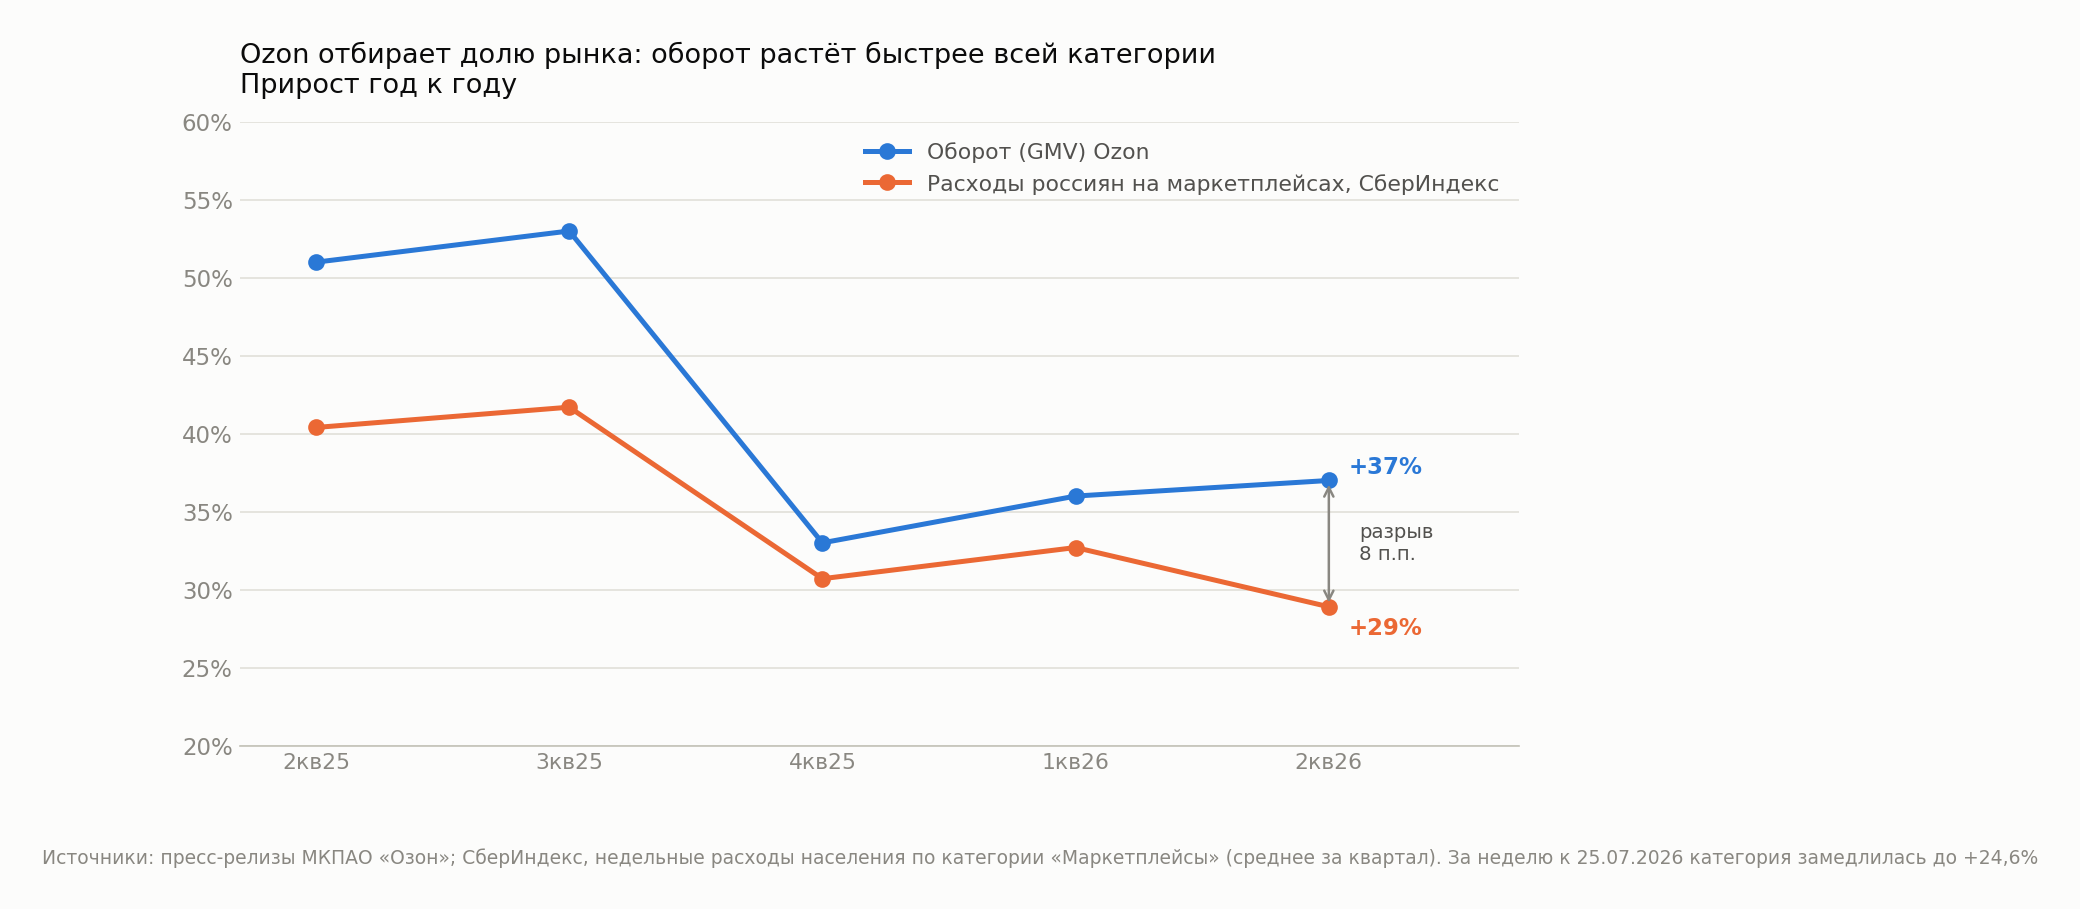
Ozon is growing faster than the market, but the market itself is slowing
An independent benchmark is SberIndex's weekly data on household spending in the "Marketplaces" category. In 2Q2026 the category grew 28.9% year on year, Ozon 37%. The gap is 8 pp versus 3.3 pp a quarter earlier: the company is taking market share at an accelerating pace.
The flip side: the category itself is slowing. In 3Q2026 it is running at +26.8% so far, and in the week to July 25 growth dropped to +24.6%. In the second half there will be less support from the market, and holding +37% will have to come almost entirely from taking share from competitors.
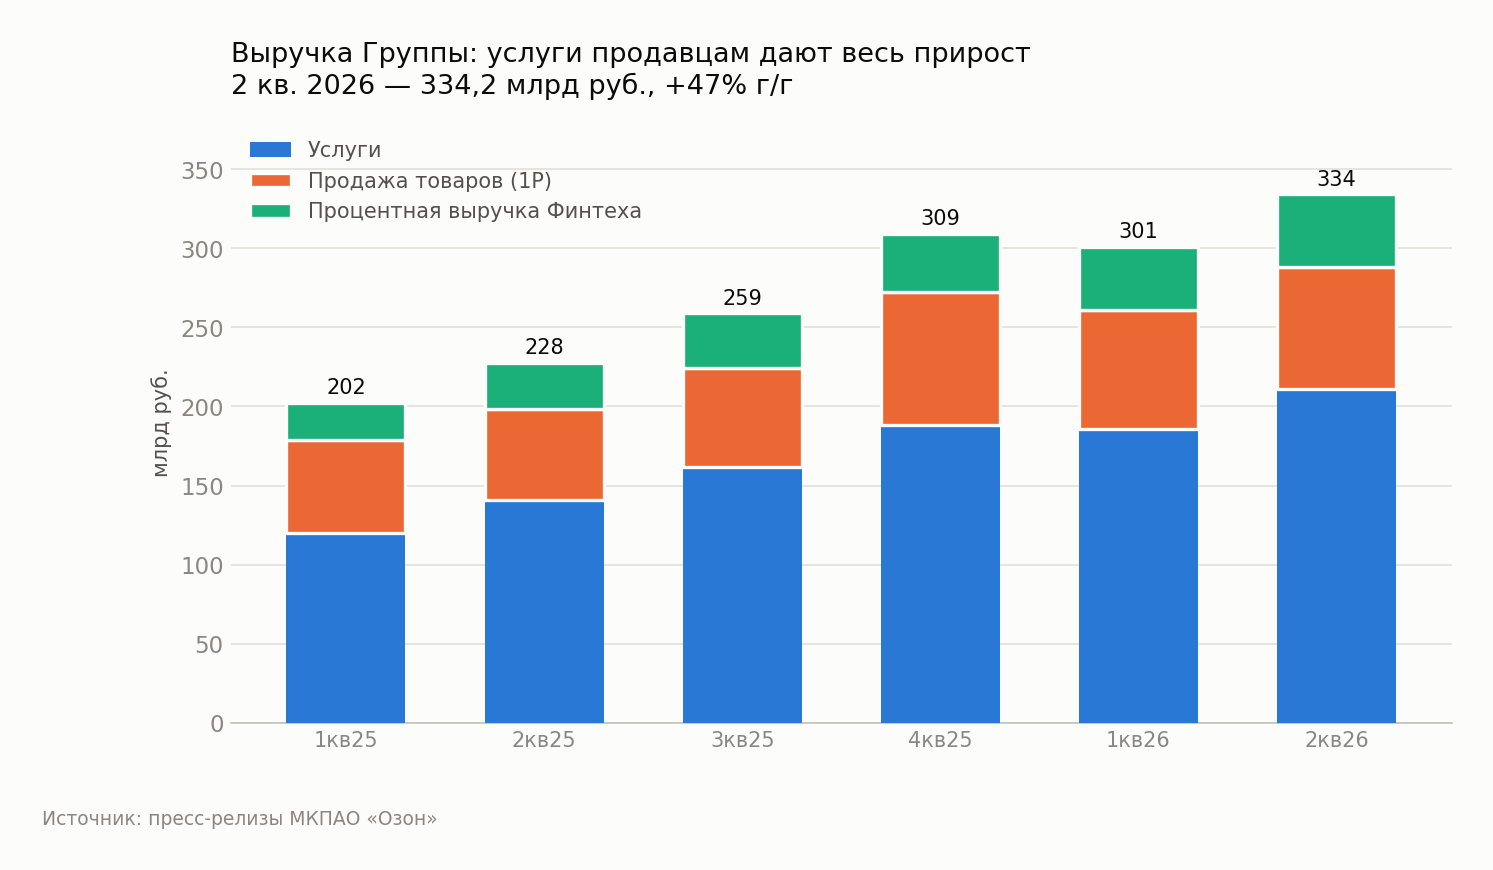
All of the revenue growth comes from services to sellers
Group revenue broke down as follows:
- Services – RUB 210.8 bn, +50% year on year. These are marketplace commissions, advertising, paid information services and logistics for sellers.
- Goods sales – RUB 77.7 bn, +35%. Ozon's own goods, with growth mainly from food.
- Fintech interest revenue – RUB 45.7 bn, +56%.
The key metric here is the take rate, i.e. how many kopecks of each ruble of turnover the company keeps for its services. It rose to 16.1% from 14.7% a year earlier. It is monetisation, not turnover itself, that drives the financial result.
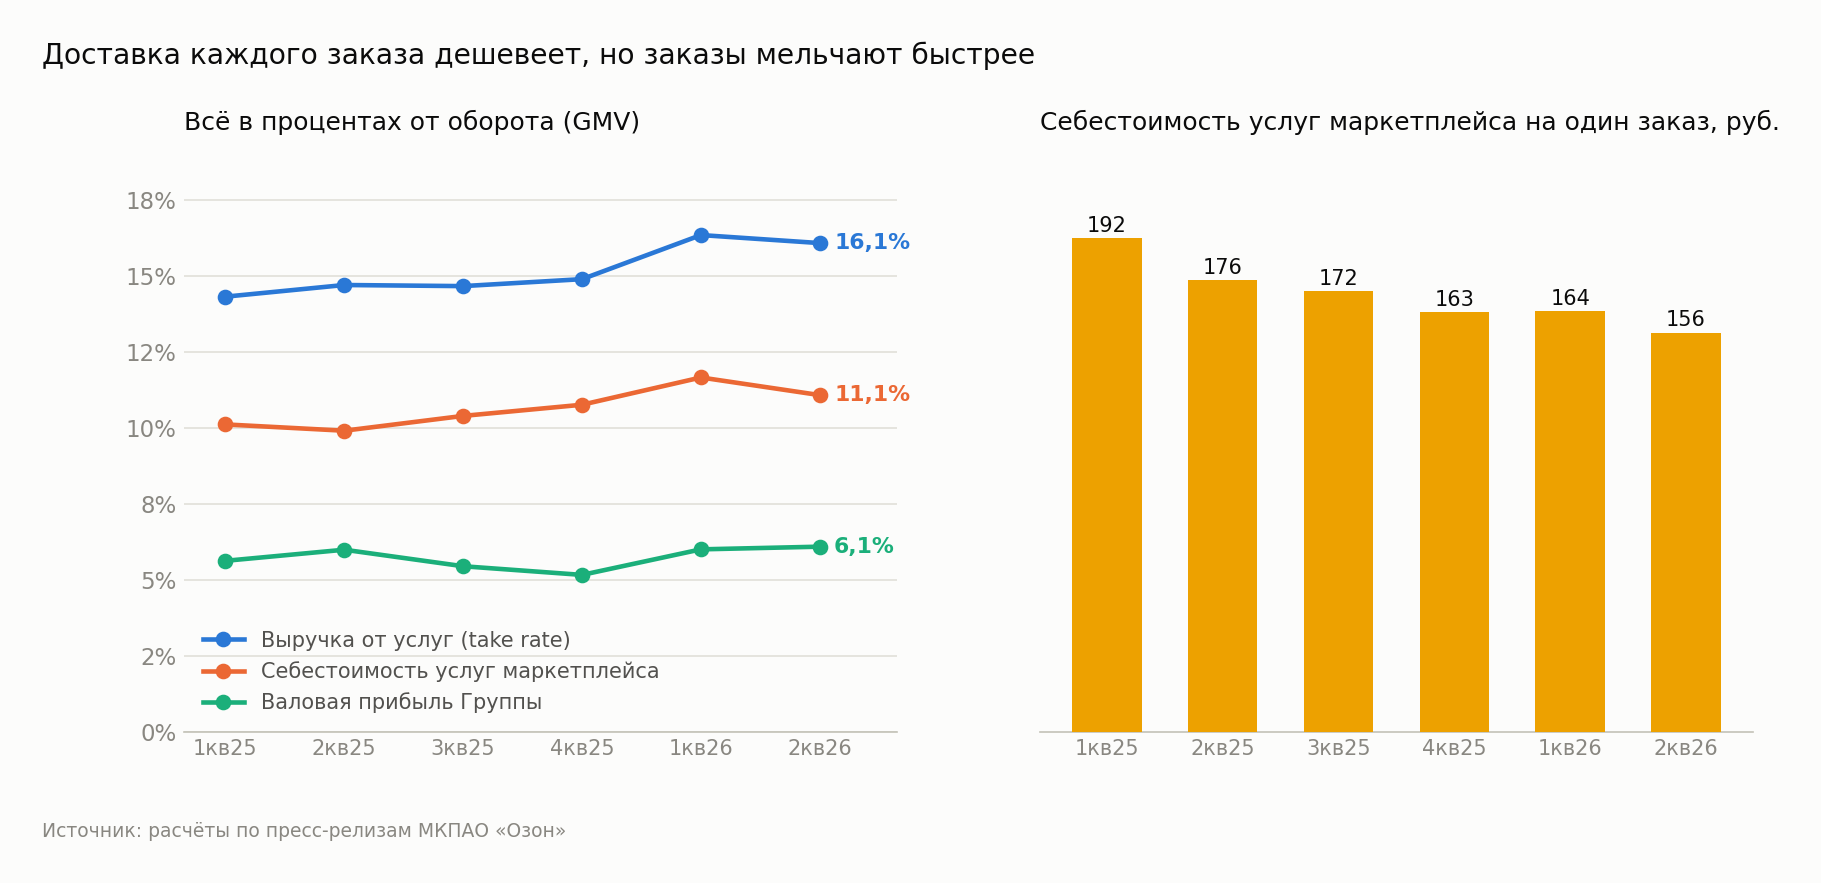
Delivering each order is getting cheaper, but orders are shrinking faster
The cost of marketplace services (fulfilment and delivery) grew 53% to RUB 145.3 bn – faster than turnover. Per order, by contrast, it fell 12% to RUB 156 thanks to warehouse automation.
Both facts are true at the same time, and there is no contradiction: Ozon has learned to process one order more cheaply, but orders have become so much smaller that, as a share of turnover, logistics has become more expensive – 11.1% versus 9.9% a year earlier. The rise in take rate offset this effect, and gross profit as a share of turnover barely changed: 6.1% versus 6.0%.
Operating expenses grew 31% to RUB 48.6 bn, i.e. slower than turnover, and fell to 3.7% of GMV from 3.9%. General and administrative expenses even declined 5%. Cost control is working.
EBITDA is a record, but its growth rate is slowing for a second quarter in a row
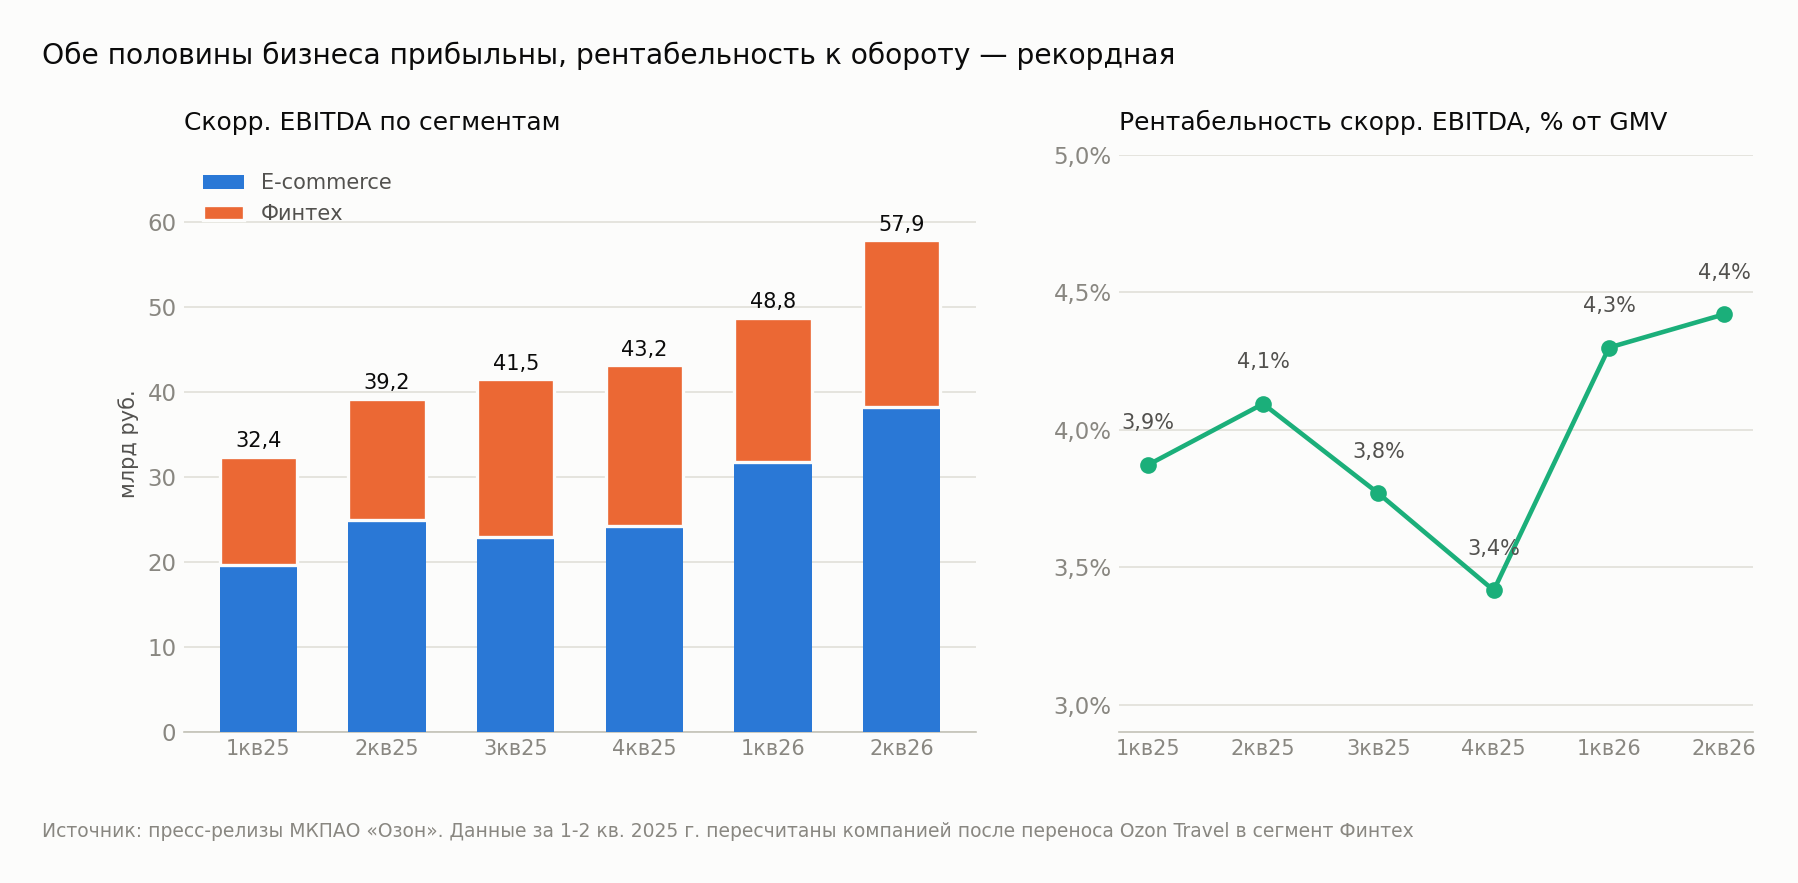
Adjusted EBITDA is RUB 57.9 bn, which is 4.4% of turnover, a record for the company (the previous record, 4.3%, was a quarter earlier). Growth was 48% versus 50% in 1Q2026.
- E-commerce – RUB 38.2 bn, +54%, margin 2.9% of turnover versus 2.6% a year earlier.
- Fintech – RUB 19.7 bn, +37%, pre-tax profit RUB 18.8 bn.
It is important to remember the definitions: in adjusted EBITDA the company excludes not only depreciation but also share-based employee compensation (RUB 2.7 bn for the quarter). If we count more simply – operating profit plus depreciation – we get RUB 55.2 bn and growth of 56% versus roughly 79% a quarter earlier. On this version the slowdown looks more pronounced.
Fintech is turning into a bond portfolio
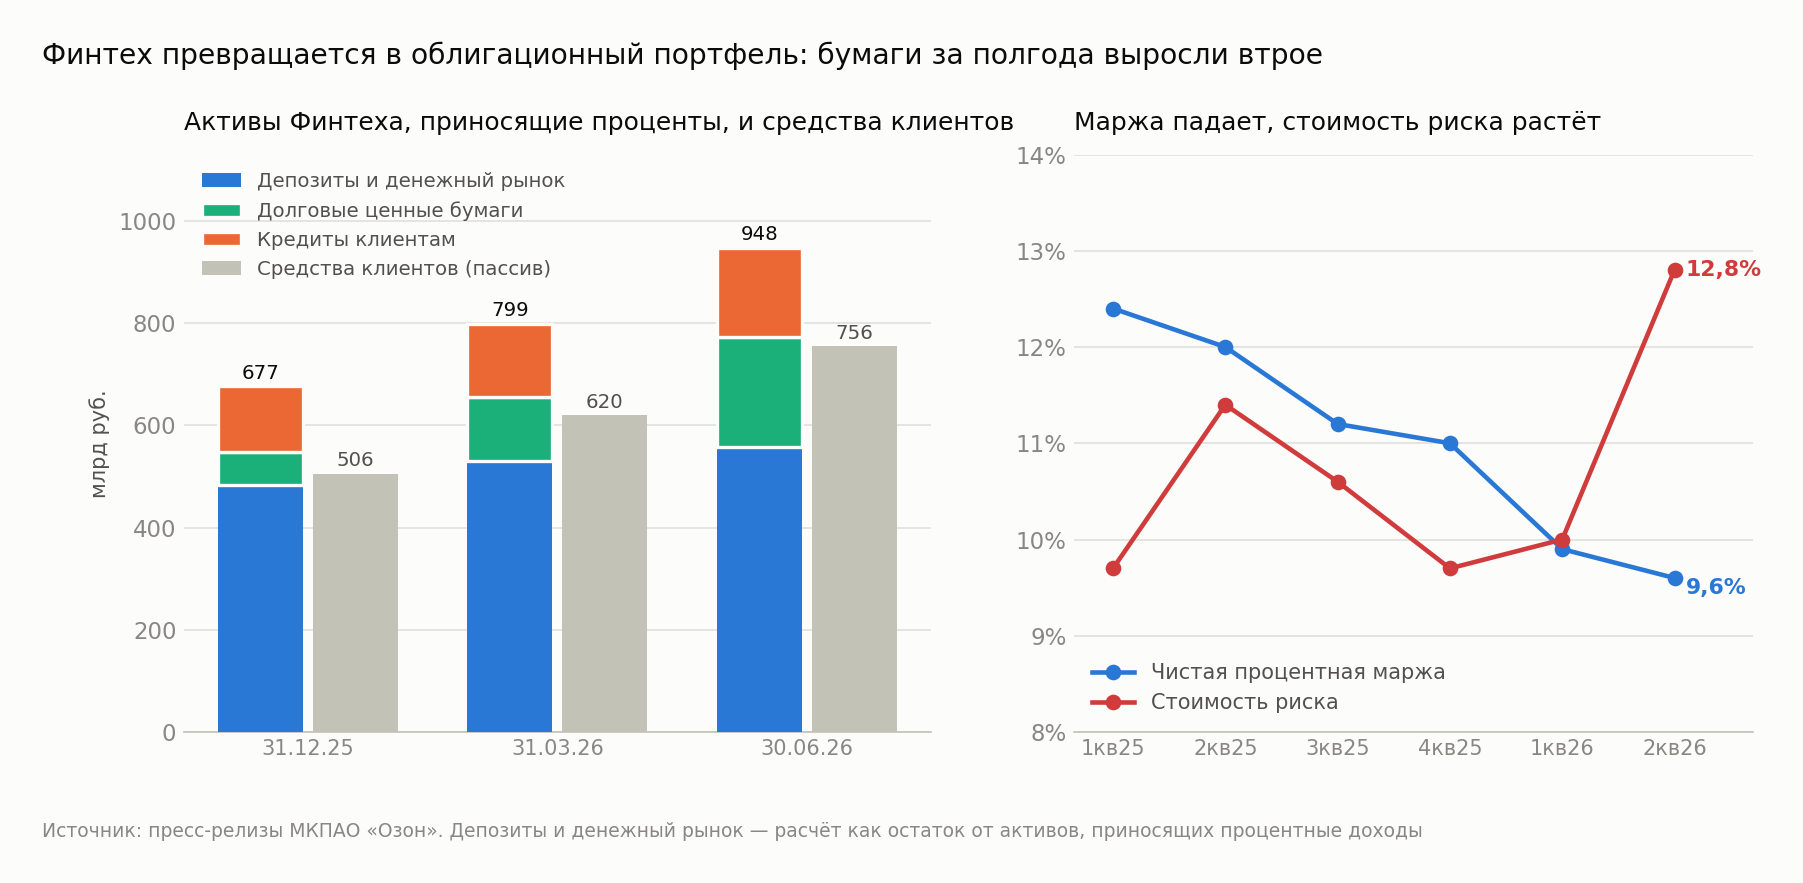
The banking part is growing very fast. Interest-earning assets added 19% in the quarter to RUB 947.8 bn; customer funds rose 22% to RUB 755.9 bn. Loans to customers grew 22% to RUB 175.7 bn.
But the asset structure is changing. Investments in debt securities (OFZ and corporate bonds) grew from RUB 64.7 bn at the end of 2025 to RUB 214.6 bn – threefold in half a year. In 2Q alone Fintech bought securities worth RUB 86.5 bn. Repo has also appeared: as of June 30, RUB 60.6 bn of securities were pledged under repurchase agreements versus RUB 5.5 bn three months earlier.
Hence the margin squeeze. Net interest margin (the difference between what the bank earns on assets and what it pays depositors, as a percentage of assets) fell 2.4 pp to 9.6%. This is not a quality problem but a change of mix: bonds and the money market yield less than loans, but also carry less risk.
At the same time, credit risk is getting more expensive. Cost of risk – the share of the loan portfolio that goes into loss provisions over a year – rose 1.4 pp to 12.8%, the highest in the last six quarters. Provision charges doubled: RUB 5.9 bn versus RUB 3.0 bn. The company explains this by a prudent approach that takes macro risks into account; coverage of problem loans by provisions even rose – 1.27x versus 1.25x at the end of March.
Bottom line for the segment: Fintech EBITDA is growing 34–37% versus triple-digit rates a year ago. That is still fast, but Fintech is no longer the group's former growth accelerator – now the marketplace provides the acceleration.
83% of the result is lost between EBITDA and net profit
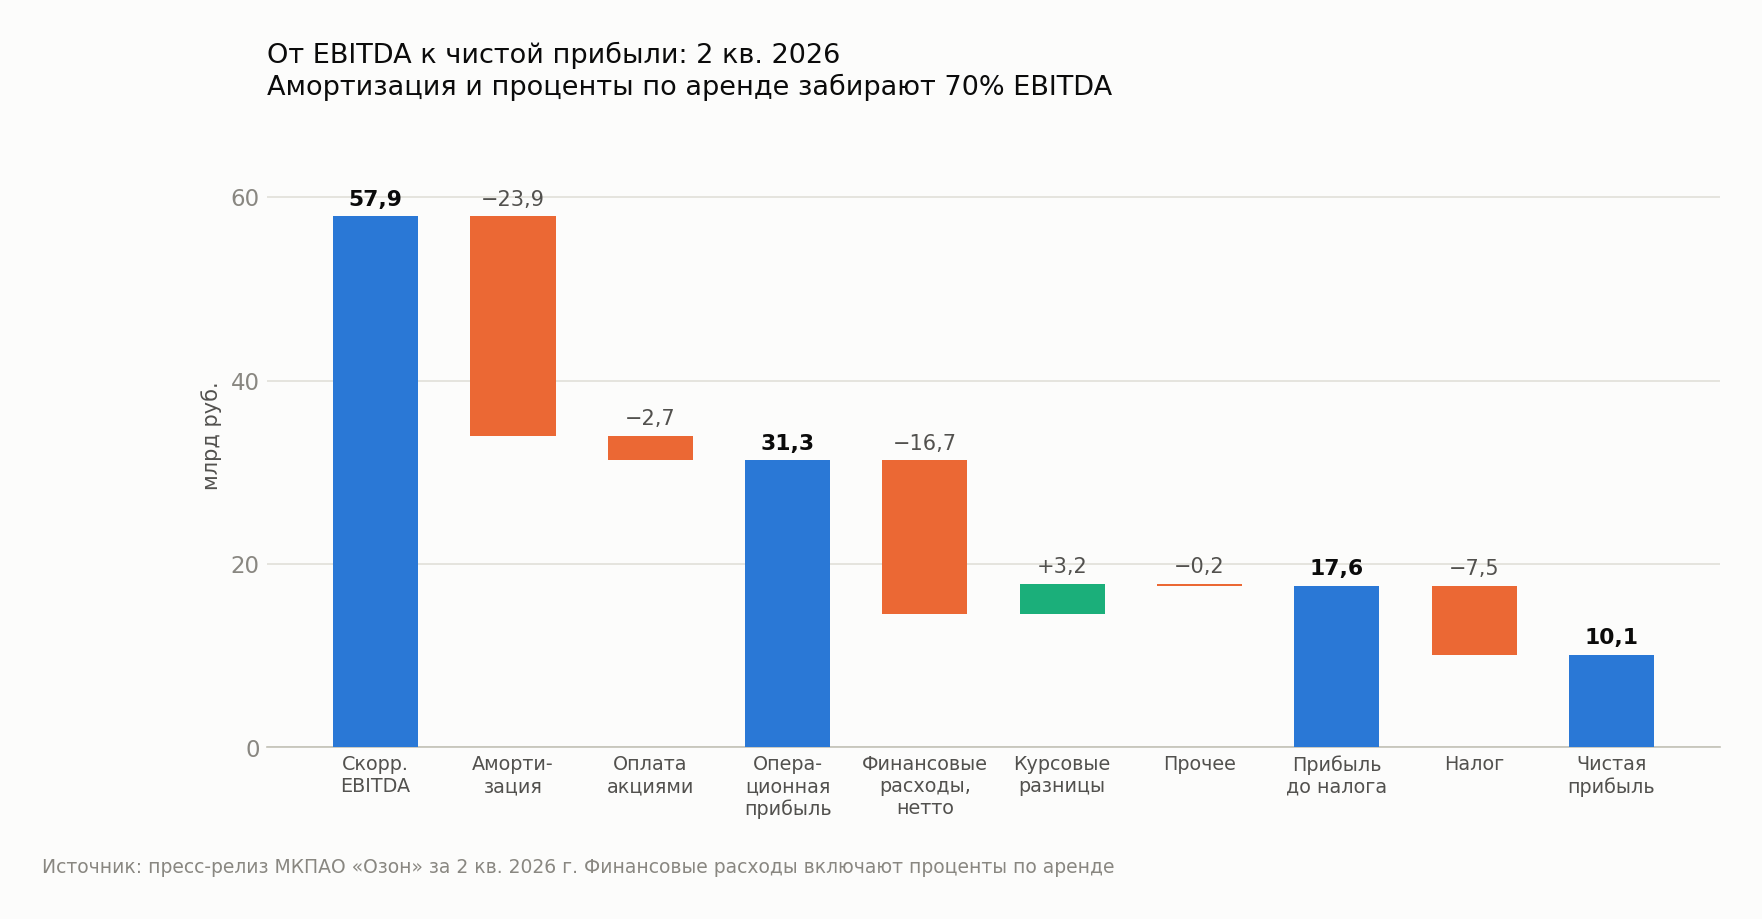
The path from RUB 57.9 bn of EBITDA to RUB 10.1 bn of net profit explains why Ozon's profit is still so modest:
- Depreciation – RUB 23.9 bn, +59% year on year. It is growing faster than revenue: the logistics network is mostly leased, and lease rights are amortised.
- Finance costs, net – RUB 16.7 bn. The main part, RUB 14.2 bn, is interest paid on leases (+45% year on year). Interest on ordinary loans, by contrast, fell sixfold to RUB 1.7 bn after early debt repayment.
- Foreign exchange gain – +RUB 3.2 bn versus RUB 0.5 bn a year earlier. Without it, pre-tax profit would have been RUB 14.3 bn instead of RUB 17.6 bn.
- Tax – RUB 7.5 bn, an effective rate of 42.5%. The reason is that the marketplace's losses and Fintech's profit are not fully offset against each other for tax purposes.
In other words, depreciation and lease interest take about 70% of EBITDA – the price of its own logistics, built on leased premises.
RUB 165 bn of operating cash flow is depositors' money, not the marketplace's
The Group's operating cash flow is RUB 164.8 bn, 8% less than a year earlier. This figure cannot be viewed as the result of trading: RUB 153.5 bn of it is an inflow of Fintech customer funds, i.e. depositors' money that the bank immediately places into loans and bonds.
The company discloses the marketplace's actual cash flow separately: RUB 38.5 bn for the quarter. Of this, capital expenditure is RUB 15.4 bn (+24%) and repayment of lease principal is RUB 7.5 bn. What remains went to shareholders: RUB 13.3 bn in dividends (the first payout for 2025, RUB 70 per share) and RUB 6.9 bn in share buybacks.
Investing outflow rose 3.7 times to RUB 101.1 bn, but that is not construction either: RUB 86.5 bn is Fintech's bond purchases. Capital expenditure rose by only RUB 2.9 bn.
Debt is 1.25 years of EBITDA, and almost all of it is leases
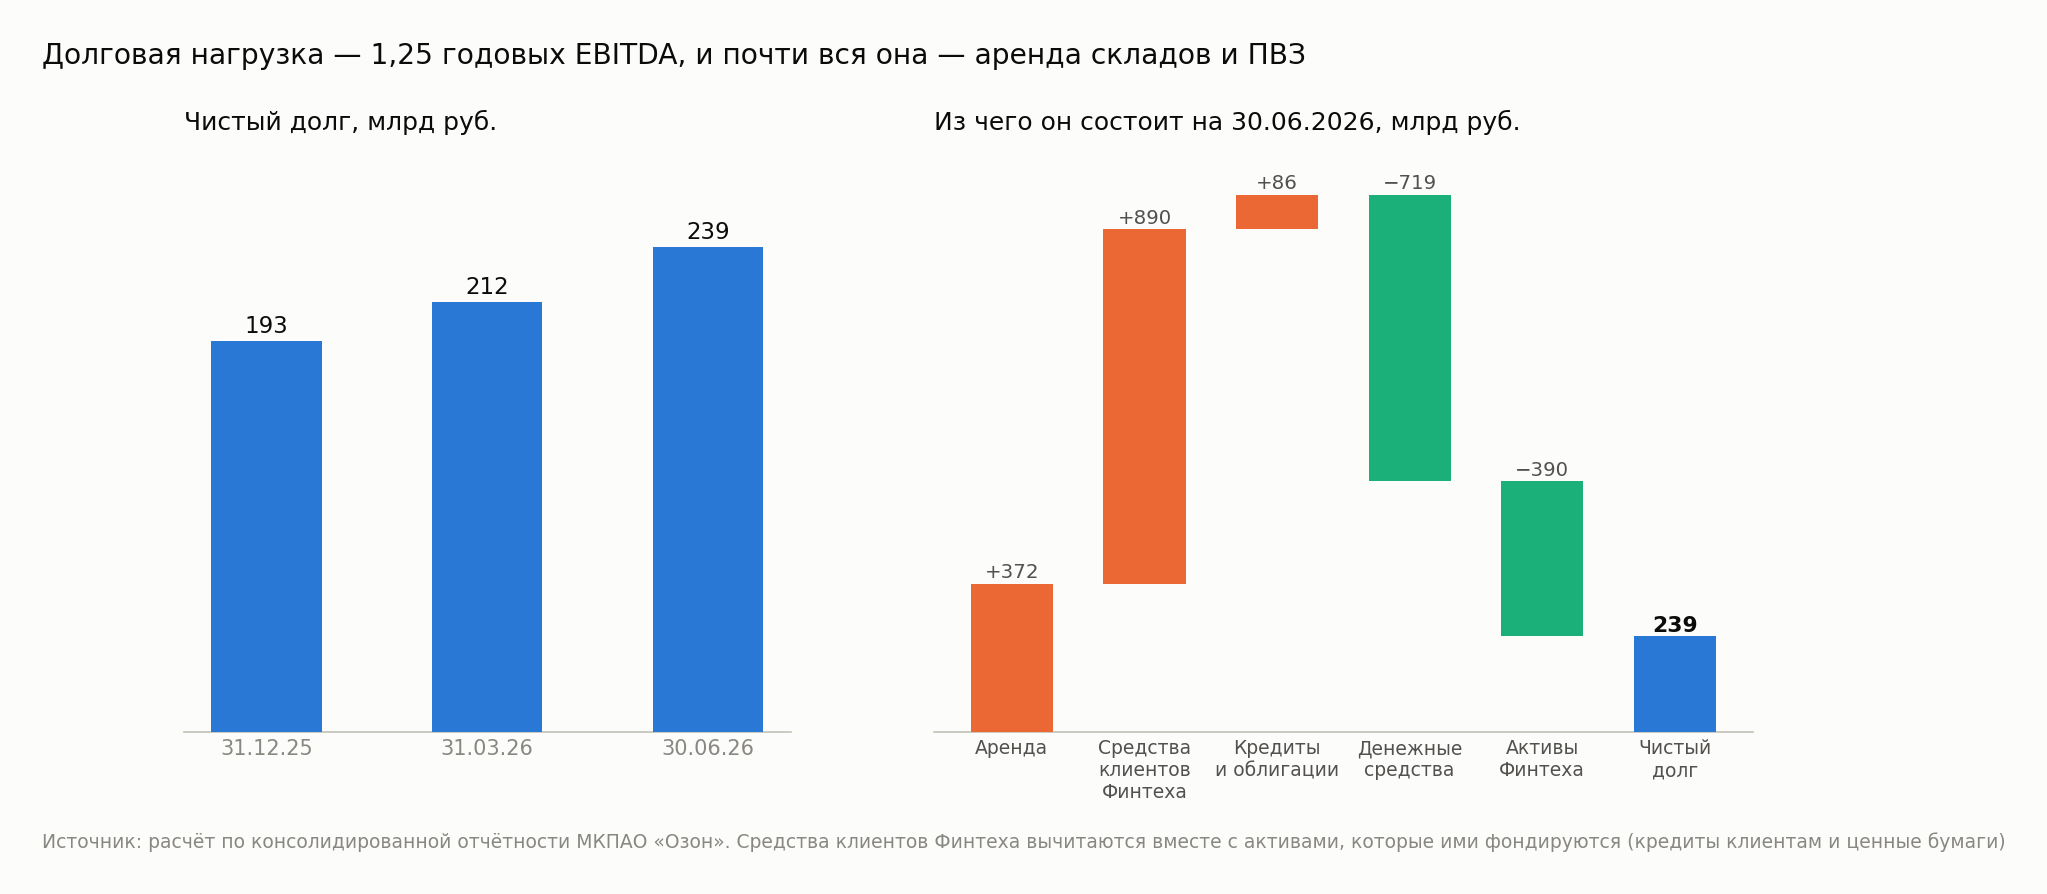
Net debt should properly be calculated symmetrically: lease liabilities plus loans and bonds plus Fintech customer funds, less cash, less Fintech customer loans and its securities portfolio. Otherwise customer money enters debt while the assets it funds do not, and the picture is distorted.
By this calculation, net debt as of June 30 is RUB 239.3 bn versus RUB 212.2 bn at the end of March and RUB 193.0 bn at the end of 2025. With last-12-month EBITDA of RUB 191.4 bn, this is 1.25x – a comfortable burden.
Structure matters more than the level: lease liabilities are RUB 372.0 bn, i.e. Ozon's debt is mostly warehouses, sorting centres and pickup points. Ordinary loans and bonds total only RUB 85.9 bn. In April the company placed a debut bond issue of RUB 15 bn at the key rate plus 2%; its credit rating is ruA from Expert RA.
Equity remains negative – minus RUB 154.0 bn. This is a consequence of losses accumulated over the years, not a sign of insolvency: with positive EBITDA and RUB 718.7 bn in accounts, liquidity is not an issue.
Full-year guidance is confirmed but not raised
The press release text has no guidance section – the company gave its 2026 targets in the results presentation, as of July 30, 2026: turnover +25-30% year on year, adjusted EBITDA of about RUB 200 bn, and a net profit for the year. These are the same figures given in February with the annual accounts.
The half-year actuals are running noticeably higher: turnover RUB 2,446.2 bn (+36%), EBITDA RUB 106.7 bn – already 53% of the annual target, net profit RUB 14.6 bn. In 2025 the second half accounted for 54% of annual EBITDA; with the same seasonality the year closes at around RUB 230 bn, i.e. about fifteen percent above the target.
The guidance comes with a caveat that was not there in February: it does not take into account the possible impact on the company's operations of drone attacks, the consequences of force majeure and changes in geopolitical or macroeconomic factors.
A year ago, in the 2Q2025 report, the company raised its guidance at this point. This time the targets are confirmed unchanged even though the half-year is running ahead – a conservative stance with a clearly outperforming plan.
Disclosure got shorter this time
The 2Q2026 metrics table dropped data that was in the first-quarter report: the number of active Fintech customers, purchase frequency, audience reach (MAU and DAU), and logistics infrastructure area. The number of Fintech customers is mentioned only in the company profile – 45 mn versus 34.4 mn a year earlier.
Advertising revenue has not been disclosed as a separate line since the 3Q2024 report, and the number of active sellers since 2025. The release itself ran to 19 pages versus 22 for the first quarter.
Risks added after the reporting date
On July 24, 2026, Ozon Bank was added to the EU's blocking sanctions list. The company states that the bank owns no assets and conducts no operations outside Russia, and that the sanctions do not extend to the group's other companies.
Separately, the release mentions a shortage of supply on the domestic fuel market since June 2026 due to disruptions at a number of refineries. The company does not see significant logistics disruptions, but for a business where transport is critical this is a cost factor. The same section names the risks of infrastructure damage from external impacts.
Valuation
At a price of RUB 2,924, market capitalisation is about RUB 638 bn, and including net debt the value of the business is roughly RUB 878 bn. Relative to last-12-month adjusted EBITDA (RUB 191.4 bn), this is about 4.6x.
Under our portal's methodology, where EBITDA is calculated as operating profit plus depreciation, the multiple is 5.1x against a historical median of 14.0x. On either version the company trades substantially cheaper than its own history.
Summary
Operationally the quarter is strong: a record in EBITDA and in margin to turnover, both halves of the business are profitable, market share is growing at an accelerating pace, costs are under control, and the company pays dividends and buys back shares.
The weak points are real too: earnings quality (a third of the increase came from exchange differences, effective tax rate 42.5%), a shrinking Fintech margin with a cost of risk of 12.8%, logistics getting more expensive relative to turnover because of the shrinking basket, and a cautious annual guidance that the company confirmed but did not raise despite running ahead of plan. In addition, the marketplace category is slowing according to SberIndex, which will limit market support in the second half.
Tickers
OZON – an extended card with the history of metrics and multiples on the Enhanced Investments portal.
See also: market overview · valuation map · stock screeners