Ozon Pharm: Q2 profit more than doubled, but margin alone did not do all the work
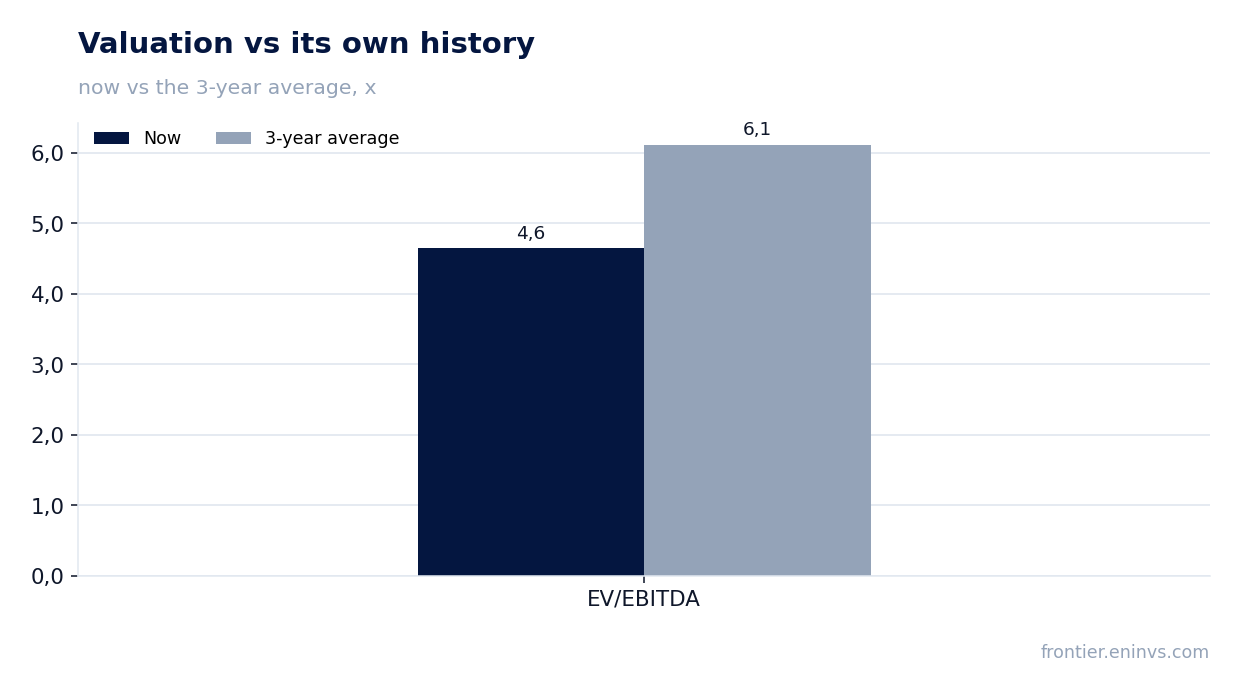
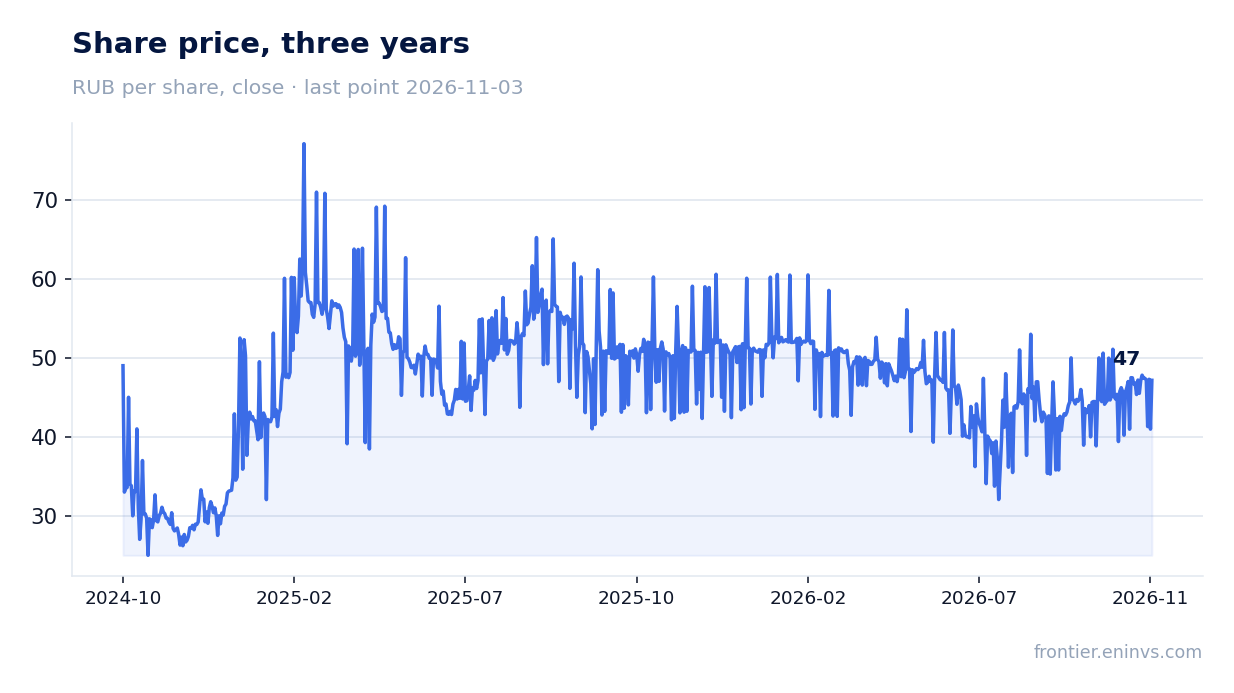
On 25 August Ozon Pharm released its Q2 2026 results. Revenue came in at RUB 7,410.2 mn (+15.6% YoY), EBITDA at RUB 2,733.9 mn (+34.5%), and net profit at RUB 1,623.6 mn (+125.8%). The EBITDA margin rose to 36.9% from 31.7% a year earlier, and the net margin to 21.9% from 11.2%. At an EV/EBITDA of 4.6 against its own three-year average of 6.1 and a dividend yield of 2.8%, the share looks attractive on price, though the payout remains low against the 7.0% we consider fair.
Key takeaways
— Revenue added 15.6%, but growth rests on price and mix rather than volume
— EBITDA rose 34.5% on revenue up 15.6% – the margin climbed to 36.9%
— Net profit more than doubled, and part of the gain came from financial expenses
— Operating cash flow of RUB 3,409.5 mn covered capex of RUB 1,160.4 mn with room to spare
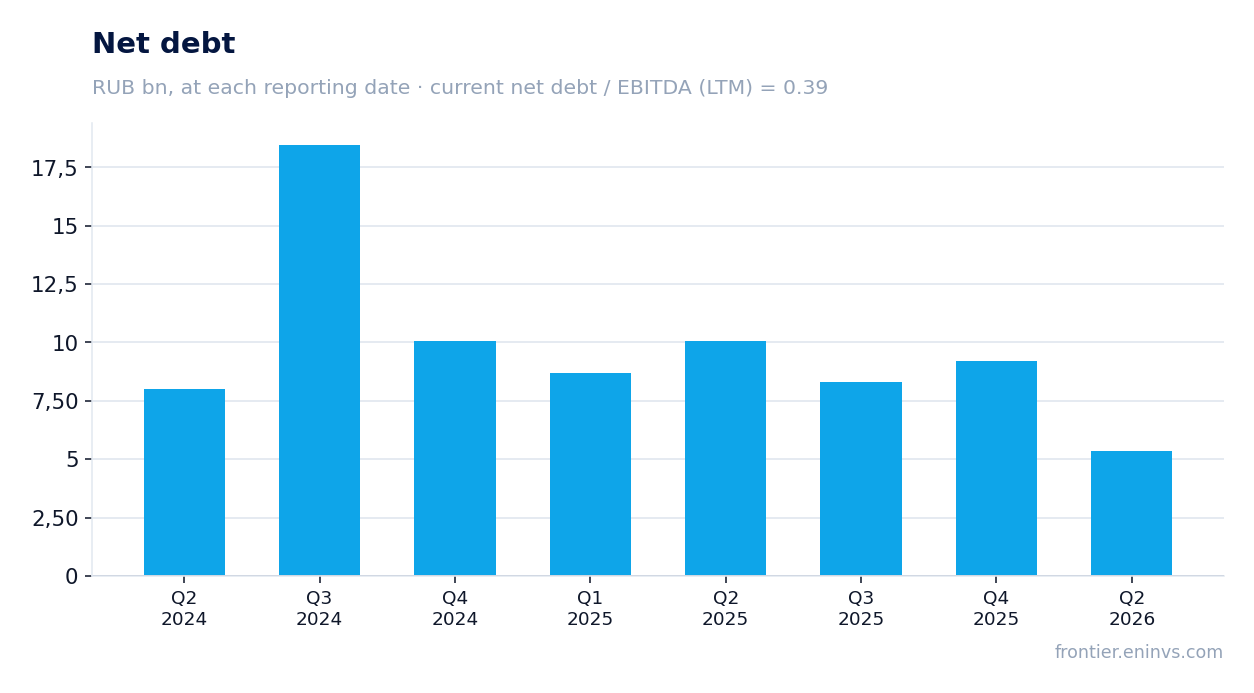
— Net debt fell from RUB 9.2 bn at end-2025 to RUB 5.4 bn on 30 June 2026
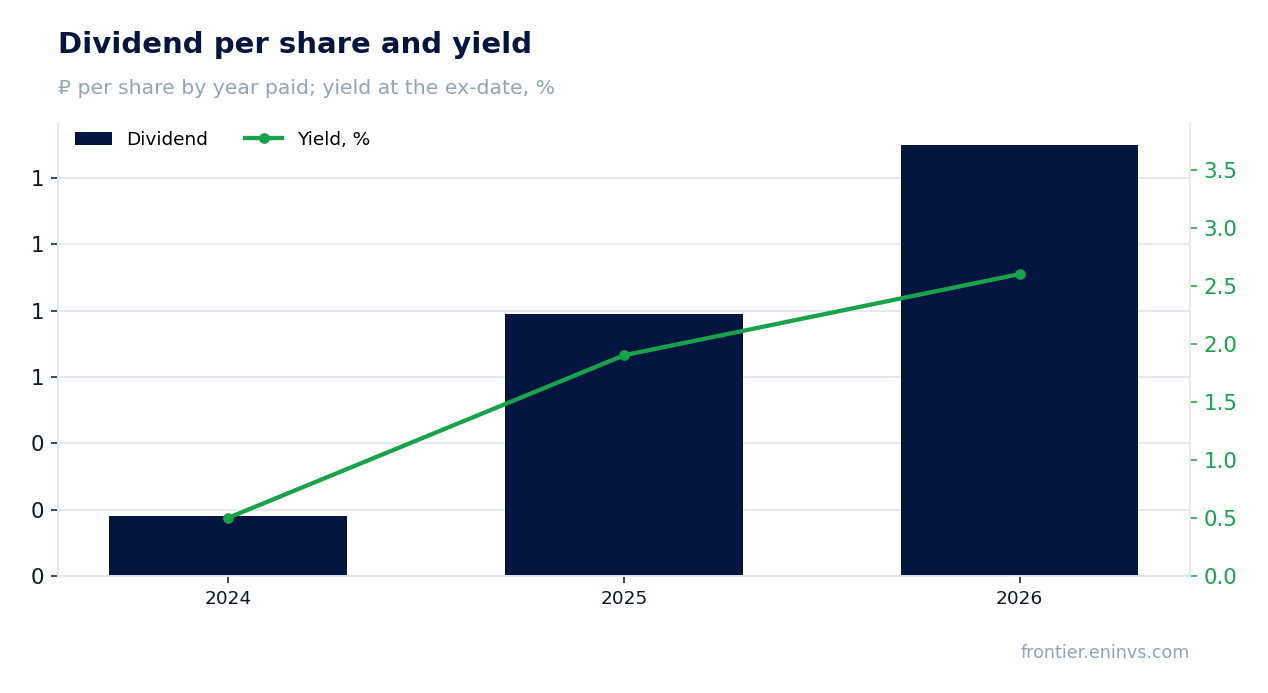
— The 2026 dividend is RUB 1.3 per share, a 2.8% yield against the 7.0% we consider fair
— EV/EBITDA of 4.6 is 24% below its own three-year average of 6.1
Attractiveness
Key figures, RUB bn
| Metric | Q2 2025 | Q2 2026 | Change |
|---|---|---|---|
| Revenue | 6.41 | 7.41 | +15.6% |
| EBITDA | 2.03 | 2.73 | +34.5% |
| Operating profit | 1.74 | 2.43 | +39.6% |
| Net profit | 0.72 | 1.62 | +125.8% |
| Operating cash flow | 2.34 | 3.41 | +45.6% |
| Capex | 0.99 | 1.16 | +17.2% |
| EBITDA margin | 31.7% | 36.9% | +5.2 pp |
| Net margin | 11.2% | 21.9% | +10.7 pp |
Revenue added 15.6%, but growth rests on price and mix rather than volume
Q2 2026 revenue came to RUB 7,410.2 mn, up 15.6% year on year. For comparison: growth was 45.2% in Q1 2025 and minus 4.2% in Q2 2025. The current 15.6% is a recovery from last year's slump, not an acceleration.
The company reports a single operating segment, so there is no product breakdown in the accounts. The commentary implies growth came mainly from price and sales mix rather than physical volume. Cost of sales for H1 2026 fell to RUB 7,403.5 mn from RUB 7,508.8 mn a year earlier – on revenue of RUB 14,821.2 mn versus RUB 13,264.0 mn. That drove gross profit up to RUB 7,417.7 mn.
For an investor, 15.6% revenue growth alongside falling cost of sales points either to an improved product mix or to one-off pricing effects. The next report will show whether the combination holds.
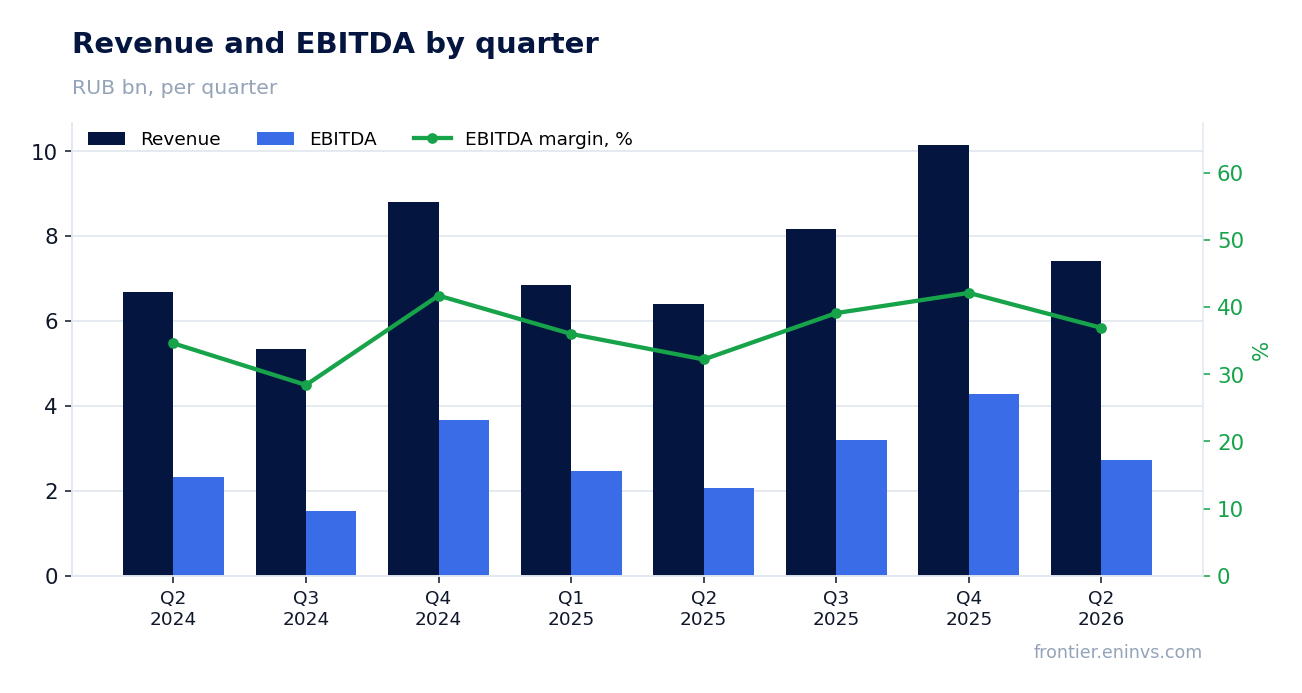
EBITDA rose 34.5% on revenue up 15.6% – the margin climbed to 36.9%
Q2 2026 EBITDA came to RUB 2,733.9 mn, up 34.5% year on year. The EBITDA margin rose to 36.9% from 31.7% a year earlier. Operating profit was RUB 2,430.1 mn on revenue of RUB 7,410.2 mn.
A margin gain on 15.6% revenue growth means costs grew slower than revenue. For H1 2026, general and administrative expenses were RUB 784.2 mn versus RUB 676.3 mn a year earlier, selling expenses RUB 1,312.4 mn versus RUB 1,157.9 mn, and R&D RUB 341.1 mn versus RUB 281.5 mn. All three lines rose, but their combined growth lags revenue growth.
Part of the margin improvement may stem from the reclassification of payroll costs that the company made in 2025 and applied retrospectively. That is not a one-off gain, but neither is it an organic improvement – the effect is already in the prior-year base.
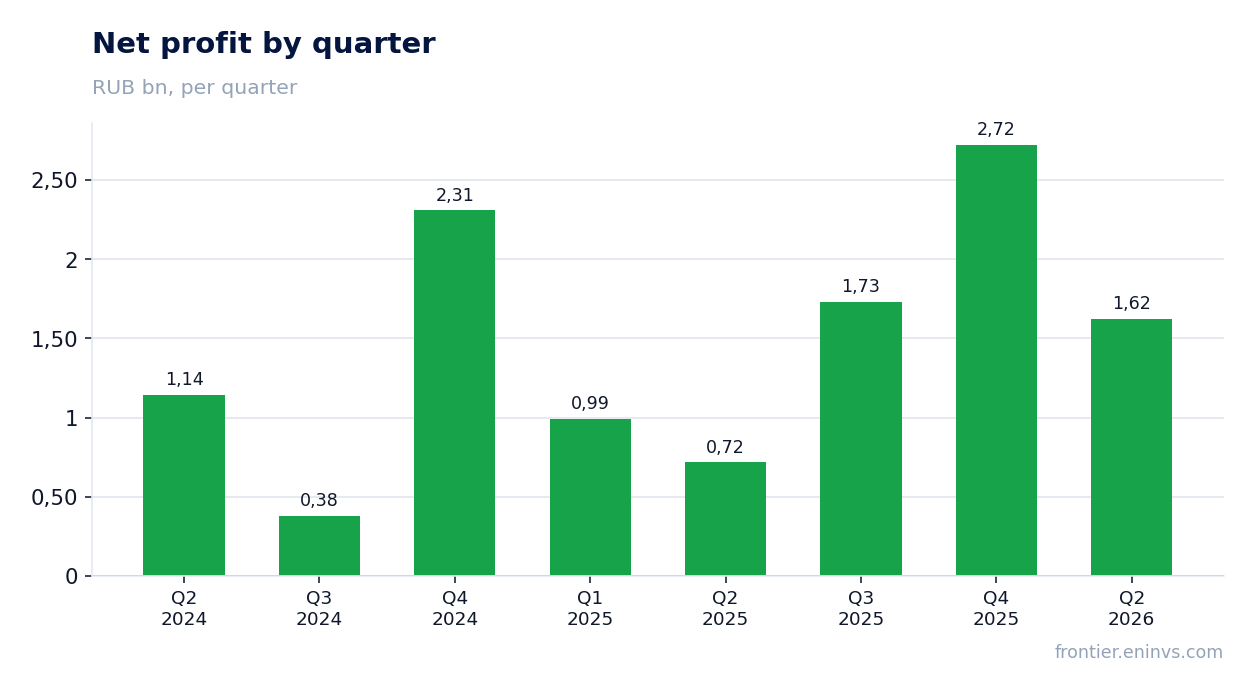
Net profit more than doubled, and part of the gain came from financial expenses
Q2 2026 net profit came to RUB 1,623.6 mn versus RUB 719.1 mn a year earlier – growth of 125.8%. The net margin rose to 21.9% from 11.2% a year earlier.
Profit growth of that size on 15.6% revenue growth and 34.5% EBITDA growth means something else happened below operating profit. For H1 2026, financial expenses were RUB 1,027.1 mn versus RUB 2,042.7 mn a year earlier – nearly halved. That is the main source of the outsized net profit growth: the company is paying less interest.
The fall in interest expense is consistent with lower debt: net debt on 30 June 2026 was RUB 5,350.2 mn versus RUB 9,185.8 mn at end-2025. Rates were also falling: the CBR key rate dropped from 16% at end-2025 to 14% in July 2026. Both factors – less debt and cheaper servicing – work in favour of profit, but the first is one-off in nature.
Operating cash flow of RUB 3,409.5 mn covered capex of RUB 1,160.4 mn with room to spare
Q2 2026 operating cash flow came to RUB 3,409.5 mn, capex to RUB 1,160.4 mn. Free cash flow was therefore positive and above RUB 2 bn for the quarter.
For H1 2026, operating cash flow was RUB 6,819.0 mn versus RUB 2,761.9 mn a year earlier. The increase came primarily from working capital release: receivables fell by RUB 3,239.9 mn and inventories by RUB 263.6 mn. That is a one-off source that will not repeat in the same volume in the next half-year.
Capex for the half-year was RUB 2,320.9 mn (property, plant and equipment RUB 1,052.6 mn and intangibles RUB 1,268.3 mn). Most of the PP&E spend is the plant under construction – spending on future growth rather than on maintaining current capacity. It weighs on free cash flow but not on operating profit.
Net debt fell from RUB 9.2 bn at end-2025 to RUB 5.4 bn on 30 June 2026
Net debt on 30 June 2026 was RUB 5,350.2 mn versus RUB 9,185.8 mn on 31 December 2025 – a reduction of RUB 3.8 bn. Over twelve months, from 30 June 2025, debt fell from RUB 10,043.6 mn to RUB 5,350.2 mn, or by RUB 4.7 bn.
The ratio of net debt to trailing-twelve-month EBITDA is 0.39. That is a low level for a manufacturing company and leaves room for manoeuvre. Interest paid on loans and borrowings in H1 2026 was RUB 729.6 mn versus RUB 1,371.9 mn a year earlier.
The debt reduction was financed by operating cash flow and working capital release. That is a one-off source, and the same inflow should not be expected in the next half-year. Still, the current debt level is not a constraint on either dividends or capex.
The 2026 dividend is RUB 1.3 per share, a 2.8% yield against the 7.0% we consider fair
Over the last twelve months the company paid RUB 1.3 per share, a yield of 2.8% on the current price. Our model estimates the annual dividend at the same RUB 1.3 per share, giving a forward yield of 2.8%. We consider 7.0% a fair yield for this name.
The payment history is rising: RUB 0.18 per share for 2024, RUB 0.79 for 2025 and RUB 1.3 for 2026. But the yield remains low: 0.5% in 2024, 1.9% in 2025 and 2.6% in 2026 at the ex-date price. The CBR key rate is 14.0%, and the share's dividend yield falls well short of it.
Our dividend estimate rests on a payout of 0.12 of profit and a profit base of RUB 6,494.0 mn. If profit comes in lower, or the company directs more funds to the plant under construction, the payment could be smaller. Dividend policy and the board's decision are the main factors to watch.
EV/EBITDA of 4.6 is 24% below its own three-year average of 6.1
The trailing-twelve-month EV/EBITDA multiple is 4.6 against its own three-year average of 6.1. The share trades 24% below its historical valuation. The trailing P/E is 7.1.
On the portal's model, which compares EBITDA growth with a target multiple, the upside to fair value is +32%. That is our own estimate, not a market consensus or a target price.
The share is held in the portal's live model strategies – RU Growth-potential (quality). That is a fact, not an argument for the verdict: membership is determined by the strategy's own screen.
Valuation on the latest reported figures
| Metric | Value |
|---|---|
| Market cap | 54.7 bn ₽ |
| P/E (LTM) | 7.1 |
| EV/EBITDA (LTM) | 4.6 |
| P/B | 1.65 |
| Net debt / EBITDA (LTM) | 0.39 |
| Operating cash flow (LTM) | 7.31 bn |
| ROE | 18.0% |
| Dividend yield (12m) | 2.8% |
| EV/EBITDA, 3-year average | 6.1 |
Dividend per share, ₽, and yield at the ex-date
| Year paid | Dividend | Yield |
|---|---|---|
| 2024 | 0.18 | 0.5% |
| 2025 | 0.79 | 1.9% |
| 2026 | 1.30 | 2.6% |
Bottom line
What was genuinely strong in Q2 was everything above operating profit: revenue up 15.6%, EBITDA up 34.5%, a 36.9% margin. But net profit more than doubled mainly on lower financial expenses and a one-off working capital release. Debt fell to RUB 5.4 bn, with net debt/EBITDA at 0.39, giving the company room. The key question for a holder is the dividend: a 2.8% yield against the 7.0% we consider fair, with the key rate at 14.0%, means the share is interesting on price, not on payout. On price it is attractive: EV/EBITDA of 4.6 against its own three-year average of 6.1 and +32% upside on the portal's model.
Open the company's financial profile OZPH →
See also: market overview · valuation map · stock screeners