PIK Group: profit halved, debt up RUB 46.3bn – but EBITDA grew

On August 25, PIK Group released its results for the first half of 2026. Revenue fell 11.6% year-on-year, net profit dropped 54.1%, but EBITDA rose 4.5% and the EBITDA margin expanded from 13.0% to 15.4%. This review looks at what drove EBITDA growth, why profit declined, and how it affected leverage and valuation.
Key takeaways
— EBITDA grew 4.5% despite falling revenue – margin expanded from 13.0% to 15.4%
— Net profit fell 54.1% – net margin contracted from 9.8% to 5.1%
— Debt rose RUB 46.3bn over the half-year, but fell RUB 4.3bn over 12 months
— Operating cash flow for the last 12 months is negative – minus RUB 66.2bn
— No dividends paid, model expects zero payouts – at a fair yield of 12%
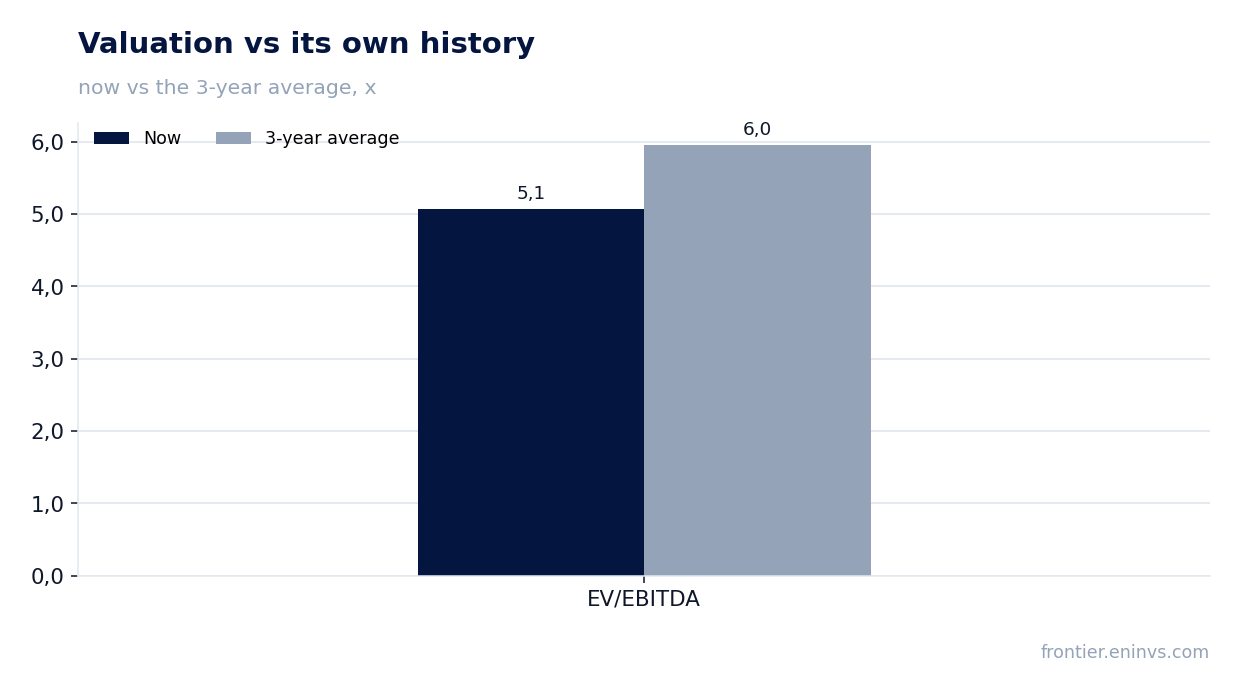
— Shares trade at a discount to their own history: EV/EBITDA 5.1 vs 3-year average 6.0
Key figures, RUB bn
| Metric | H1 2025 | H1 2026 | Change |
|---|---|---|---|
| Revenue | 328 | 290 | -11.6% |
| EBITDA | 42.6 | 44.5 | +4.5% |
| Operating profit | 38.9 | 40.9 | +5.0% |
| Net profit | 32.0 | 14.7 | -54.1% |
| Operating cash flow | -97.5 | -121 | — |
| Capex | 4.00 | 6.68 | +66.8% |
| EBITDA margin | 13.0% | 15.4% | +2.4 pp |
| Net margin | 9.8% | 5.1% | -4.7 pp |
EBITDA grew 4.5% despite falling revenue – margin expanded from 13.0% to 15.4%
In the first half of 2026, PIK Group's revenue fell 11.6% year-on-year, to RUB 731.3bn over the last 12 months. However, EBITDA for the reporting period grew 4.5%, and the EBITDA margin rose from 13.0% to 15.4% – meaning the company earns more on every ruble of sales despite shrinking revenue.
Margin expansion on a falling top line usually implies that cost of sales or commercial expenses declined faster than revenue. The report does not disclose the cost structure, but the fact remains: operating efficiency improved, and this is the main positive of the half-year.
Net profit fell 54.1% – net margin contracted from 9.8% to 5.1%
Net profit for the first half of 2026 was RUB 51.5bn over the last 12 months, but in the reporting period it fell 54.1% year-on-year. The net margin contracted from 9.8% to 5.1% – meaning the company now earns half as much net on every ruble of revenue.
The decline in profit despite growing EBITDA points to an increase in items below the operating line – likely interest expenses or taxes. The exact reasons are not disclosed in the report, but the gap between EBITDA and net profit widened, and this is a key question for shareholders.
Debt rose RUB 46.3bn over the half-year, but fell RUB 4.3bn over 12 months
Net debt at the latest balance sheet date stood at RUB 463.4bn. It increased by RUB 46.3bn over the half-year, but decreased by RUB 4.3bn over the last 12 months – meaning the debt growth occurred specifically in Q2 2026.
The net debt to EBITDA ratio for the last 12 months is 2.79. This is a level, not a trend: comparison with the previous year is not possible as the earlier value is unknown. Nevertheless, with negative operating cash flow, leverage remains elevated.
Operating cash flow for the last 12 months is negative – minus RUB 66.2bn
Over the last 12 months, operating cash flow was minus RUB 66.2bn. This means that core operations do not generate cash, but rather require financing – which explains the debt growth in Q2.
Negative operating cash flow with positive EBITDA is a typical picture for a developer with large inventories and contract deferrals, but the scale of the minus is significant. The question is when the company will be able to convert profit into cash – without that, dividends and debt reduction are in question.
No dividends paid, model expects zero payouts – at a fair yield of 12%
Over the last 12 months, PIK Group paid no dividends, and the model estimate for the next period also assumes zero per share. At the same time, the fair yield for this name in our model is 12%, which implies a payout ratio of 0.12 of profit.
Zero payouts with negative operating cash flow look logical: there is simply no money for dividends. However, if the company does not start paying, shareholders receive no compensation for risk, and this weighs on valuation.
Shares trade at a discount to their own history: EV/EBITDA 5.1 vs 3-year average 6.0
EV/EBITDA for the last 12 months is 5.1, below the three-year average of 6.0. That is, the market values the company cheaper than on average over the past three years, despite EBITDA growth.
P/E for the last 12 months is 7.4, ROE is 7.0%. The discount to history may be justified by falling profit and negative cash flow, but it also creates potential for share price growth if the company shows improved conversion of profit into cash.
Valuation on the latest reported figures
| Metric | Value |
|---|---|
| Market cap | 380 bn ₽ |
| P/E (LTM) | 7.4 |
| EV/EBITDA (LTM) | 5.1 |
| P/B | 0.92 |
| Net debt / EBITDA (LTM) | 2.79 |
| Operating cash flow (LTM) | -66.2 bn |
| ROE | 7.0% |
| EV/EBITDA, 3-year average | 6.0 |
Bottom line
The strength of the report was EBITDA growth of 4.5% and margin expansion to 15.4% – the company improved operating efficiency. However, net profit halved, operating cash flow is negative, and debt rose by RUB 46.3bn over the half-year. Shares trade at a discount to their own history, but without improved cash flow and resumed dividends, this discount may persist. The key question for a holder is when profit will start turning into cash.
Open the company's financial profile PIKK →
See also: market overview · valuation map · stock screeners