Rusagro: second-quarter profit all but vanished, and the dividend does not rest on it
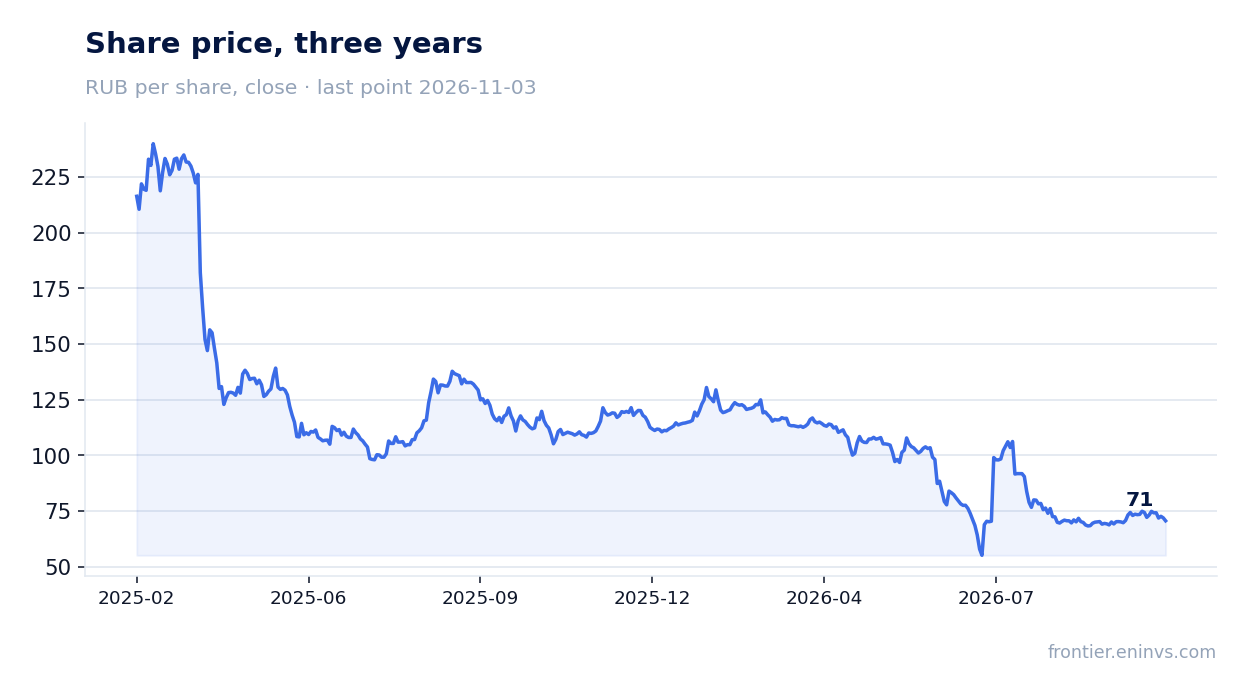
On 28 August Rusagro reported second-quarter 2026 results: revenue of RUB 91.5 bn, EBITDA of RUB 6.9 bn at a 7.5% margin, and net profit of RUB 27.9 mn at a 0.0% margin. Profit was eaten by interest expense and weak biological-asset revaluation rather than by operating weakness as such. At RUB 76.06 the stock trades at 4.7x EV/EBITDA LTM against its own three-year average of 4.4x, i.e. above its own history, while the 23.5% dividend yield is above the 23.3% we consider fair – a neutral verdict.
Key takeaways
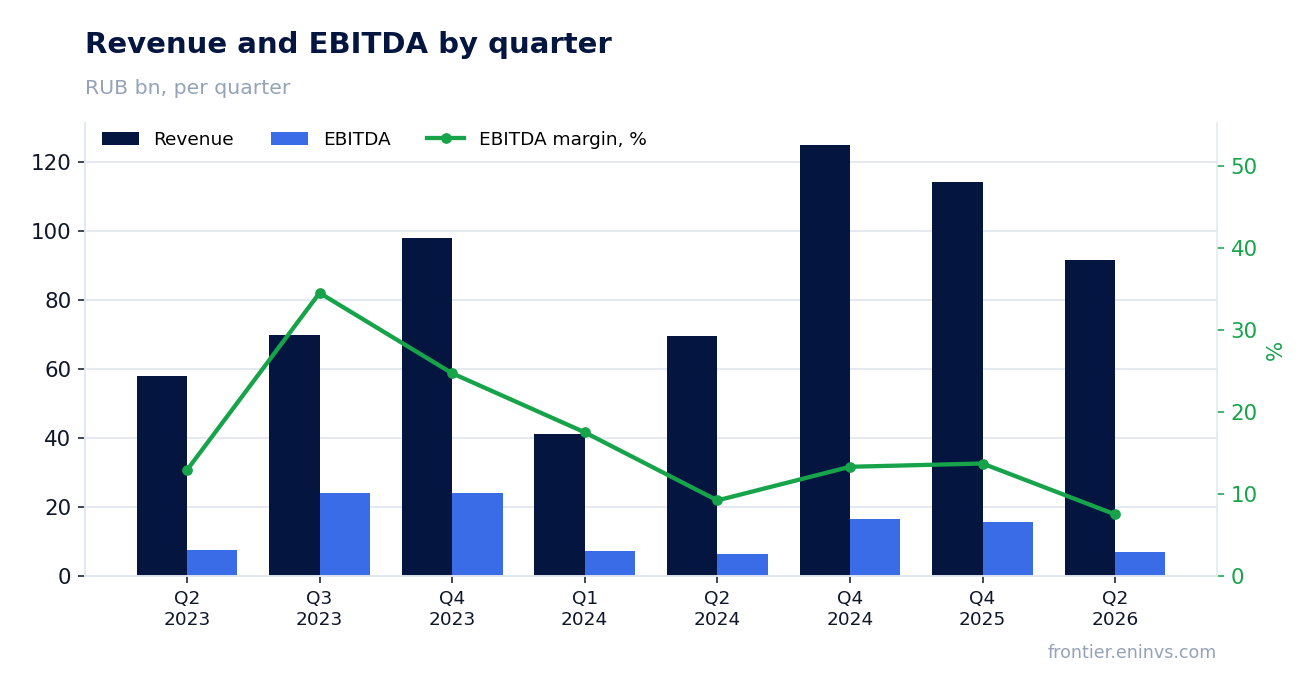
— Second-quarter revenue of RUB 91.5 bn came with a 7.5% EBITDA margin, and that is not enough to cover interest
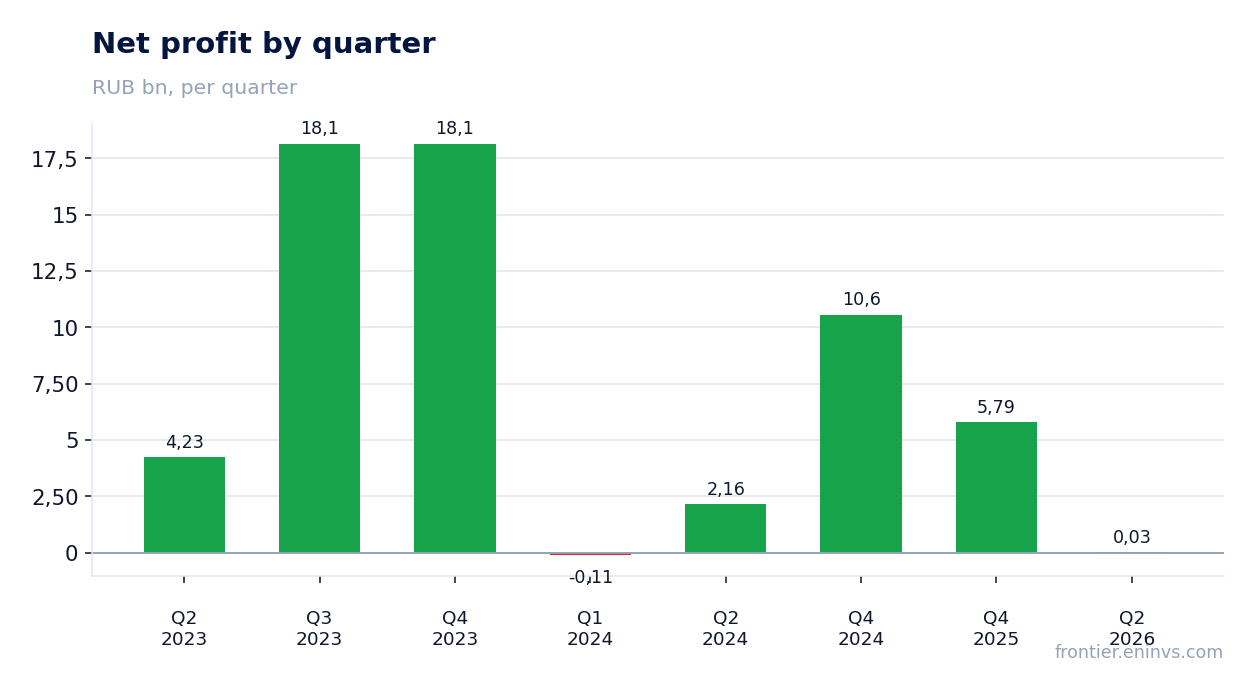
— Net profit of RUB 27.9 mn is effectively zero because RUB 8.6 bn of half-year interest expense consumed operating profit
— Biological-asset revaluation contributed only RUB 3.0 bn in the half-year versus RUB 8.9 bn a year earlier
— Net debt of RUB 173.7 bn at 30 June equals 3.15x EBITDA LTM, and servicing it costs more than the business earns
— The RUB 16.48 per share paid over the last 12 months yields 23.5% – above the 14.0% key rate and above the 23.3% we consider fair
— The 4.7x EV/EBITDA LTM multiple is 8% above its own three-year average of 4.4x – the stock is more expensive than its own history
— Free cash flow is positive, but the dividend model is capped by FCF rather than by profit
Attractiveness
Key figures, RUB bn
| Metric | — | Q2 2026 | Change |
|---|---|---|---|
| Revenue | — | 91.5 | — |
| EBITDA | — | 6.89 | — |
| Operating profit | — | 3.45 | — |
| Net profit | — | 0.03 | — |
| Operating cash flow | — | 16.4 | — |
| Capex | — | 4.12 | — |
| EBITDA margin | — | 7.5% | — |
| Net margin | — | 0.0% | — |
Second-quarter revenue of RUB 91.5 bn came with a 7.5% EBITDA margin, and that is not enough to cover interest
In the second quarter of 2026 Rusagro booked revenue of RUB 91.5 bn and EBITDA of RUB 6.9 bn, a 7.5% margin. Operating profit for the quarter was RUB 3.4 bn, already a third of the interest expense accumulated in the half-year.
For the first half revenue reached RUB 183.0 bn against RUB 167.8 bn a year earlier, but gross profit fell to RUB 24.5 bn from RUB 37.0 bn. The cause is cost of sales: RUB 161.5 bn versus RUB 139.7 bn, while biological-asset and agricultural-produce revaluation contributed only RUB 3.0 bn against RUB 8.9 bn a year earlier.
Selling expenses fell to RUB 12.5 bn from RUB 13.8 bn, administrative costs rose to RUB 8.6 bn from RUB 8.3 bn, and other operating items swung to a RUB 3.5 bn gain from a RUB 3.7 bn loss. These movements supported EBITDA but did not change the picture: a 7.5% margin leaves too little for interest payments.
Net profit of RUB 27.9 mn is effectively zero because RUB 8.6 bn of half-year interest expense consumed operating profit
Second-quarter net profit was RUB 27.9 mn at a 0.0% margin. For the half-year the group posted a pre-tax loss of RUB 197.9 mn, and only a RUB 253.8 mn tax income brought the total to a symbolic RUB 55.9 mn profit.
The key line is interest expense: RUB 8.6 bn in the half-year against RUB 9.5 bn a year earlier. Interest income fell to RUB 2.3 bn from RUB 5.3 bn, while other financial expenses shrank to RUB 0.8 bn from RUB 2.7 bn. The net financial result is minus RUB 7.1 bn, comparable to the half-year operating profit of RUB 6.9 bn.
Profit attributable to shareholders of PAO Gruppa Rusagro was negative for the half-year – minus RUB 1.4 bn against plus RUB 5.6 bn a year earlier. The positive group result came from the RUB 1.5 bn non-controlling interest, i.e. minority profit in the oils and fats segment.
Biological-asset revaluation contributed only RUB 3.0 bn in the half-year versus RUB 8.9 bn a year earlier
Net gain from revaluation of biological assets and agricultural produce for the six months was RUB 3.0 bn against RUB 8.9 bn a year earlier. Of that, RUB 2.8 bn came from initial recognition and fair-value changes, and RUB 0.2 bn from disposals.
The cause is prices. The average forward wheat price at 30 June 2026 was RUB 11,787 per tonne against RUB 15,091 a year earlier, barley – 13,743 versus 16,378, sunflower – 29,771 versus 33,118. Sugar beet was almost unchanged – 4,550 versus 4,558.
For commercial pigs the price rose to RUB 117.8 per kilogram from RUB 112 at end-2025, but that did not offset the decline in crop farming. Revaluation is a non-cash item, yet in prior periods it supplied a large part of accounting profit, and its compression explains why net profit almost vanished while the operating business kept running.
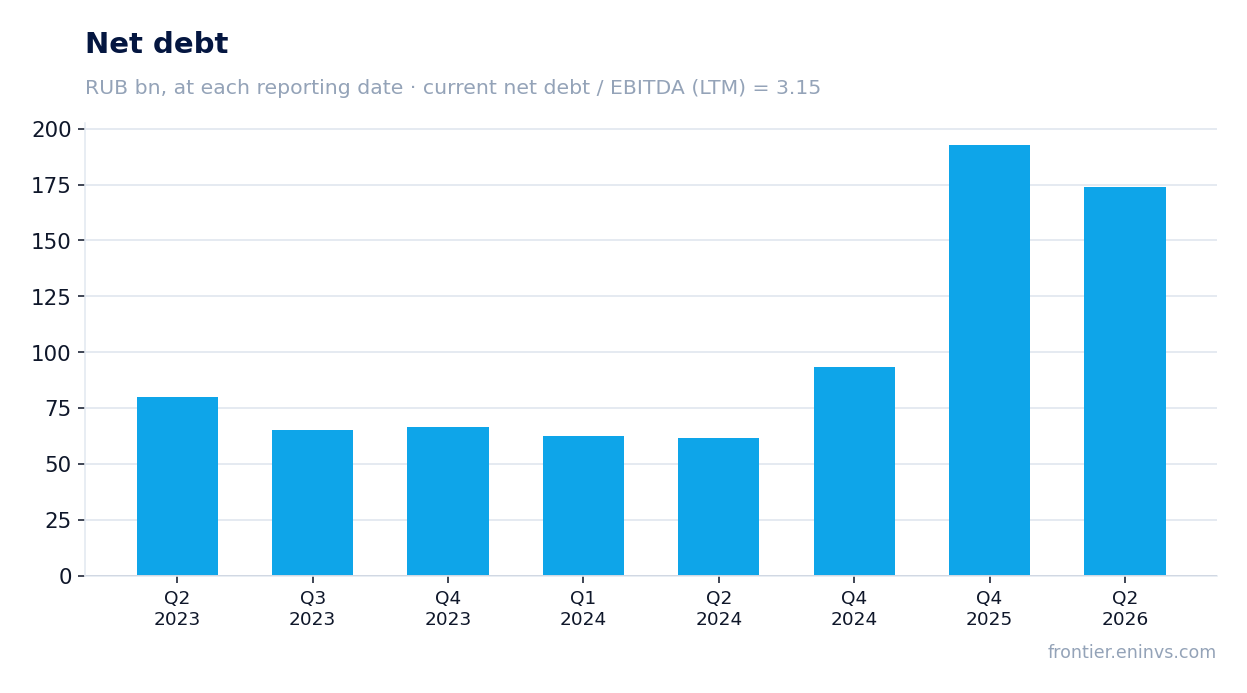
Net debt of RUB 173.7 bn at 30 June equals 3.15x EBITDA LTM, and servicing it costs more than the business earns
Net debt at 30 June 2026 was RUB 173.7 bn against RUB 192.9 bn at 31 December 2025, a decrease of RUB 19.1 bn in six months. Over 12 months debt rose: from RUB 107.9 bn at 30 June 2025 to RUB 173.7 bn, plus RUB 65.9 bn.
The ratio of net debt to EBITDA LTM is 3.15x. Half-year interest expense of RUB 8.6 bn against EBITDA LTM of RUB 55.1 bn means debt servicing absorbs about a sixth of annual EBITDA. That is not critical, but it leaves little room if operating profit falls.
Operating cash flow in the half-year was strong – RUB 32.9 bn against RUB 4.2 bn a year earlier, mainly on working-capital release: receivables fell by RUB 20.7 bn and inventories by RUB 20.3 bn. That inflow allowed the debt reduction, but it does not repeat every quarter.
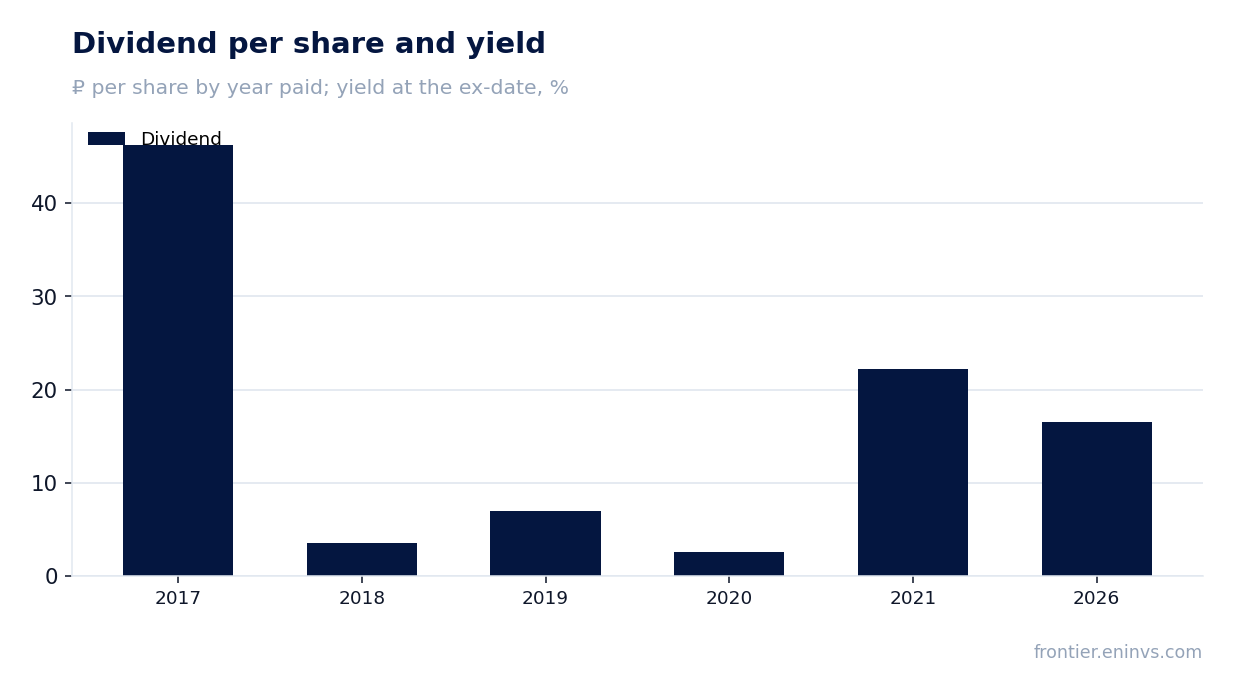
The RUB 16.48 per share paid over the last 12 months yields 23.5% – above the 14.0% key rate and above the 23.3% we consider fair
Over the last 12 months Rusagro paid RUB 16.48 per share, which at RUB 76.06 gives a yield of 23.5%. By calendar year of payment, 2026 shows RUB 16.48 per share at a 15.5% yield on the ex-date price of RUB 106.18.
Our estimate of the annual dividend under the canonical model is RUB 0.0 per share, i.e. the model does not assume a forward payment. The reason is the free-cash-flow cap: the model computes the dividend from profit at a 0.44 payout ratio, but the FCF constraint binds. With a profit base of RUB 15.2 bn and a price of RUB 71.0, the modelled yield is zero.
The 23.5% yield is above the 14.0% key rate and slightly above the 23.3% we consider fair. That means the market already prices in a generous payout, but its sustainability is in question: LTM profit of RUB 15.2 bn against net debt of RUB 173.7 bn and half-year interest expense of RUB 8.6 bn leaves little free cash.
The payout would shrink if profit stays at zero and capital expenditure – RUB 4.1 bn in the quarter – requires funding. The board has not yet decided, and our model does not assume a forward payment.
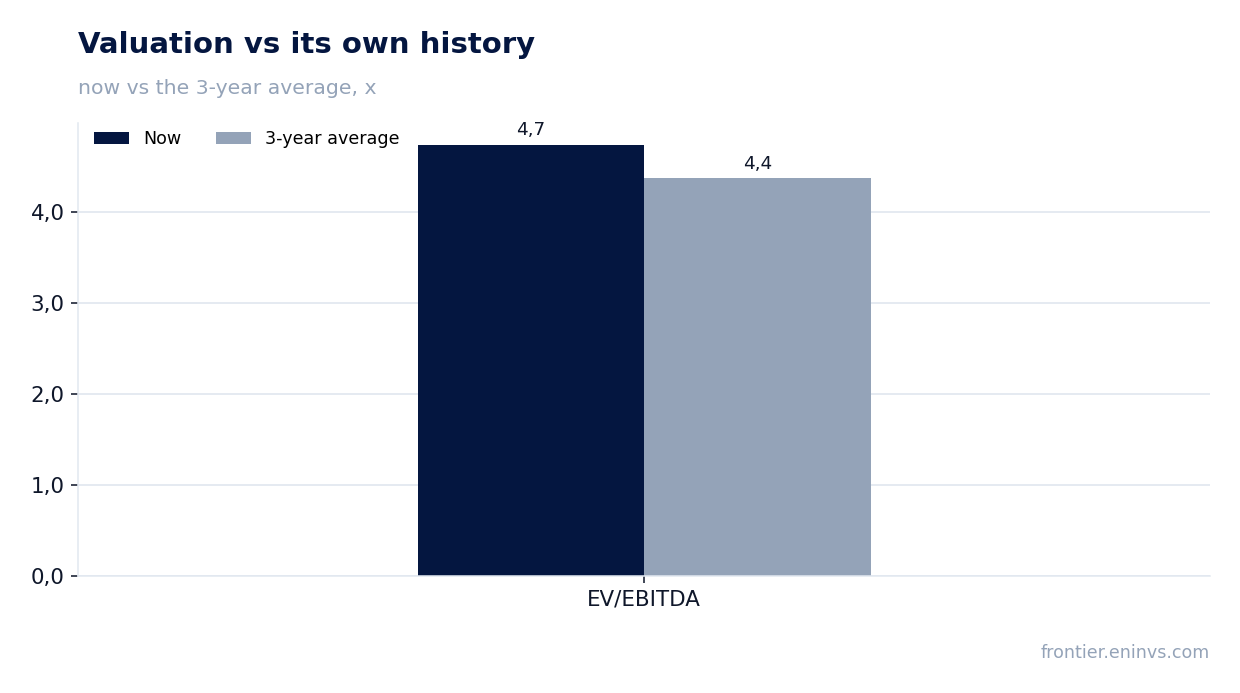
The 4.7x EV/EBITDA LTM multiple is 8% above its own three-year average of 4.4x – the stock is more expensive than its own history
EV/EBITDA LTM stands at 4.7x against its own three-year average of 4.4x, i.e. 8% above. The stock trades above its own history despite near-zero profit and a weak EBITDA margin.
P/E LTM is 4.48x, which looks cheap, but that is a consequence of the low LTM profit base of RUB 15.2 bn rather than of sustainable earnings. With second-quarter net profit of RUB 27.9 mn, the annual figure rests on prior periods and should not be expected to repeat.
Market capitalisation is RUB 68.1 bn, which with net debt of RUB 173.7 bn gives an enterprise value of about RUB 241.8 bn. Against EBITDA LTM of RUB 55.1 bn that produces the 4.7x multiple. For a stock with a 7.5% margin and 3.15x EBITDA leverage, that level does not look depressed.
Free cash flow is positive, but the dividend model is capped by FCF rather than by profit
Second-quarter operating cash flow was RUB 16.4 bn and capital expenditure RUB 4.1 bn, so free cash flow was positive. For the half-year capex was RUB 7.9 bn against RUB 13.9 bn a year earlier – the company cut investment.
Yet the dividend model is capped by FCF rather than by profit. A 0.44 payout on a RUB 15.2 bn profit base would give about RUB 6.7 bn, but free cash flow after interest and capex does not allow that to be paid without new debt.
Lower capex is positive for cash flow, but it also means the company is not expanding capacity. In the next report it is worth watching whether positive free cash flow holds at current agricultural prices and interest expense.
Valuation on the latest reported figures
| Metric | Value |
|---|---|
| Market cap | 68.1 bn ₽ |
| P/E (LTM) | 4.5 |
| EV/EBITDA (LTM) | 4.7 |
| P/B | 0.26 |
| Net debt / EBITDA (LTM) | 3.15 |
| Operating cash flow (LTM) | 19.2 bn |
| ROE | 0.0% |
| Dividend yield (12m) | 23.5% |
| EV/EBITDA, 3-year average | 4.4 |
Dividend per share, ₽, and yield at the ex-date
| Year paid | Dividend | Yield |
|---|---|---|
| 2017 | 46.27 | — |
| 2018 | 3.49 | — |
| 2019 | 6.95 | — |
| 2020 | 2.60 | — |
| 2021 | 22.22 | — |
| 2026 | 16.48 | 15.5% |
Bottom line
The report's strength was cash flow: RUB 32.9 bn from operations in the half-year and a RUB 19.1 bn debt reduction to RUB 173.7 bn. But profit almost vanished – RUB 27.9 mn in the quarter – because interest expense and weak biological-asset revaluation consumed the operating result. The RUB 16.48 per share dividend at a 23.5% yield looks generous, but our model does not assume a forward payment because of the free-cash-flow cap. The stock trades at 4.7x EV/EBITDA LTM against its own 4.4x average, i.e. above its own history. The verdict is neutral: the yield is attractive, but the sustainability of profit and dividend is in question.
Open the company's financial profile RAGR →
See also: market overview · valuation map · stock screeners