Share is moving from Wildberries to Ozon: what four independent measures show
Once a month, Enhanced Investments hosts Investment MasterMind: several fund managers and analysts each defend one idea, and the room votes by show of hands. At the meeting on September 11, [Ilya Vorobyov](https://t.me/StrategyGuy) defended a long position in Ozon – the idea collected 15 votes and took second place. The argument was that the market had underestimated the shift in e-commerce after part of a competitor's warehouses went offline. [Notes from the whole meeting](https://telegra.ph/Mastermind-1109-09-11) and the [recording](https://youtu.be/ON8O8tefrdA) have been published.
Following up on that discussion, we decided to test the idea's key assumption against independent data: is share really moving from Wildberries to Ozon, how visible is it right now, and how much of it is reversible. Here is what we found.
Brief context for those who have not followed the topic. Wildberries and Ozon together hold about two thirds of Russian online retail. In recent years both platforms grew so fast that the question of a redistribution of the market between them hardly arose; there was enough for everyone. In 2026 the market grew half as fast as a year earlier, and on July 18 drone strikes on Wildberries warehouses began.
Share is moving, and two different processes are mixed together: a slow structural shift and a sharp drop after the strikes on warehouses.
The structural part has run all year and was moderate. Turnover of Ozon in the first half grew 36% while the market grew 18.7%. The platform was gaining share even before any external events.
The acute part began on July 18 and is measured in tens of percent. By various estimates, from 8% of Wildberries' warehouse capacity (Kommersant's calculation) to 17% (Forbes' estimate) went offline. For sellers trading on both platforms at once, revenue on Wildberries fell 10.9% in a month, while orders on Ozon rose 11.4%.
Website traffic confirms the same picture, with a one-month lag. Until July the two sites grew almost in step. In August visits to wildberries.ru fell 12.9%, while ozon.ru rose 1.8%.
At the same time, the whole channel cooled, not just Wildberries. Russians' spending on marketplaces grew 28.4% a year until mid-July and slowed to 13.6% by mid-September, while spending across all categories barely changed. So part of the money that Wildberries lost went to no one.
By the end of the third quarter Ozon's share will rise by roughly 4-6 percentage points year on year. Only 1-2 points of that come from the strikes on a competitor's warehouses; the rest is the usual trend.
We find the idea promising ahead of the third-quarter report, and we hold Ozon shares in our portfolio. Four years of EBITDA, with EBITDA growing 49% in the half-year, plus a rising market share. This combination is rare. The risk is external and cannot be hedged: warehouses get hit, and now so do Ozon's own.
Ozon captured more than half of the whole market's growth in the half-year
Internet retail in Russia in the first half of 2026 totalled RUB 7.2 trillion, 18.7% more than a year earlier, according to the Association of Internet Trade Companies (AKIT). That means the market added roughly RUB 1.13 trillion over the year.
Ozon's turnover over the same half-year was RUB 2.45 trillion, up 36%. Turnover here means the total value of everything sold through the platform, including third-party sellers' goods; the company itself earns only a commission on that amount. In rubles, Ozon's increment was about RUB 0.65 trillion.
Ozon alone provided 58% of the market's entire growth while accounting for about a third of it. The remaining RUB 0.48 trillion is shared among Wildberries, grocery delivery, classic online retail and Yandex Market, which implies growth of about 11%. Food delivery and Yandex Market grow faster than the market and absorb this remainder almost entirely. That leaves Wildberries, the market's largest player, with growth in the low single digits.
It is impossible to be more precise, for a simple reason: Wildberries is a private company and discloses its turnover once a year, by press release. For 2025 it was RUB 6.1 trillion, and the next figure will appear only in spring. External agencies' share estimates differ by a factor of two: Infoline gives Wildberries 35% of the market and Ozon 28%, Euler gives 45% and 32%. A 10 percentage point range is the limit of the precision available today.
A methodological caveat: Ozon's turnover includes services and covers Kazakhstan, Belarus and Armenia, while AKIT counts only Russian retail. The perimeters do not match, so the direction here is reliable, but the exact magnitude is not.
In August the traffic of the two sites diverged by 14.7 percentage points
SimilarWeb estimates website traffic from a user panel and shows, on its free pages, the three-month total and month-on-month changes. From these two figures the monthly series can be reconstructed unambiguously. Below are monthly visits in millions, wildberries.ru first, ozon.ru second.
| Month | wildberries.ru | ozon.ru |
|---|---|---|
| May | 106.8 | 192.9 |
| June | 103.8 | 191.3 |
| July | 108.9 | 202.9 |
| August | 94.8 | 206.5 |
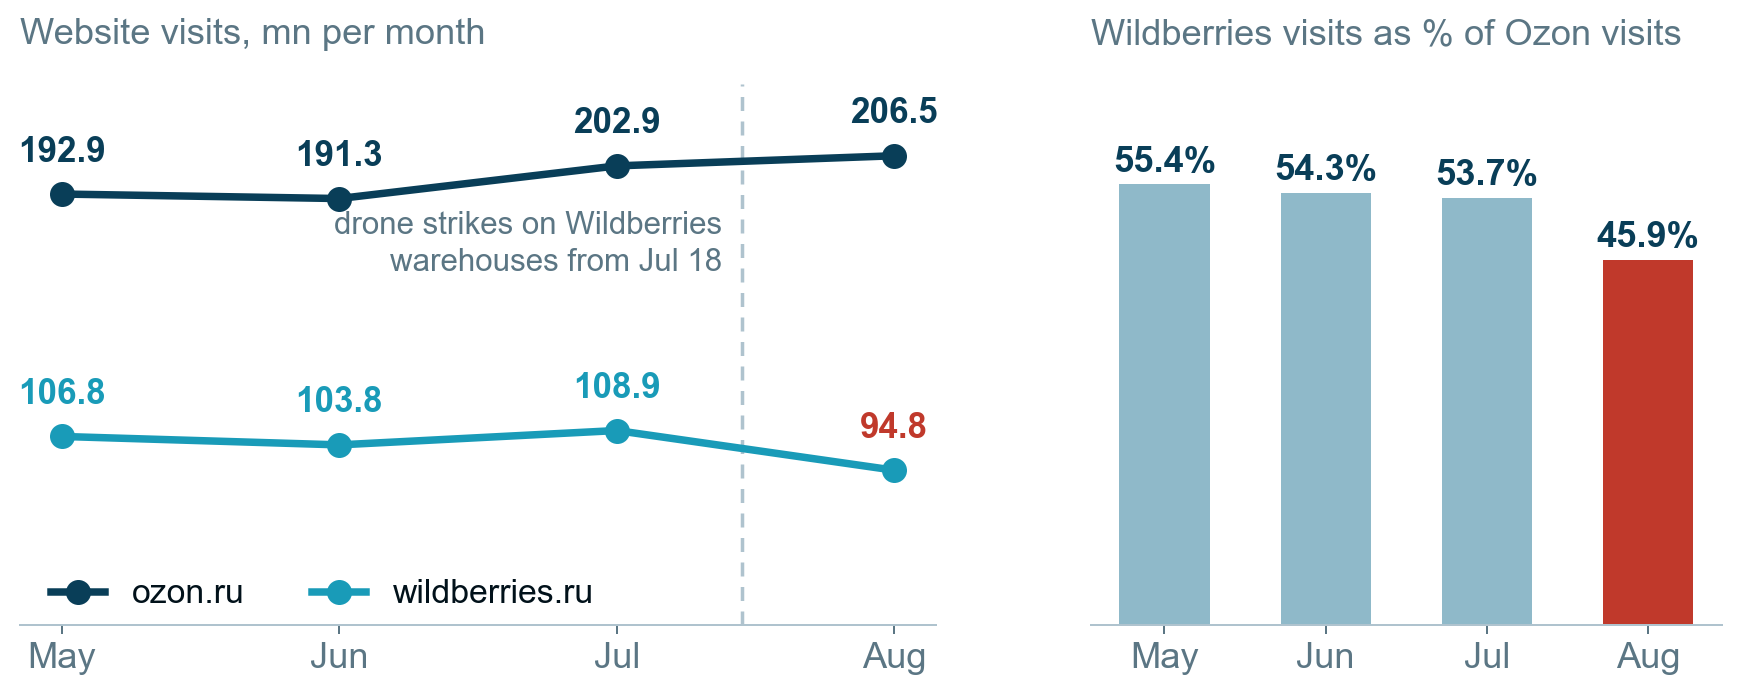
Until July the series moved almost in step; the gap in month-on-month dynamics did not exceed three percentage points. In August Wildberries lost 12.9% and Ozon gained 1.8%. That is a 14.7-point gap in a single month. The ratio of Wildberries visits to Ozon visits held at 54-55% for three months in a row and fell to 46% in August. The same August dropped wildberries.ru in the global website ranking from 77th place to 83rd.
Seasonality cannot explain this. If August were a weak month in itself, both sites would have dipped, whereas for Ozon it came out stronger than July.
The third large player does not change the picture. market.yandex.ru had 113.4 million visits over the same three months, three times fewer, and the latest month added 2.95%. There is no growth there comparable to Wildberries' loss. The redistribution is going toward Ozon and is not spread across the market.
Sales collapsed a month before traffic
The cleanest way to see the shift is to take sellers who trade on both platforms at once and compare their results on each. The buyer is the same, the product is the same, only the platform changes. A sample of 175 companies was compiled by Fontanka from monitoring-service data.
Over a month, these sellers' redemptions on Wildberries fell 10.9%, while their orders on Ozon rose 11.4%. In money terms that is RUB 34.3 bn versus RUB 30.5 bn on Wildberries and RUB 49.2 bn versus RUB 54.8 bn on Ozon. The shoe chain Kari saw Wildberries revenue fall 56%, while its orders on Ozon rose 8-9%. Clothing (down 17-28%) and footwear (down as much as 35% in the peak week) fell the most.
Note the order of events. Sales on Wildberries fell already in July, while site visits in that same July rose 4.9% and collapsed only in August. People kept visiting and not buying, checking order statuses, cancellations and delivery times. If buyers had simply started spending less, sales and traffic would have fallen together.
Wildberries now delivers more slowly and pays later, which makes the exit irreversible
If the problem were only the goods that burned, everything would have ended once the warehouses were restored. But two things that buyers and sellers remember for a long time were hit: delivery times and settlement times.
Goods flows were redirected to backup warehouses in neighbouring regions, and routes became longer. The load on the surviving Moscow-region hubs in Koledino and Podolsk rose 20-30%. Industry experts estimate the average increase in delivery time at 3-5 days, and more for some categories. No measured public series on delivery times exists, so this is an estimate, not a fact, but the mechanism is confirmed both by logistics operators and by the rerouting itself.
Settlements with sellers slipped even more noticeably. On September 3 sellers wrote a letter to the government: payments for the last week of July, which were due by August 26, had not arrived. The Marketplace Sellers Union estimates the frozen amount at roughly RUB 20 bn, and a survey of almost two thousand sellers showed that 95.6% had not received their money. The platform itself attributed the delay to attacks on the "Seller Balance" service.
Delivery speed is the reason a buyer chooses a platform in the first place, and settlement speed is the reason a seller stays on it. While both are worse than before, a return to the previous shares looks less likely than the traffic data alone suggested.
Search interest in Wildberries dropped and has not come back
Monthly traffic data comes out with a lag, and September is not in it yet. Only the frequency of search queries is updated every day. Google Trends shows it on a scale from 0 to 100 relative to the peak within the selected period.
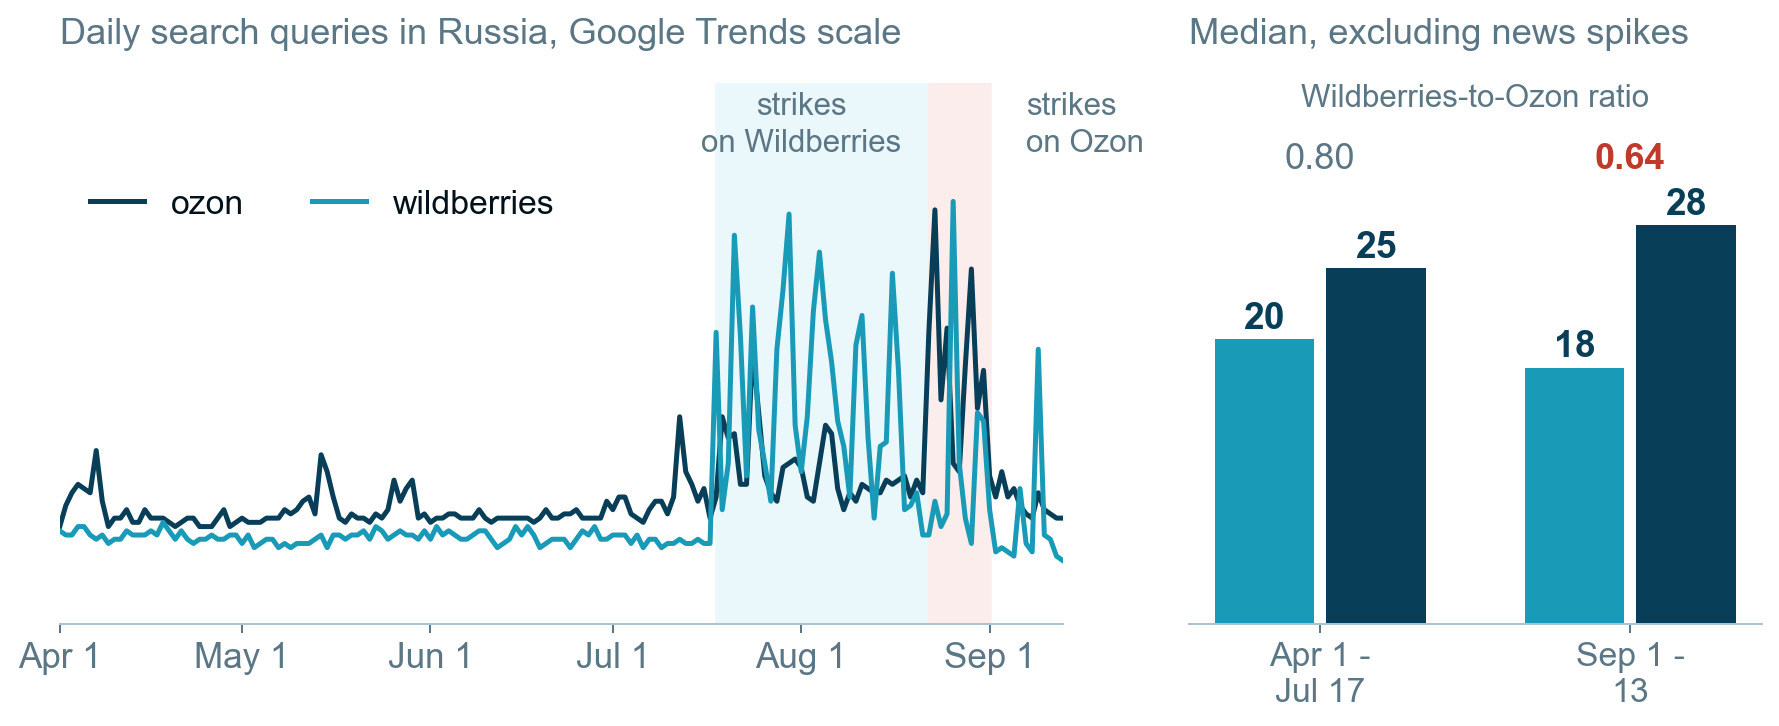
The spikes on the chart are news about the strikes, not demand, and they should not be read as such. On July 21 and 30, Wildberries queries jumped to 92 and 97 points, and on August 23 Ozon queries reached 98, when its own warehouses were hit. Only the quiet periods before and after are worth comparing.
The query ratio fell from 0.80 to 0.64 – a fifth off Wildberries' relative position. The median from April 1 to July 17: Wildberries 20 points, Ozon 25. From September 1 to 13: 18 and 28. This is the only September data currently available, and it says that by mid-month Wildberries had not managed to recover. Thirteen days is a short window, so the conclusion should be taken with a caveat.
The whole marketplace channel cooled, not just Wildberries
So far we have discussed how the market is divided. A separate question is what is happening to the market itself, and it is answered by SberIndex data on household spending by bank card. It is published weekly, so it sees events faster than any company reporting.
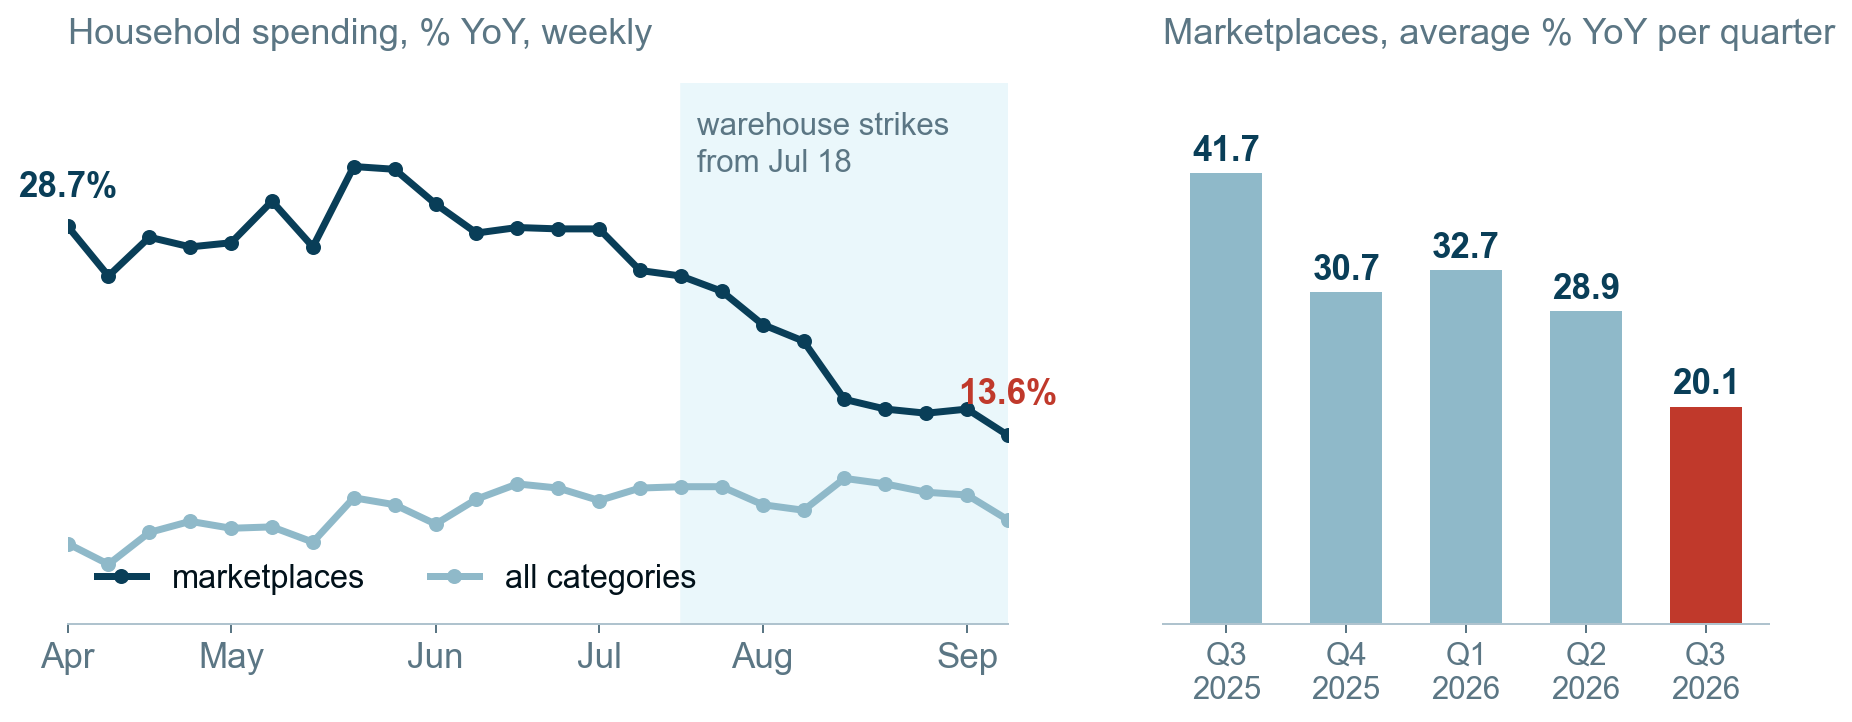
Spending on marketplaces grew 28.4% a year until mid-July, and by mid-September growth had fallen to 13.6%. Spending across all categories over the same time barely changed and holds at 8-10%. The gap between marketplaces and the rest of retail closed from 21 percentage points in spring to 6 by September. The channel stopped being the engine of consumer spending.
For our topic this means something unpleasant. The money Wildberries lost did not flow to competitors in full. If it had, the category as a whole would have kept growing at its previous pace, but it slowed by half while overall household spending stayed stable. Part of the purchases simply did not happen.
The quarterly average shows the same picture: 28.9% in the second quarter versus 20.1% in the third. That is a slowdown of almost 9 points in a quarter. One caveat matters here: SberIndex counts card payments, not goods turnover, and its level is higher than industry associations' estimates. Such a series should be used to compare speed, not level.
Indicatively, Ozon's share will gain 4-6 percentage points in the third quarter
The share gain is calculated simply. It equals the platform's starting share multiplied by the gap between its growth rate and the market's growth rate. We take the starting share as 30%, the midpoint of the range of external estimates. The base for the calculation is Ozon's turnover in the third quarter of 2025, RUB 1,102 bn per the company's reporting. For the market growth rate we adjust for the channel slowdown that SberIndex showed: instead of the first half's 18.7%, we assume 10-13%.
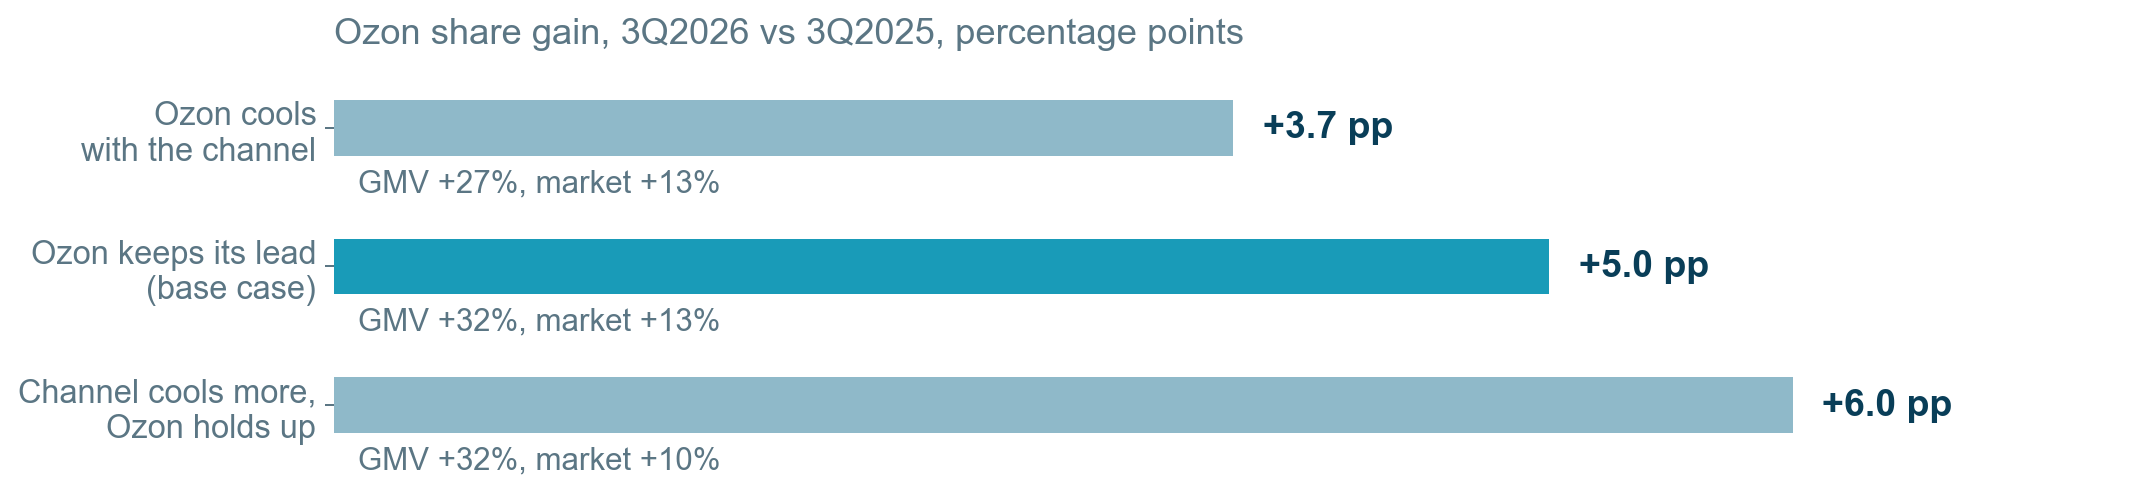
The base case gives 5.0 percentage points, the whole range is 3.7 to 6.0. This almost repeats the first-half result, where the growth gap gave 4.4 points. So the overwhelming part of the quarter's share gain comes from the ordinary trend, not from the consequences of the strikes. A bottom-up count gives the same order of magnitude. With a market share of about 40%, Wildberries lost a tenth of its sales over two and a half months of the quarter, and if half of that volume went to Ozon, the contribution would be 1.7 points.
The estimate is robust to assumptions, and that is its main virtue. With a starting share of 28% the base case gives 4.7 points, with 32% it gives 5.4. If we take a more cautious assumption of 16-18% market growth, the range shifts to 2.3-4.1 points, so the order of magnitude is preserved. Something else matters more: we estimate the share gain, not its level. The level depends on the perimeter of the count and ranges from 28% to 32% across external agencies. Ozon's third-quarter report will come out by the end of November, and the base case will be confirmed by turnover of about RUB 1,455 bn.
The measurement shows direction but does not give the size of the share
- Website traffic is not the same as sales. Both platforms work mainly through their apps, and the web share differs between them. The two-to-one gap in levels has always been there and says nothing about turnover. Only each series' dynamics relative to itself can be read.
- Part of the drop is due to goods being unavailable. When a warehouse burned, the buyer did not always go to a competitor: part of the purchases simply did not happen, and that money went to no one.
- Wildberries' share is not disclosed anywhere. The company is private, and external agencies' estimates differ by a factor of two.
- SimilarWeb and Google Trends are panel estimates. They are not counters on the site but models built on a sample. In addition, in 2026 internet restrictions overlaid Russian traffic, which distorts the series separately.
What remains solid despite these caveats. Each series is compared with itself, not with a competitor. Market turnover, website traffic and search queries are measured by three different methods and show the same shift. A coincidence of three independent errors in the same direction is far less likely than a real shift.
The answer will come from September statistics in early October
The fork is tested by one number – visits to wildberries.ru in September.
- A rebound to 103-108 million visits. This would mean the whole episode was a supply failure: the goods were not there, buyers waited and came back. Ozon's share rose once.
- Stalling around 95 million or below. This would mean the buyer's habit has moved. A second month in a row at a low level with warehouses restored is already a structural loss of share, and it will have to be built into the valuation of both companies.
A separate argument for the second scenario is sellers' behaviour. Anyone who has once rebuilt their supply chain around their own warehouse and Ozon is reluctant to return: moving costs money and time, and moving back costs the same.
Given the combination of growth rate and valuation, Ozon looks attractive
Our view of the company is moderately positive, and we expect good numbers in the third-quarter report. The combination is rare: four years of EBITDA, with EBITDA growing 49% in the half-year, a rising market share, the move into the first annual profit and the first dividends. The shift from Wildberries adds about one percentage point of turnover per quarter to this. That is nice, but the thesis does not rest on it.
The shares cost RUB 2,610, market capitalisation is RUB 566 bn, and net debt as of June 30 is RUB 239 bn. Net debt is calculated here symmetrically for Fintech: leases, loans and bank customer funds, less cash, loans issued and Fintech's securities. On this basis the value of the business is RUB 805 bn.
- Four years of EBITDA. The company guides for 2026 adjusted EBITDA of about RUB 200 bn, so the business is valued at 4.0 times its annual EBITDA. The platform's turnover is valued at 0.15. In the first half EBITDA grew 49%, and the EBITDA-to-turnover margin in the second quarter reached a company record of 4.4%. If we count more conservatively and put back into costs the employee share-based compensation that the company adds back to EBITDA, we get 4.3 years of EBITDA instead of 4.0. This item cost RUB 6.5 bn in the half-year and did not exist at all a year earlier.
- Ahead are the first annual profit and the first dividends. Net profit for the half-year was RUB 14.6 bn versus a loss a year earlier. The promised payout of RUB 30 bn or more gives about a 5.3% yield on the current price.
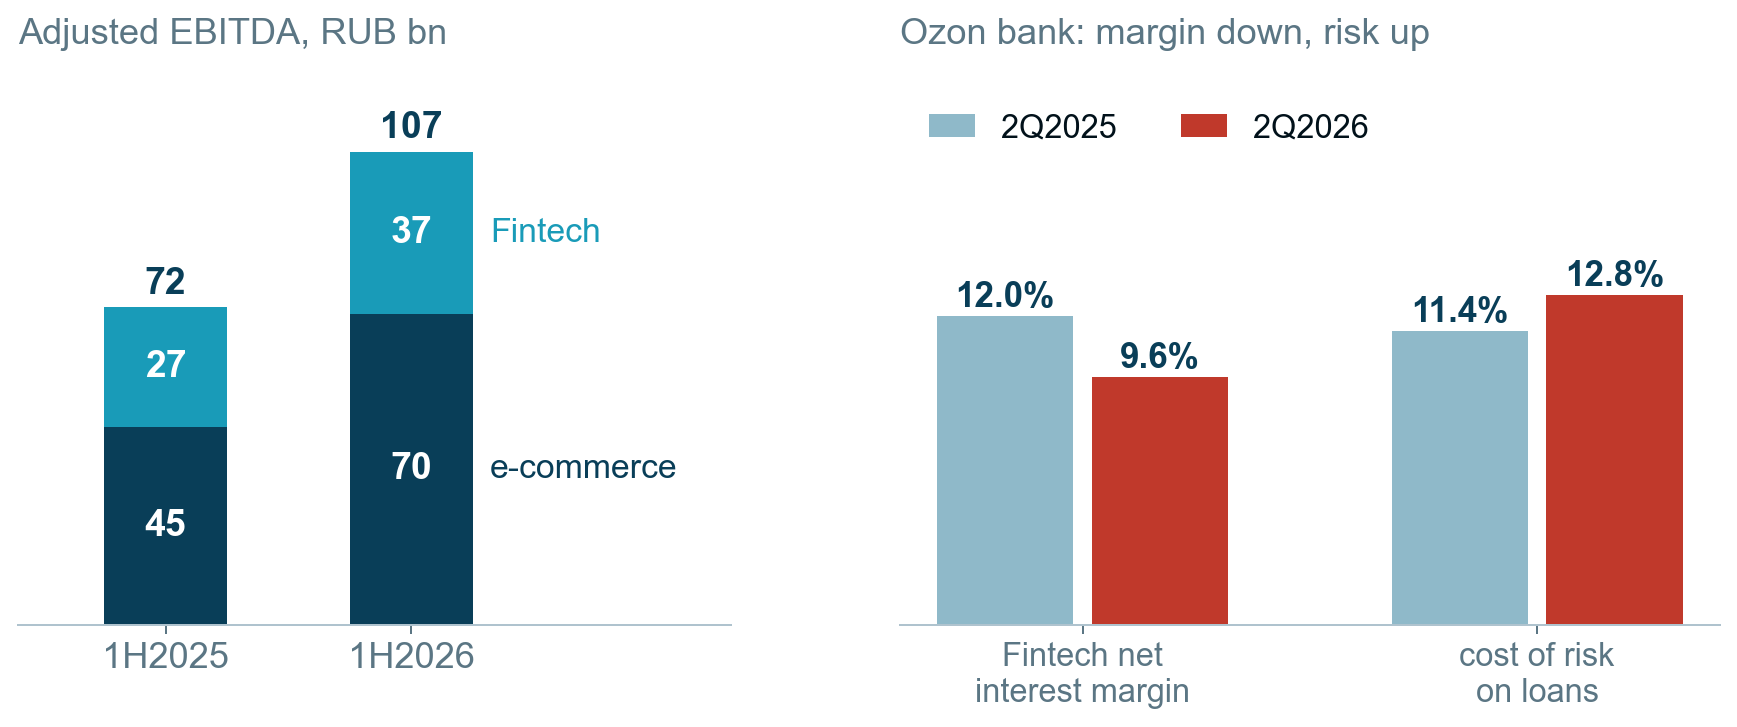
- Retail is finally overtaking the bank. EBITDA of the e-commerce segment grew 57% in the half-year to RUB 70 bn, while Fintech added 36% and delivered RUB 37 bn. A year ago the bank gave 38% of group profit; now it gives 34%.
Risks are listed in order of importance, and the first one is not financial.
- Strikes on warehouses are the main risk, and it is already materialising. Since August 22 the strikes have hit Ozon's own logistics. What now works in the company's favour could tomorrow hit it directly, instantly and with no connection to management quality. Wildberries lost 8% to 17% of its warehouse capacity within a few weeks, and Ozon's warehouse concentration is comparable. This risk is not hedged and is not priced into the multiple; it has to be accepted as it is.
- The channel beneath the company is cooling. Marketplace spending slowed from 28.4% to 13.6% in two months. Four years of EBITDA is cheap for a company growing 30-40%, and not cheap at all for a company growing 15%. Capturing a competitor's share currently offsets the channel slowdown, but the cushion is not infinite.
- The bank brings a third of EBITDA, and its margin is shrinking. Fintech's net interest margin fell from 12.0% to 9.6% over the year, and the cost of risk on customer loans rose from 11.4% to 12.8%. Bank profit deserves a lower multiple than platform profit, and it depends directly on the key rate.
- Warehouses are leased, and EBITDA is calculated before the payments for them. Long-term lease liabilities are RUB 327 bn, almost half of the whole business value. This lease is included in the multiple, but the company's cash flow is weaker than its EBITDA by exactly the lease payments. Equity is also negative, minus RUB 154 bn.
Nevertheless, we find the idea promising ahead of the third-quarter report, and we hold Ozon shares in our portfolio. The combination of growth and price is currently in the company's favour: the market pays four years of EBITDA for a business that grows it by about half each year and at the same time takes share from its main competitor. We see the risks listed above and accept them knowingly, rather than regarding them as insignificant.
There are two numbers to watch in the report. Turnover of about RUB 1,455 bn would confirm that the company is growing faster than the channel is cooling. A Fintech interest margin below 9% would eat part of the EBITDA growth. Then four years of EBITDA would turn out not to be such a discount, and our view would have to be revised.
The calculations are based on Ozon's reporting for the second quarter and first half of 2026 and Moscow Exchange quotes as of 14.09.2026.
The mastermind idea is more likely confirmed, but not in its boldest version
The key assumption passed the test. Share really is moving, and this is visible in four independent measures: market turnover, website traffic, search queries and the panel of common sellers. The thesis about the differing resilience of logistics is also confirmed by the facts: from 8% to 17% of Wildberries' warehouse capacity went offline, delivery times rose, and settlements with sellers were delayed to the point that a letter reached the government.
The boldest version of the idea, however, looks like a stretch. At the meeting, doubt was voiced that Ozon's turnover would grow 60% in the third quarter, and our calculation supports that doubt. The base case gives about 32%, the upper case 35%, and even that requires the company to ignore completely the slowdown of the whole channel. The bet works not on explosive turnover growth but on a combination of moderate growth with a low price.
One argument has become weaker since the meeting. SberIndex data showed that the whole marketplace channel cooled, not just the affected platform. So part of others' losses does not turn into others' gains, and a full shift should not be counted on.
What to watch next
The whole set of indicators can be computed monthly and free of charge: monthly visits for both domains, daily search queries, Ozon's turnover compared with the AKIT market estimate, weekly spending by category from SberIndex. Paid data is needed only for the panel of identical sellers. It is the one that shows the shift earliest.
Company cards with financial metrics are on our portal: Ozon, Yandex. Extended cards for the Russian market.
Weekly materials appear in the Telegram channel Enhanced Investments.
See also: market overview · valuation map · stock screeners