The AI boom in numbers: semiconductors +92%, memory up 3.5x. Which of the 29 names in the chain looks best
The global semiconductor market has almost doubled in a year: 809bn dollars in 2025 against a forecast of 1.51-1.56 trillion for 2026. Memory inside it grew 3.5 times, from roughly 240bn to 837bn. Four companies - Amazon, Google, Meta and Microsoft - will put around 630bn dollars into data centres this year against 388bn a year earlier. Micron's shares have travelled from 123 to 1,017 dollars since June 2025.
When a sector moves that fast, the question stops being whether it grows and becomes who captures the growth. We took twenty-nine companies across six countries - lithography, foundries, chips, equipment, memory, networking and power, AI clouds - and ran them all through the same metrics: revenue and growth on the latest reported quarter, EBITDA margin, EV/EBITDA over twelve months, and the value created over the year as a percentage of market capitalisation. The data comes from primary sources: SEC filings, Korea's DART and Taiwanese exchange reporting.
The short answer: memory takes the entire podium on value creation, and within it Micron and SK hynix look best; Micron's apparent premium to the Koreans disappears once the country discount is accounted for; and the AI clouds cannot be judged on EBITDA at all. What follows is where the demand comes from, how the market forecasts moved through the year, what our cycle indicator would have shown, the full table of all twenty-nine names, and what could break the story.
Investment highlights
- The source of demand. The four hyperscalers will spend roughly $630bn on capital projects in 2026 against $388bn in 2025, and forecasts for 2027 already sit near $935bn. This is not an order cycle, it is an infrastructure build.
- The semiconductor market nearly doubled in a year: $809bn in 2025 against a forecast $1.51-1.56tn for 2026. Memory grew hardest of all inside it, from about $240bn to $837bn.
- Forecasts lagged systematically. The 2026 memory market estimate was raised through the year from $551.6bn to $889.3bn, and the 2027 estimate from $842.7bn to more than $1.28tn.
- We built our cycle indicator on 4 September 2026. On historical data it would have turned up in June 2025, when Micron traded near $123 against $1,017 now. That is a reconstruction, not signals we gave at the time.
- Price, not volume, drove the memory growth. The DRAM price index is up 6.6 times since the end of 2023, while implied volume is up only 1.57 times at Micron and 1.33 at SK hynix: price contributed about four times as much. The rest of the chain is the other way round, growing on shipments, with margins up 5 to 10 points over the year against 26 to 40 in memory.
- Normalising prices does not break the case, and Micron shows it best. Bring the price down to the midpoint of today and the three-year average and, on current volumes, Micron trades at 12.7 times EBITDA against a 20.6x median across our US coverage; on its own three-year multiple that is an upside of about 85%, on a price a third below today's. SK hynix on the same normalisation trades at 7.7 and Nanya at 9.8.
- Memory took the whole podium on value created: the top five are Winbond, Samsung, SK hynix, Nanya and Micron. NVIDIA is ninth.
- The country discount explains Micron's apparent premium. The Koreans trade at 6.7-8.2 times EBITDA against Micron's 17.2, but the median US multiple is 20.6x against Korea's 7.9x. Adjusted, SK hynix sits at 21.4x and Micron carries no premium at all.
- Micron and SK hynix look best. Samsung comes with three caveats, the main one being inventory up from 87 to 124 days over three quarters.
- The AI clouds cannot be measured on EBITDA. Nebius runs an 85% margin on 454% growth, yet the value-creation model gives CoreWeave minus 0.27: the capital that produces the margin is invisible to the measure.
Where the demand comes from: a $630bn build
Everything happening to memory prices and to semiconductor earnings traces back to one source - the capital budgets of four buyers.
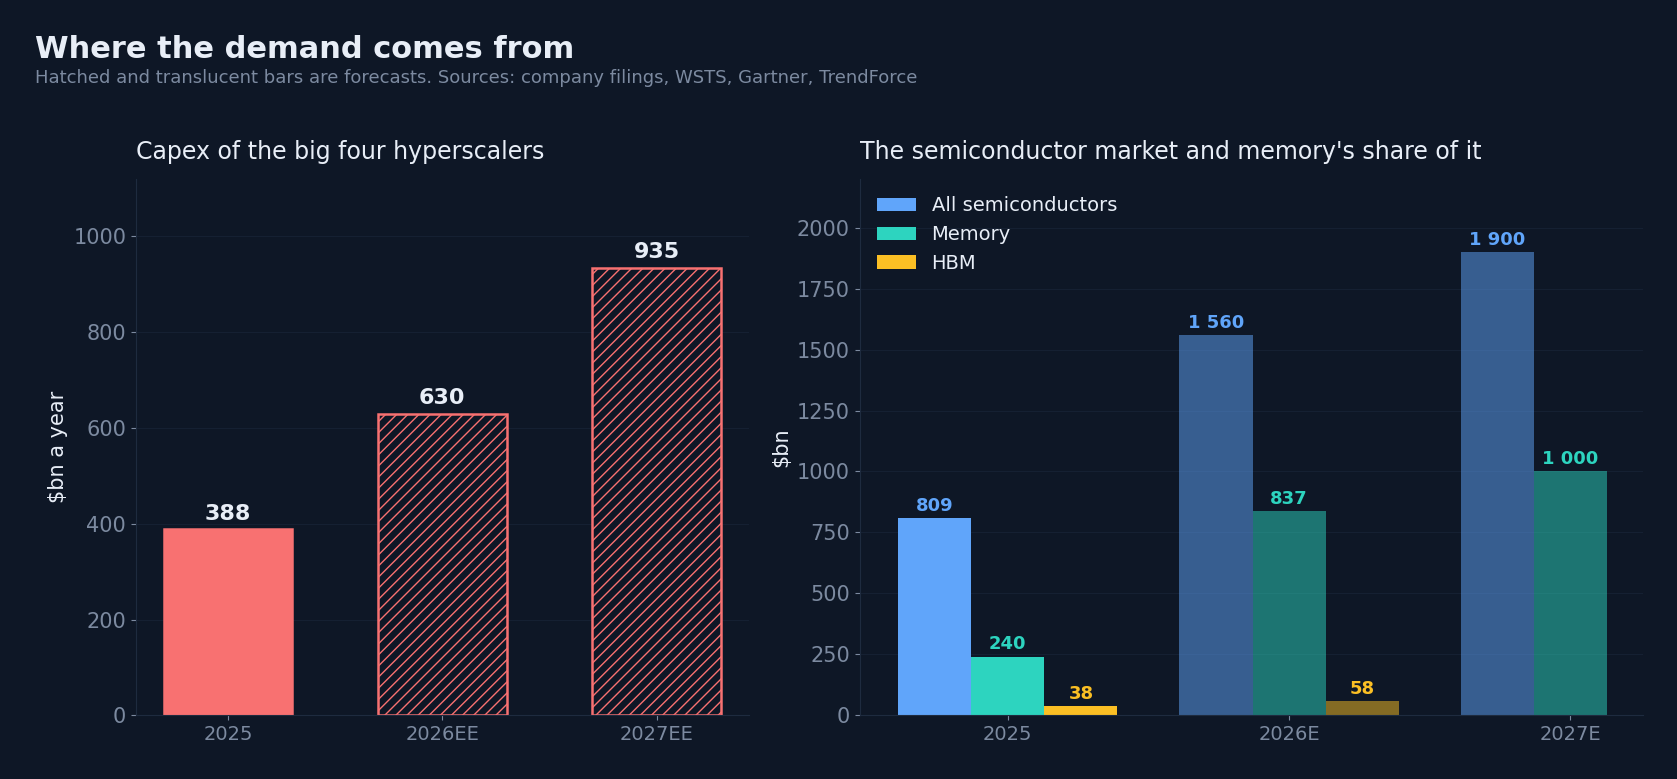
Amazon plans to spend around $200bn in 2026 against $125bn a year earlier. Google $175-185bn against $91bn. Meta $115-135bn against $72bn. Microsoft $110-120bn against $90bn. That is roughly $630bn in a single year against $388bn in 2025, an increase of more than half. Forecasts for 2027 already sit near $935bn, and some estimates cross a trillion.
What matters is how this differs from an ordinary order cycle. These companies build data centres against a multi-year horizon, announce budgets years ahead and compete with each other not to fall behind. Demand built that way is far less elastic to price than purchasing against current sales.
The market in money: semiconductors nearly doubled, memory tripled
The global semiconductor market was $809bn in 2025 and grew 21%. The forecast for 2026 is $1.51-1.56tn, which is plus 90-92% in a single year. For 2027 the expectation is around $1.9tn.
Memory is the main source of that increase: from roughly $240bn in 2025 to $837bn in 2026, a 3.5-fold rise, and beyond a trillion in 2027. AI semiconductors as a whole account for about 30% of the market.
HBM deserves separating out - the high-bandwidth memory stacked beside the accelerators. Its market grows from $38bn in 2025 to $58bn in 2026. The figure looks modest against $837bn of total memory, but its significance is not its size. HBM delivers only 9% of DRAM bits while consuming 22% of the industry's silicon wafers; by the end of 2027 that becomes 13% of bits and 30% of wafers. Every HBM bit is subtracted from the supply of ordinary memory, which is why prices rose for modules with no connection to AI at all.
Price or volume: what the growth is made of
Revenue growth at the memory makers looks equally impressive across the board, but it is made of two very different things. A price turns within a quarter; volume never turns quickly, because a new fab takes three years. Micron is the only company in the sector that discloses the change in its average selling price quarter by quarter. Chaining those changes gives an index: Q4 2023 = 100, today 658, a 6.6-fold rise in price.
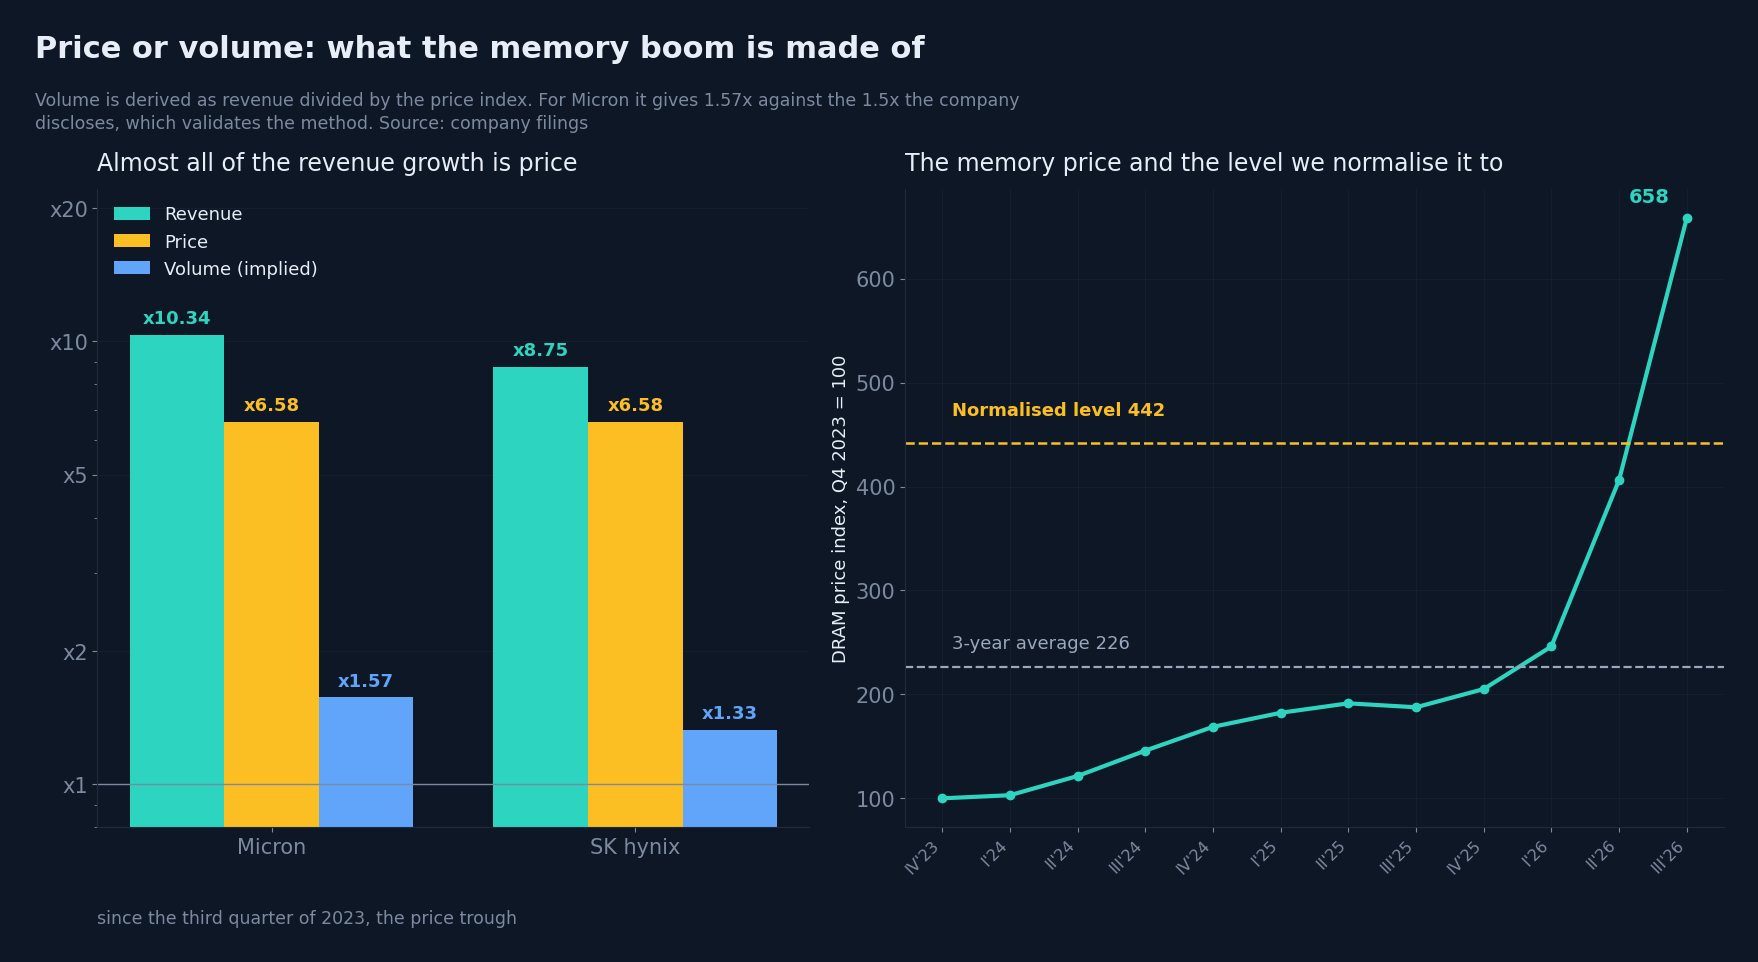
Micron's revenue over the same period grew 10.3 times. Divide one by the other and the implied volume comes out at 1.57 times. The company also discloses bit shipments separately, and those are up about one and a half times. The gap is within tolerance, which means the method measures what it is meant to.
The same calculation for SK hynix gives revenue up 8.75 times, price up 6.6 and volume up 1.33. At Nanya, revenue since Q1 2025 is up 11.5 times against a price up 3.4, so volume is up 3.3 times as new capacity came on. Winbond falls outside the pattern: its niche DRAM and NOR flash did not rise in price the way the mainstream did, and the implied volume comes out below one. There the residual absorbs the difference in product mix rather than any real fall in shipments.
Outside memory the split cannot be made: neither the chip designers, nor the equipment makers, nor the foundries disclose price and volume separately. But there is an indirect tell in the margin: price drops straight into profit, while volume arrives with the cost of producing it. Over the year the quarterly EBITDA margin went from 45.8 to 86.1% at Micron and from 55.8 to 81.4% at SK hynix, a gain of 26 to 40 percentage points. Over the same year TSMC went from 73.3 to 83.8% and NVIDIA from 62.3 to 67.4%, gains of 5 to 10 points, and TSMC's comes from its own pricing power on leading nodes rather than from a spot market. The price boom is a memory story; the rest of the chain is growing mostly on shipments.
What happens if prices normalise
Every price story comes down to one question: what is the company worth if the price returns to normal. We treat it the way we treat commodity producers. The price is brought down to the midpoint between today's level and the three-year average: 442 against 658 today, a third lower. Volumes are the latest quarter annualised, because the capacity is already built and running. Costs are left alone, because cheaper DRAM does not make wafers, equipment or people cheaper.

Profit compresses noticeably: SK hynix from 192 to 114bn dollars, Micron from 143 to 88, Nanya from 8.3 to 4.9, Winbond from 4.3 to 1.8. The margin falls from 81 to 72% at SK hynix and from 86 to 79% at Micron. Which is to say that even at a normalised price this is a business running above a seventy percent margin.
Then the interesting part. On that normalised profit, at today's share price, SK hynix trades at 7.7 times EBITDA, Nanya at 9.8 and Micron at 12.7 against a median of 20.6x across our entire US coverage. Winbond is the one exception at 14.4x, because its margin falls hardest, from 56 to 35%.
One can go further and apply not today's price but the multiple Micron itself has traded at over the past three years: the 75th percentile of its own daily EV/EBITDA, 23.6x. The normalised profit then implies a market capitalisation of about 2.1 trillion dollars against 1.13 trillion today, an upside of roughly 85%. At a more cautious 18.7x, the same percentile excluding the 2023-24 trough, it is plus 47%; at the six-year median of 10.9x it is minus 14%. A wide spread, but three of the four scenarios are positive, and all of them are calculated on a price a third below today's.
For the Korean and Taiwanese names we deliberately skip this calculation. We hold 14 and 5 reported quarters for them, and in a deep cyclical the percentile of a historical multiple is inevitably computed over a stretch where EBITDA is near zero, so it says more about the bottom of the cycle than about fair value. For those names the chart shows the multiple on today's share price, with no assumption about re-rating at all.
The forecasts lagged the outcome, systematically
This is perhaps the most useful practical observation. Analysts did not merely underestimate the scale - they revised their own numbers upward by tens of percent within a single year.

The 2026 memory market estimate went from $551.6bn to $889.3bn, plus 61%. The 2027 estimate went from $842.7bn to more than $1.28tn, plus 52%. The whole semiconductor market forecast for 2026 went from more than $1.3tn to $1.56tn.
The practical conclusion: in this regime a consensus forecast stops working as an anchor for valuation. A company that looks expensive on forecast earnings can be cheap a quarter later simply because the forecast was raised. Micron demonstrates exactly that - thirteen consecutive quarters above its own guidance, with the gap in the last five reaching 24% on revenue and 47% on earnings per share.
Our cycle indicator: what it would have shown, and when
We maintain our own composite indicator of the memory cycle. It combines monthly revenue from Taiwan's Nanya and Winbond, DRAM spot prices, and the trend in margins, inventory and capital spending at Micron and SK hynix. Each component scores plus one, zero or minus one.

One caveat first, without which the rest would be dishonest. We built this indicator on 4 September 2026, so all history before that date is a reconstruction on historical data, not signals we gave in real time. We did not call a turn in June 2025 and did not buy on it. What follows is what the indicator would have shown, with every limitation a backtest carries.
The reconstruction is built without look-ahead: each input is shifted to the month it was published rather than the month it describes. One more detail: we have only been collecting DRAM spot prices since 4 September 2026, so that signal takes no part in the historical stretch at all - the composite there rests on six components of seven.
With those caveats, the picture is this. The composite would have turned up in June 2025, when Micron traded around $123; it is $1,017 now. It has been positive for sixteen months, and only the last few days of that run are observation rather than reconstruction.
The chart shows why the construction works. Nanya publishes monthly revenue in the middle of the following month, whereas Micron's quarterly filing arrives a month and a half to two months after the quarter closes. The Taiwanese series turns first and gives a signal months before the large manufacturers' accounts confirm it. Through 2026 Nanya's revenue ran between plus 560% and plus 730% year on year - every month, ahead of any quarterly disclosure.
An honest word about the limits of the method. On a 2006-2026 backtest, a positive composite makes the following six months better than average for Micron, a median of plus 11.6% against plus 5.3%. But over twelve months the sign flips: a median of plus 3.8% after strong readings against plus 18.7% after weak ones. The indicator catches upward turns well and confirms what has happened, but it does not predict the next turn down.
What that means for a position is this. While the composite holds positive it is worth holding; the moment it begins to show cooling is probably the signal to leave. It usually breaks in a set order: inventory builds at the manufacturers first, then Nanya's monthly revenue rolls over, and only then do spot prices fall. Waiting for the quarterly accounts to confirm it will be too late - they arrive a month and a half to two months after the event. The composite now reads at its maximum, plus 5 of 5, and the first warning will not come from the composite itself but from inventory: Samsung's is already up from 87 to 124 days.
Where the money is in the chain, and where the margin is
Split the chain into seven segments and look at each.

The spread is enormous. Memory, on $625bn of revenue, grows at a median 130% with a median margin of 48%, while foundry and equipment grow 17-25% on margins of 22-37%. The further from memory, the weaker the growth - while the multiple stays high.
All twenty-nine names
The full table with every metric is below. Trailing-twelve-month revenue is converted to dollars, growth is the latest reported quarter year on year, and margin and multiple share one twelve-month window.

Value created: memory takes the podium
The third metric answers not "what is this worth" but "how much value did the past year of trading add relative to what the company costs today". It is the year-on-year change in quarterly EBITDA, annualised and capitalised at a target multiple, plus the cash actually returned to shareholders or used to cut debt, all divided by market capitalisation and expressed as a percentage of it.

On this measure the top five places all go to memory: Winbond +87%, Samsung +86%, SK hynix +81%, Nanya +79%, Micron +76% of their own market value in a single year. UMC, next down, trails by a third, and NVIDIA sits ninth at +39%.
The Korean scores are suppressed by construction: the model applies a target multiple by country, and Korea's is 8.0 against 12.0 for the United States. Samsung and SK hynix reached the top three despite the country penalty, not because of any indulgence.
A second way to look at it is how much growth you buy per turn of multiple. SK hynix delivers 31 percentage points of growth per turn of EV/EBITDA, Micron 20, Samsung 19. The nearest challenger is Nebius at 7.6 - a fourfold gap.
Two methods, differently built, give one answer. But these are not two independent confirmations: both are looking at the same price shock in memory, which is worth keeping in mind.
The country matters more than it appears
The Korean memory makers trade at 6.7 and 8.2 times EBITDA against Micron's 17.2. On the face of it Micron carries a threefold premium to its closest peers.
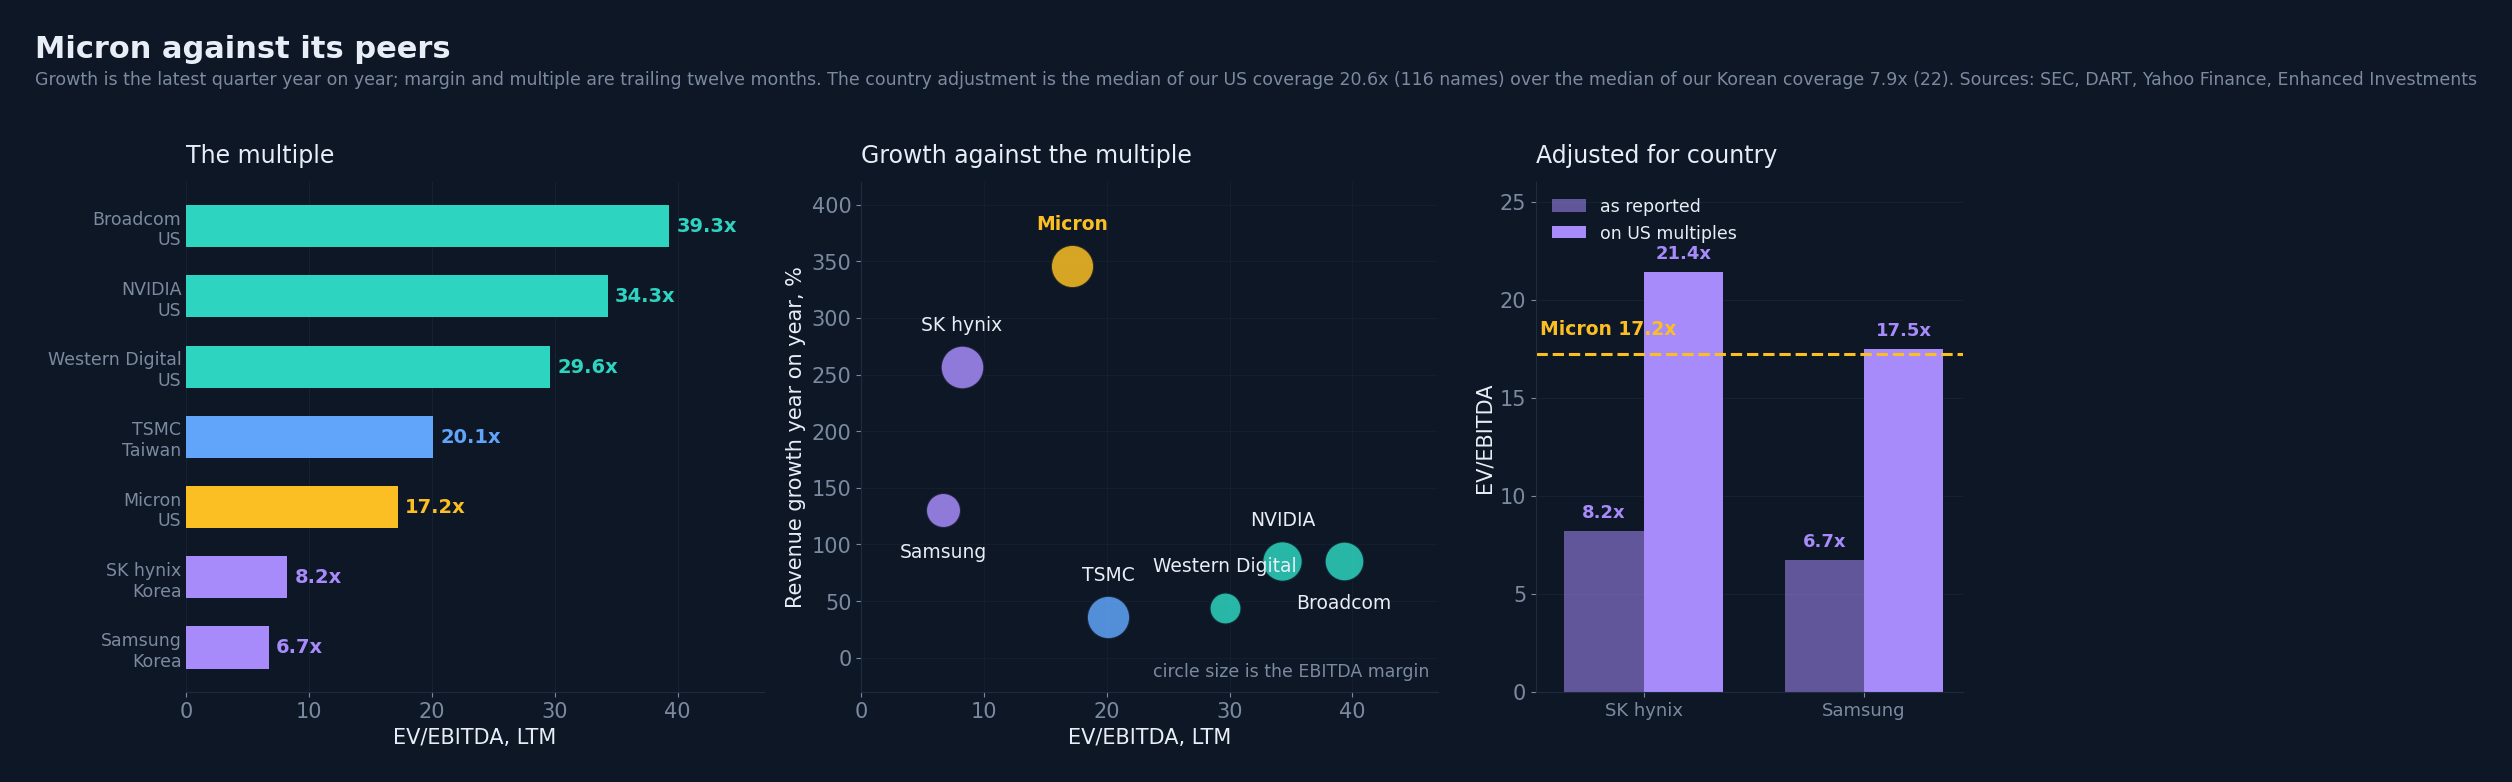
We measured the country effect across our own coverage, on identical method on both sides: the median EV/EBITDA of 116 US companies is 20.6x and of 22 Korean companies 7.9x, a gap of 2.6 times - and that is about the market, not the industry.
Lift the Koreans onto US multiples and SK hynix would trade at 21.4 times EBITDA, Samsung at 17.5, against Micron's actual 17.2. There is no premium to its closest peers at all; Micron is marginally cheaper.
Corroboration arrives from an unexpected direction. TSMC prints 17.9x on the Taiwanese exchange and 20.1x on its US receipts. The same company is worth about 12% more bought in New York than in Taipei.
The AI clouds are a separate story
Nebius posted the fastest growth in the cohort, plus 454% over the year, and the highest EBITDA margin at 85%. It also trades at 59.8 times EBITDA, and the value-creation model returned nothing for it - too short a history. CoreWeave, growing 112%, scores minus 0.27; Supermicro, growing 93%, minus 0.54.
The reason is that EBITDA describes these businesses poorly. Nebius and CoreWeave build data centres and lease equipment: a high EBITDA margin here does not mean a high return on capital employed, because the capital itself is invisible to EBITDA. Comparing them with a memory maker on this measure is not sound; they need separate treatment and other standards.
Who looks best
Micron comes first on a like-for-like basis. It grows fastest (+346%), shares the top margin (76%), trades at 17.2x, and once the country adjustment is applied that is a small discount to the Koreans rather than a premium. Two further points work in its favour: multi-year take-or-pay contracts with a price floor, under which the company says margins even at the floor will beat the peak of any past cycle, and thirteen consecutive quarters above its own guidance.
SK hynix is the cleanest second position. Its margin of 77% is above Micron's. Net cash. The HBM leader.
But something substantial troubles the case: it is losing the most valuable segment. Its HBM share fell from 64% to 50% over the year, and Samsung took it, having been first into volume production of HBM4 in February 2026. The leader is surrendering leadership exactly where the margin sits. There is also earnings quality: second-quarter net profit of 93.8 trillion won came in above operating profit of 60.5 trillion, so a visible part came from non-core items.
Samsung troubles us more, for a specific reason. It is a conglomerate: a 48% margin against SK hynix's 77%, because alongside memory you are buying smartphones, displays and a foundry. Much of the cheapness at 6.7x follows from that.
More importantly, Samsung is where the one warning signal in our whole indicator set has fired: inventory has risen from 87 to 124 days of cost of sales over three quarters, while Micron and SK hynix sit flat at 122-123. That is the metric which historically breaks before prices do. And we have no clean read on Samsung, because we deliberately excluded its inventory from the composite for being a conglomerate.
Top picks: six names and why these
Putting it together. The selection rests on four things: how much value the company created over the year, what it costs once the listing venue is accounted for, what happens to it when prices normalise, and where it sits in the chain. Six names come through.

SK hynix and Micron are the core. Both offer the best combination of position and price: SK hynix holds half the HBM market and trades at 7.7 times EBITDA after prices normalise; Micron is third in HBM but has sold a substantial share of its output on contracts with a price ceiling, and after the same normalisation trades at 12.7. Each created value over the year worth around four fifths of its own market capitalisation.
Samsung and Nanya are the value side. Samsung is the cheapest in the cohort at 6.7 times EBITDA and the best on value created, but its inventory has gone from 87 to 124 days in three quarters, which is precisely the signal a turn usually starts with. Nanya trades at 9.8 times EBITDA after normalisation with volumes tripled, the cheapest of the names that survive the test.
TSMC and NVIDIA are about position, not price. TSMC is the chokepoint of the entire chain: no accelerator exists without its capacity, its 76% margin holds without any price boom, and it trades at 17.9. NVIDIA is the source of demand for everyone else on this list; 34.3 times EBITDA is expensive by the cohort's standards, but 106% growth on a 66% margin still pays for that multiple.
Who did not make it, and why. Winbond: normalisation halves the margin, from 56 to 35%, and pushes the multiple to 14.4. CoreWeave and Nebius: the capital that produces their margin is invisible in EBITDA, so the metric cannot judge them. Arm, Astera Labs and Credo: multiples of 175 to 340 times EBITDA price in a future with no mistakes in it. Supermicro: minus 54% on value creation on an 8% margin. Seagate and Western Digital: hard drives run on their own price series, and a DRAM normalisation cannot be applied to them. UMC comes out for a different reason: its latest-quarter depreciation in our data looks like a cumulative half-year figure, which inflates profit and everything calculated from it. We will come back to it once the filing has been checked.
What could break the story
China. CXMT's share of DRAM revenue went from 4% to 10% in a year, its revenue up 716%, and the combined share of the top three fell below 90% for the first time. The technology gap narrowed from five years or more to two or three.
The capacity wave of 2027-2028. New plants do not help inside the forecast horizon - meaningful output is not expected before 2028. But it will arrive then, and it will arrive everywhere at once.
NAND diverges from DRAM. Flash supply turns loose in the second half of 2027 as capacity comes online while consumer demand stays weak.
Our own indicator is at its maximum. After such readings twelve-month returns have historically been weak, and the composite turning towards cooling is the likely signal to leave.
Conclusion
The order of preference on our numbers: Micron, then SK hynix, then everything else by a wide margin. Samsung technically belongs in that logic, but three caveats make it a markedly less clean expression of the same idea.
One closing thought. Micron plus SK hynix is not diversification but a doubled bet on the DRAM price. The three metrics agreed not because they confirmed each other independently, but because all three are looking at one event. Growth in the table is a single quarter year on year, and memory is at the top of its cycle: those rates are not repeatable, and the whole question is how long the current level of prices holds.
The nearest test is Micron's report on 30 September and any disclosure of how much 2027-2028 volume is already under contract. That is the single number which settles the central argument.
See also: market overview · valuation map · stock screeners