A $900.4m profit that is almost entirely non-operating, while revenue falls for a fourth straight quarter

The third-quarter 2026 report cuts two ways. Revenue fell 4.3% year on year to $381.1m, net profit reached $900.4m against $108.9m a year earlier, and the net margin hit 236.3% – a level possible only with a large one-off gain below the operating line. Net debt fell from $4.8bn to $3.6bn over the quarter, and that is the only evidence of real cash coming in. Meanwhile the top line is decelerating: minus 1.5% in the second quarter against minus 4.3% in the third. The share looks neutral: the one-off improved the balance sheet, but operating momentum is weakening and the durability of the profit cannot yet be checked.
Key takeaways
— Revenue has fallen for four straight quarters, and the decline is deepening: from minus 1.5% in the second quarter to minus 4.3% in the third
— The $900.4m profit came almost entirely from outside operations, and a 236.3% net margin confirms it
— Net debt fell from $4.8bn to $3.6bn over the quarter, and that is the main trace of the one-off gain
— Over twelve months net debt barely moved: from $3.7bn to $3.6bn, so the one-off merely returned debt to its previous level
— An 86.3% return on equity reflects the one-off gain, not a sustainable return on capital
— Operating figures for the third quarter were not disclosed, which makes it impossible to separate the one-off from the recurring business
Attractiveness
Key figures, USD bn
| Metric | Q3 2025 | Q3 2026 | Change |
|---|---|---|---|
| Revenue | 0.40 | 0.38 | -4.3% |
| EBITDA | 0.22 | — | — |
| Operating profit | 0.06 | — | — |
| Net profit | 0.11 | 0.90 | +726.8% |
| Operating cash flow | 0.25 | — | — |
| Capex | 0.00 | — | — |
| EBITDA margin | 56.0% | — | — |
| Net margin | 27.3% | 236.3% | +209.0 pp |
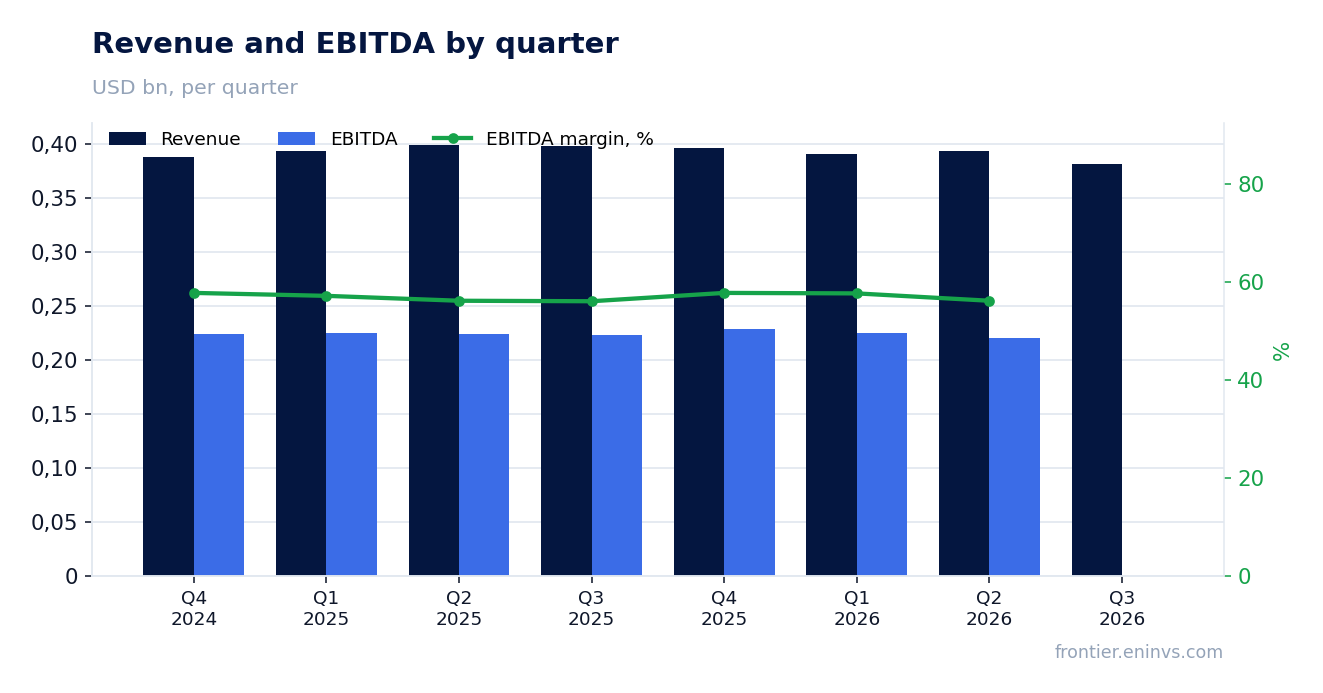
Revenue has fallen for four straight quarters, and the decline is deepening: from minus 1.5% in the second quarter to minus 4.3% in the third
Third-quarter 2026 revenue was $381.1m, 4.3% below a year earlier. The decline was milder in the second quarter at 1.5% and in the first at 0.6%. The deceleration is consistent: the positive growth of early 2025 gave way first to flat dynamics and then to a steady decline.
Over the trailing twelve months revenue was $1,600.0m. That level is no longer confirmed by the quarterly trend: each successive quarter is weaker than the last. For a company with roughly $1.6bn of revenue, a 4.3% annual loss is tens of millions of dollars of forgone turnover, and there is no sign yet that the fall will stop.
Operating figures for the third quarter were not disclosed, so it is impossible to say which segments drove the decline. Only the direction is visible: revenue has fallen for four quarters in a row, and the pace of the fall is increasing.
The $900.4m profit came almost entirely from outside operations, and a 236.3% net margin confirms it
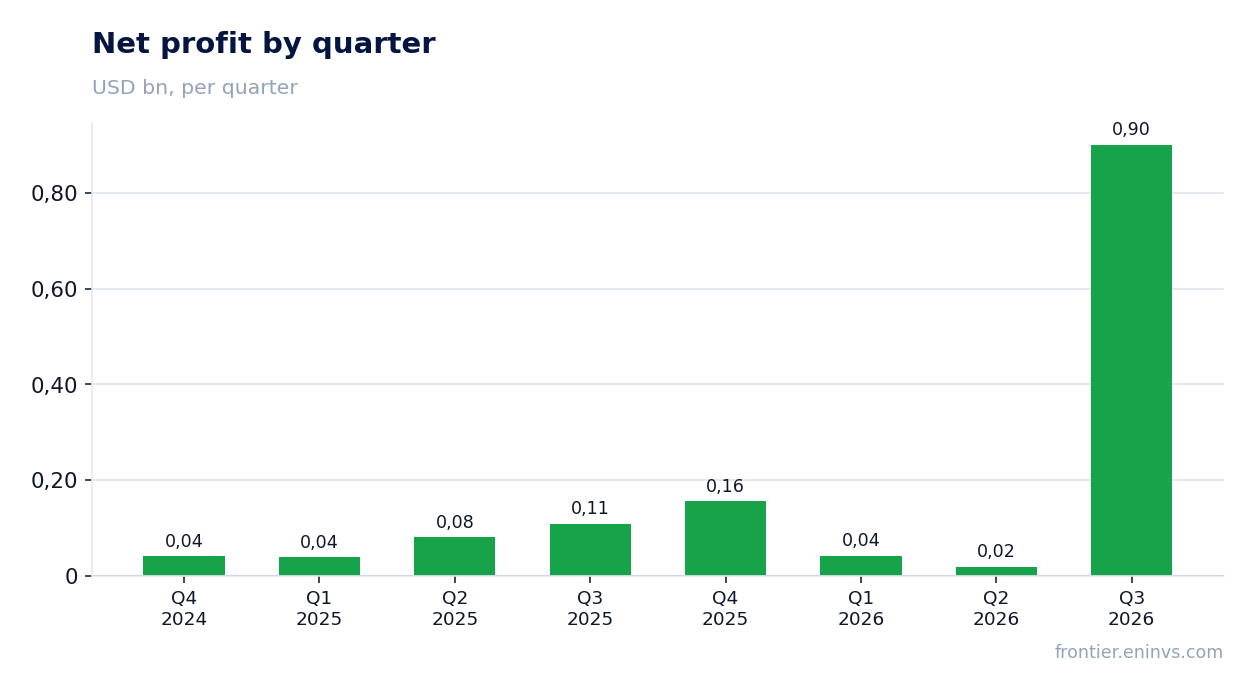
Third-quarter 2026 net profit was $900.4m against $108.9m a year earlier, an 8.3-fold increase. The net margin reached 236.3% against 27.3% a year earlier. A margin above 100% means profit exceeded revenue, which is possible only with a large gain unrelated to sales.
Operating profit and EBITDA for the third quarter were not disclosed. In the second quarter operating profit was $22.0m on revenue of $392.9m, about 5.6%. If the operating base stayed at that level, almost all of the quarterly profit came from below the operating line – an asset sale, a revaluation or another one-off gain.
For a holder this means the quarter's profit does not describe the company's earning power. Recurring profit, judging by the second quarter, is measured in tens of millions of dollars, not hundreds. Until the company discloses the source of the gain, the durability of this profit cannot be assessed.
Net debt fell from $4.8bn to $3.6bn over the quarter, and that is the main trace of the one-off gain
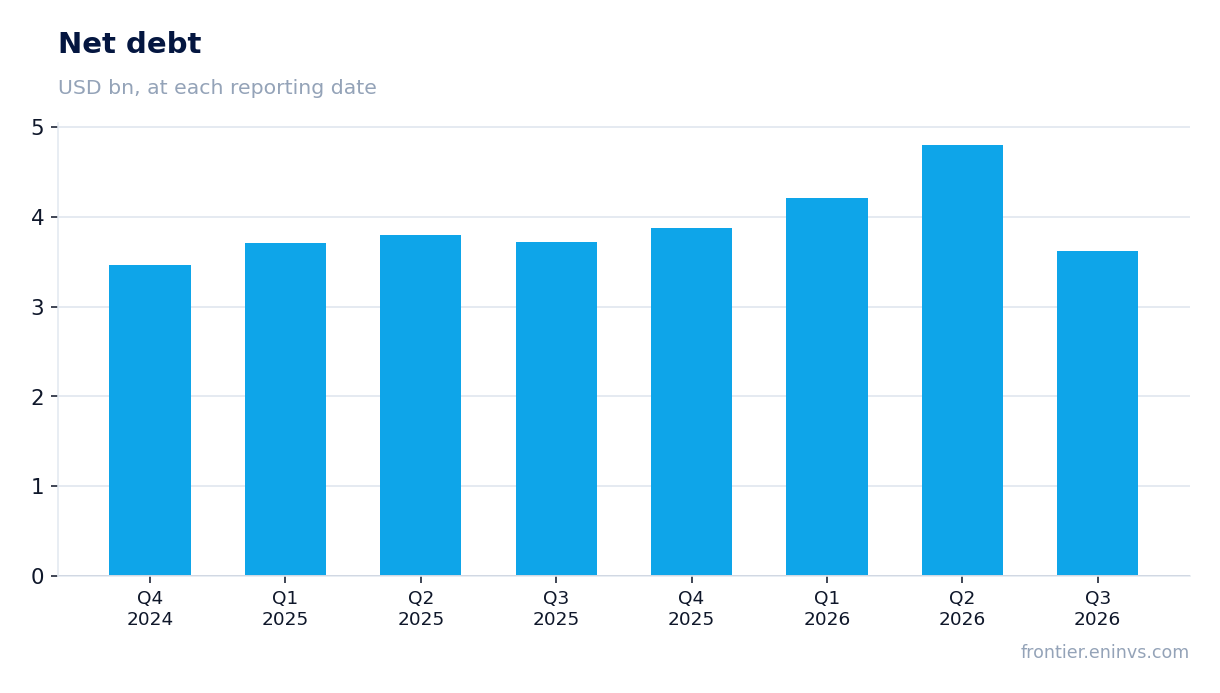
Net debt was $4.8bn on 30 June 2026 and $3.6bn on 30 September. A $1.2bn reduction over the quarter is direct evidence that the one-off gain was received in cash rather than accrued. This is the strongest part of the report.
Over twelve months, however, the picture is more modest: net debt was $3.7bn on 30 September 2025 and is $3.6bn now, a reduction of just $0.1bn. The third-quarter one-off returned debt to its level of a year ago rather than taking it to a new one. Before the third quarter debt had been rising: from $3.7bn at the end of September 2025 to $4.8bn at the end of June 2026.
Operating cash flow and capital expenditure for the third quarter were not disclosed, so it is impossible to say how much cash came from operations and how much from the one-off. In the second quarter operating cash flow was $211.6m against capital expenditure of $446.5m, meaning investment exceeded operating cash flow. If that proportion held, the third-quarter debt reduction is almost entirely explained by the one-off gain.
Over twelve months net debt barely moved: from $3.7bn to $3.6bn, so the one-off merely returned debt to its previous level
Comparing the two balance-sheet dates – 30 September 2025 and 30 September 2026 – shows net debt down by just $0.1bn, from $3.7bn to $3.6bn. The $1.2bn quarterly reduction looks large, but it offset the debt increase of the preceding three quarters.
This changes how the report should be read. The one-off did not create a cushion; it closed a gap accumulated over the year. Assessing leverage requires a debt-to-EBITDA ratio, but third-quarter EBITDA was not disclosed, and without it the direction of leverage cannot be determined. Absolute debt fell, but there is no basis to call that a reduction in leverage.
What to watch next: disclosure of third-quarter operating cash flow and capital expenditure. If operating cash flow remains below capital expenditure, debt will start rising again once the one-off is exhausted.
An 86.3% return on equity reflects the one-off gain, not a sustainable return on capital
An 86.3% return on equity looks exceptional, but it is calculated on profit in which $900.4m came from a one-off gain. Without it, quarterly profit would have been an order of magnitude smaller and return on equity would have returned to the company's usual level.
For comparison: a year earlier third-quarter net profit was $108.9m on revenue of $398.2m, a margin of 27.3%. Even that margin is above the operating one, which points to recurring income below the operating line already then. But 236.3% is an anomaly, not a new level.
Until the company discloses the composition of profit, an 86.3% return on equity cannot be used as a valuation anchor. It describes one quarter, not the business.
Operating figures for the third quarter were not disclosed, which makes it impossible to separate the one-off from the recurring business
The third-quarter report contains no EBITDA, operating profit, operating cash flow or capital expenditure. Only revenue, net profit and net debt are given. Such a data set does not allow a valuation: neither EV/EBITDA nor free cash flow can be calculated.
The second quarter shows operating profit of $22.0m on revenue of $392.9m, and capital expenditure of $446.5m, which exceeds operating cash flow of $211.6m. If the structure held in the third quarter, the business invests more than it earns, and the one-off gain closed that gap.
For an investor this is the main risk of the report: without operating data it is impossible to tell whether the revenue decline is temporary or structural, and impossible to value the company. The next report with a full set of figures will be decisive.
Bottom line
The strong part of the report is cash: net debt fell from $4.8bn to $3.6bn over the quarter, confirming the one-off gain was actually received. The weak part is operations: revenue has fallen for four straight quarters, the pace of decline rose from minus 1.5% to minus 4.3%, and operating figures were not disclosed. The $900.4m profit and 86.3% return on equity are the consequence of a one-off gain, not a new level of profitability. Over the year debt barely changed, so the one-off closed an accumulated gap rather than creating a cushion. The question for a holder now is whether the revenue decline will stop and whether operating cash flow will return above capital expenditure; until then the share looks neutral.
Open the company's financial profile CPT →
See also: market overview · valuation map · stock screeners