MONOLITHIC POWER SYSTEMS INC: revenue tops $1 billion for the first time, and one end market supplied most of the gain
On 29 October MONOLITHIC POWER SYSTEMS INC reported results for the third quarter of 2026. Revenue came in at $1,202.4 million (+63.1% year on year), operating profit at $357.7 million, net profit at $271.1 million, and operating cash flow at $289.9 million. Growth accelerated from the second quarter (+47.6%), but it rests on the Enterprise Data segment, and the net margin slipped from 24.2% to 22.5% over the year. With an EV/EBITDA of 72.4 that matches its own three-year average and a portal-model upside of +16%, the share looks rather attractive than not, though the cushion rests on continued growth rather than on price.
Key takeaways
— Revenue rose 63.1% year on year, and one segment, Enterprise Data, supplied $506.7 million of the $1,202.4 million
— The net margin slipped from 24.2% to 22.5% over the year even as the gross margin rose to 55.4%
— A one-off $453.4 million buyback drained cash, but net debt remains negative
— Operating cash flow of $289.9 million trails net profit of $271.1 million only by working-capital timing
— A dividend yield of 0.63% is not the argument that holds the share up
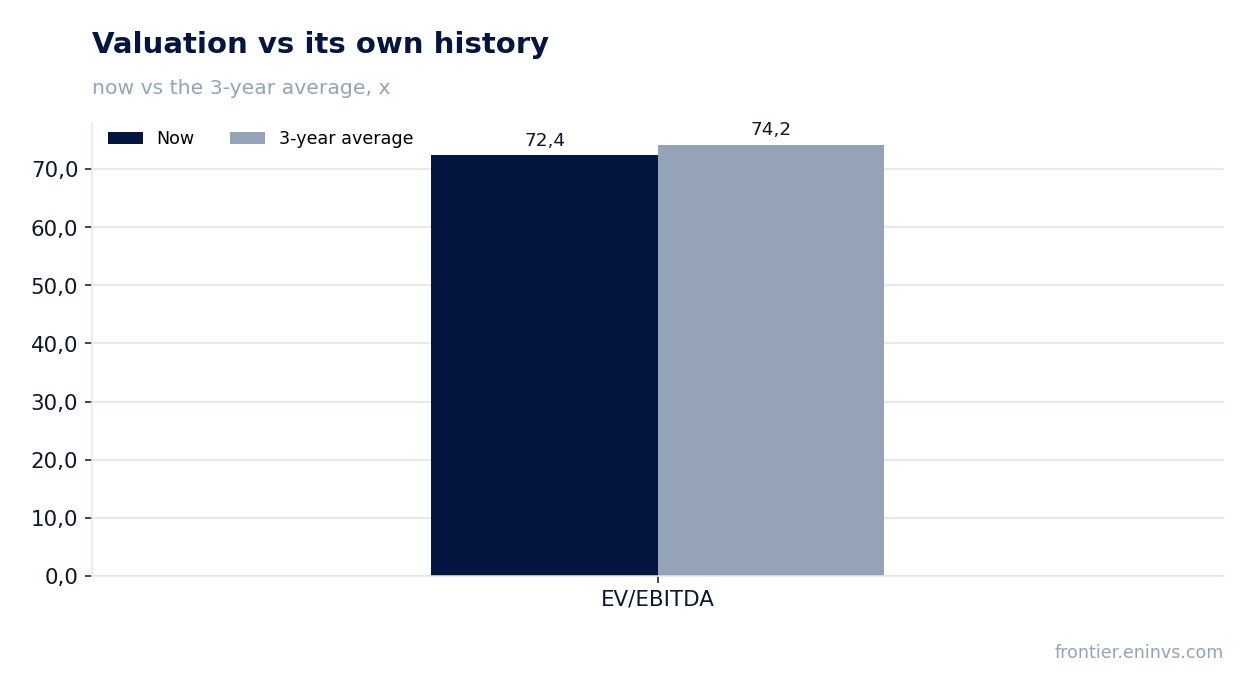
— EV/EBITDA of 72.4 sits right on its own three-year average of 74.2, and that is not cheap
— Fourth-quarter guidance of $1,315–1,385 million sets up another step up
Attractiveness
Key figures, USD bn
| Metric | Q3 2025 | Q3 2026 | Change |
|---|---|---|---|
| Revenue | 0.74 | 1.20 | +63.1% |
| EBITDA | 0.21 | — | — |
| Operating profit | 0.20 | 0.36 | +83.3% |
| Net profit | 0.18 | 0.27 | +52.1% |
| Operating cash flow | 0.24 | 0.29 | +21.2% |
| Capex | 0.04 | — | — |
| EBITDA margin | 28.3% | — | — |
| Net margin | 24.2% | 22.5% | -1.7 pp |
Revenue rose 63.1% year on year, and one segment, Enterprise Data, supplied $506.7 million of the $1,202.4 million
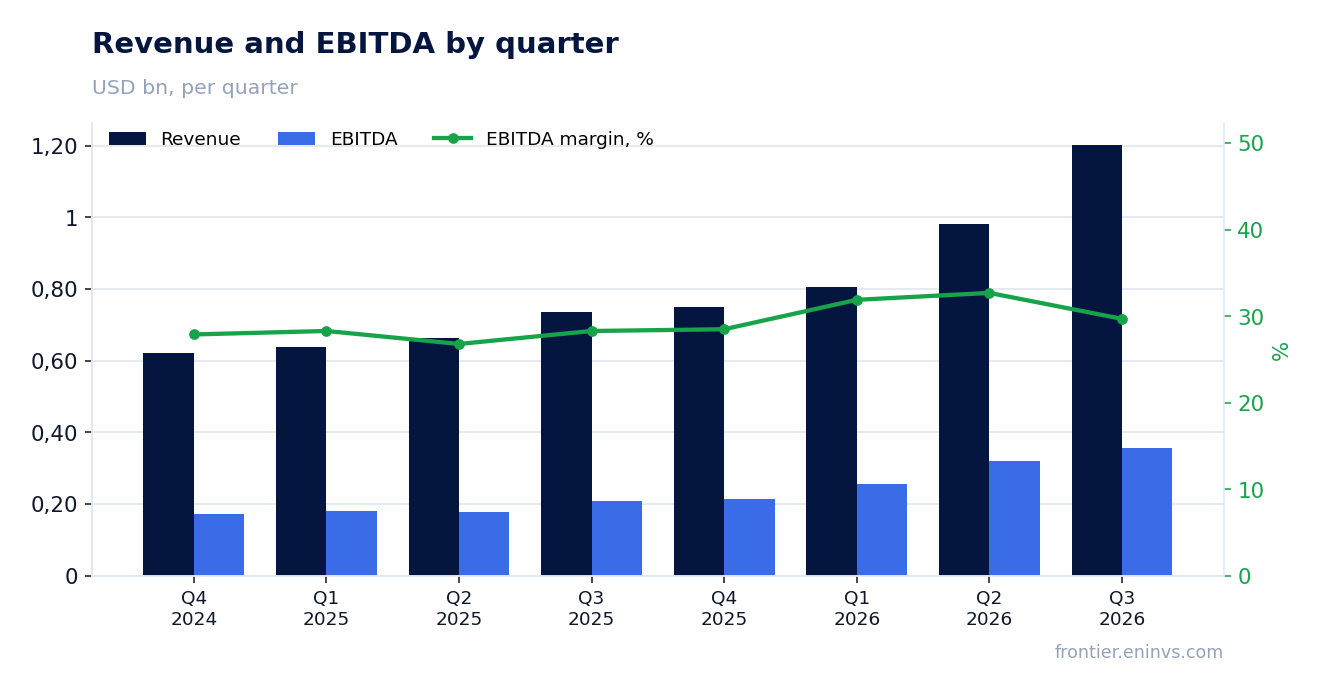
Third-quarter 2026 revenue was $1,202.4 million, the first time the company has crossed a billion in a quarter. Year on year the gain was 63.1%, quarter on quarter 22.6%. Growth accelerated: the second quarter showed +47.6% year on year.
Enterprise Data supplied almost half the revenue – $506.7 million, or 42.1% versus 38.8% a quarter earlier. The segment grew 164.6% year on year and 33.2% quarter on quarter. The company attributes this to demand for power solutions for AI and servers.
Communications was the second-largest contributor: $187.4 million, up 134.7% year on year, with its share rising to 15.6%. Storage & Computing, by contrast, fell 3.8% quarter on quarter to $192.2 million, Automotive added 19.2% year on year to $180.7 million, Industrial 29.0% to $71.4 million, and Consumer shrank 11.6% to $64.0 million.
The picture is concentrated: two of six segments supplied the bulk of the gain, and both are tied to data infrastructure and communications. That explains both the strength of growth and its fragility – if AI equipment demand slows, revenue loses its main engine.
The net margin slipped from 24.2% to 22.5% over the year even as the gross margin rose to 55.4%
The gross margin in the third quarter was 55.4% versus 55.1% a year earlier, meaning cost of revenue grew slower than revenue. The operating margin rose to 29.7% from 26.5% a year earlier.
Below the operating line, however, expenses ate the margin. Operating expenses rose 45.9% year on year to $307.9 million, including research at $140.6 million and selling, general and administrative at $167.3 million. Inside them sits stock-based compensation: $106.3 million versus $53.5 million a quarter earlier, so the charge nearly doubled.
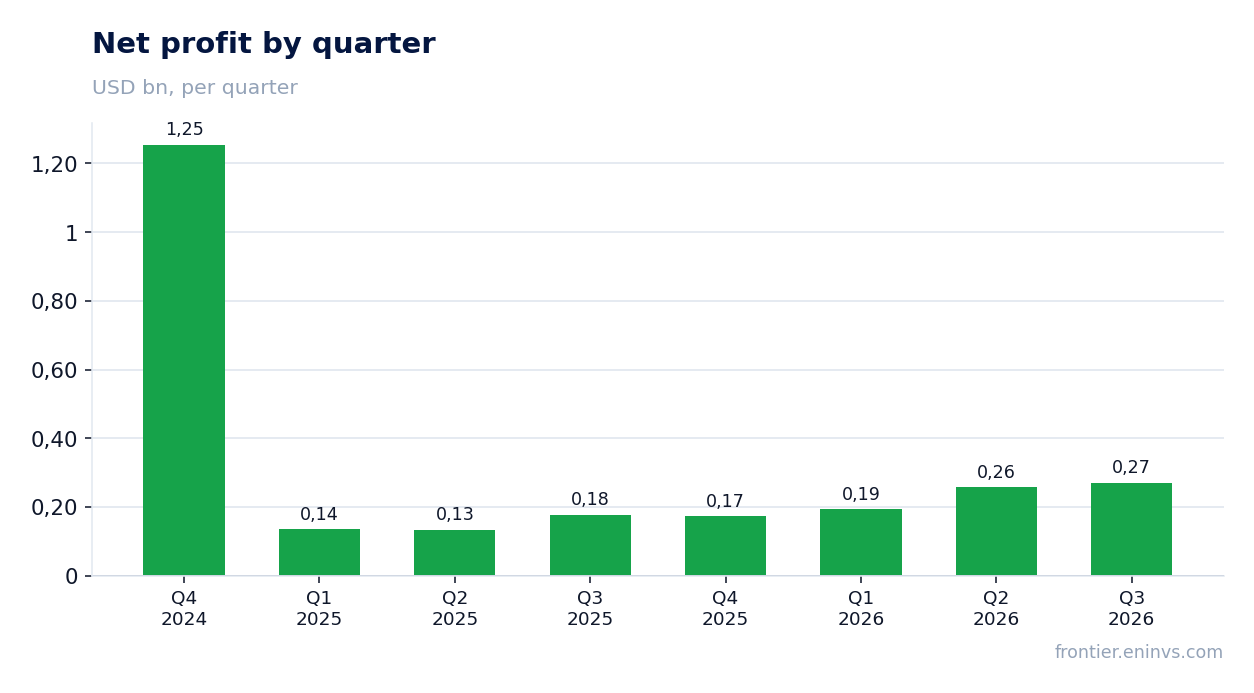
The tax rate also played a role: income tax expense was $95.6 million versus $25.8 million a year earlier. As a result net profit rose 52.1% to $271.1 million, but its share of revenue fell to 22.5% from 24.2%.
On a non-GAAP basis the picture differs: net profit of $402.7 million, or $8.19 per share, up 77.3% year on year. The gap to GAAP is mostly stock-based compensation, and it shows what staff retention costs the company.
A one-off $453.4 million buyback drained cash, but net debt remains negative
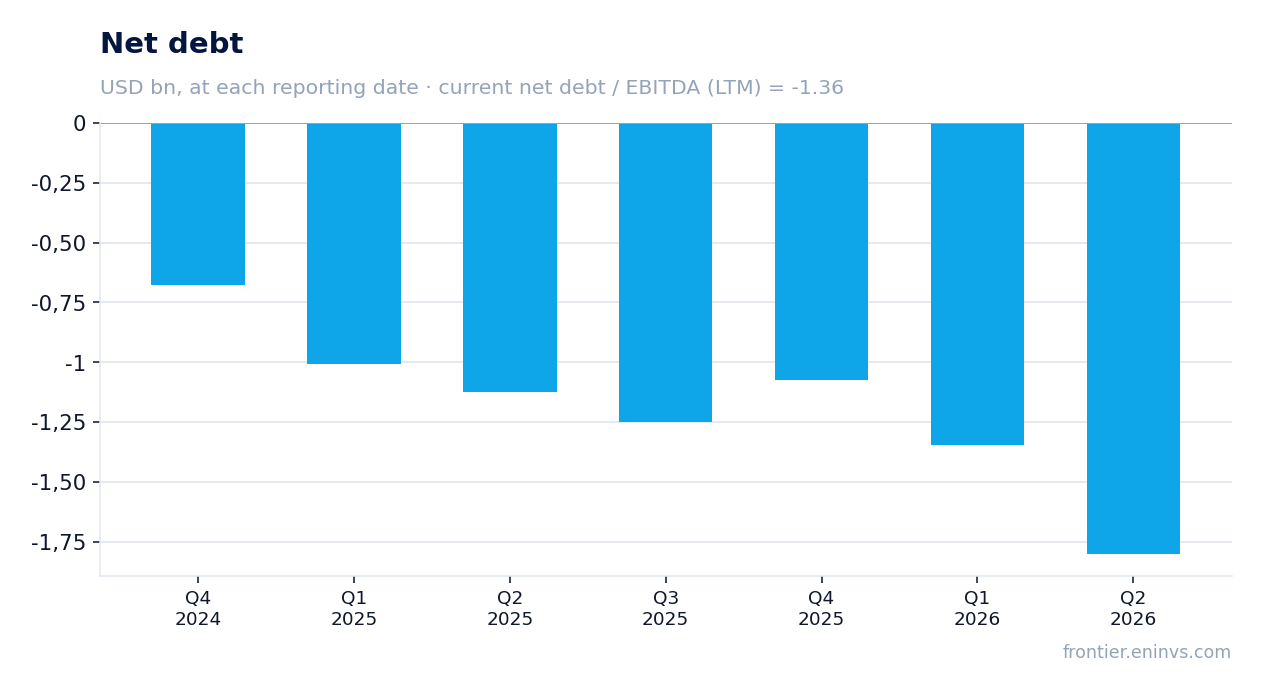
Cash and short-term investments fell over the quarter from $1,413.8 million to $1,091.2 million. The report names the reason directly: the company repurchased $453.4 million of stock versus $4.0 million in the second quarter. In October the board added another $500 million to the programme, bringing total authorisation to $1 billion.
Operating cash flow for the quarter was $289.9 million versus $227.9 million a quarter earlier. That would have covered only part of the buyback, so the difference was funded from cash. Net debt at the last annual balance sheet was minus $1,075.2 million, meaning the company sits on a net cash cushion.
The ratio of net debt to EBITDA over the last twelve months is minus 1.36. That is a level, not a direction: comparing it with prior periods is not possible on the available data. What matters is that there is no debt burden, and the buyback does not create one.
Inventories rose to $764.9 million from $675.8 million, yet days of inventory fell to 130 from 140. Receivables rose to $461.6 million, with days sales outstanding at 35 versus 32. Working capital is growing with revenue, which is normal for this pace.
Operating cash flow of $289.9 million trails net profit of $271.1 million only by working-capital timing
Operating cash flow of $289.9 million came in above net profit of $271.1 million, meaning the business generates cash faster than the income statement shows. The gap is small, but the sign matters: the company is not funding growth with paper profit.
Capital expenditure for the quarter is not disclosed in the filing, so free cash flow cannot be calculated. In prior quarters capex ranged from $40–82 million, and at this revenue scale it does not look burdensome.
The $453.4 million buyback is not an operating expense but a capital-allocation decision. It reduced cash without touching debt, which is why net debt remains negative. For a holder this means the company returns capital without adding risk.
Free cash flow after the buyback was negative this quarter, but that is the consequence of a one-off decision, not business weakness. Operating generation remains positive and is growing with profit.
A dividend yield of 0.63% is not the argument that holds the share up
The trailing twelve-month dividend yield is 0.63%. Against a market capitalisation of $58.4 billion that is a small sum relative to profit, and the company returns capital mainly through buybacks rather than the dividend.
Our estimate: at the current profit level and current policy the dividend will stay symbolic. It is tied to profit, and profit is growing, but the payout is small and the company prefers to invest in capacity – the stated goal is to lift revenue support from $6 billion to $8 billion by the second half of 2027 and to $10 billion thereafter.
A yield of 0.63% is below the key rate and is not a reason to hold the share. For this name the dividend is a formality rather than an income source, and the verdict is not built on the payout.
A fall in profit or a rise in capital spending could reduce the payout, but for now the company is growing both without straining cash. The risk here is not the dividend but that it does not matter.
EV/EBITDA of 72.4 sits right on its own three-year average of 74.2, and that is not cheap
EV/EBITDA over the last twelve months is 72.4, against a three-year average of 74.2. The multiple sits at its own history, a deviation of minus 2%, meaning the share is neither dearer nor cheaper than usual.
P/E over the last twelve months is 94.0. That is a high valuation justified only by continued growth. With revenue of $2,800.0 million and EBITDA of $791.2 million over the last twelve months, the market is paying for the future, not current profit.
The portal model puts upside to fair value at +16%. This is our own estimate, built on EBITDA growth and a target multiple, not a market consensus or a target price.
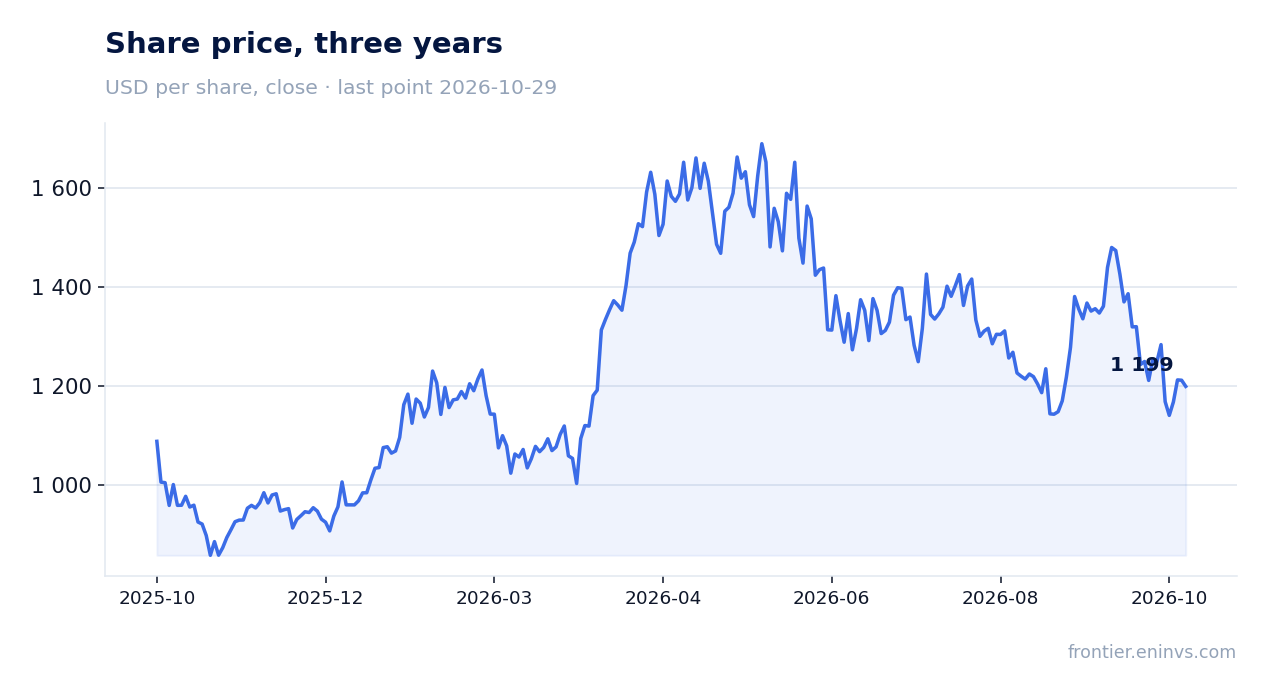
The market reacted cautiously: the share lost 1.0% on the release day and 1.0% from the release to 29 October. At this multiple, the reaction to a strong report shows expectations are already high.
Fourth-quarter guidance of $1,315–1,385 million sets up another step up
The company guides fourth-quarter 2026 revenue to a range of $1,315–1,385 million. That is 9–15% above the third quarter, and even the low end implies continued growth.
Gross margin is guided at 55.2–55.8% GAAP and 55.5–56.1% non-GAAP, so the company does not expect it to fall. GAAP operating expenses are guided at $334–342 million, above the third quarter but mostly due to stock-based compensation, which is budgeted at $121–125 million.
What to watch in the next report: holding Enterprise Data above 40% and whether Communications and Automotive can pick up growth if the AI segment slows. Another point is the trajectory of the non-GAAP margin, which is currently growing faster than GAAP.
The guidance contains no segment breakdown, so concentration cannot be checked in advance. But if the company hits the top end, the annual growth rate stays in double digits, and that is the main argument for the current valuation.
Valuation on the latest reported figures
| Metric | Value |
|---|---|
| Market cap | 58.4 bn USD |
| P/E (LTM) | 94.0 |
| EV/EBITDA (LTM) | 72.4 |
| P/B | 16.53 |
| Net debt / EBITDA (LTM) | -1.36 |
| ROE | 28.4% |
| Dividend yield (12m) | 0.6% |
| EV/EBITDA, 3-year average | 74.2 |
Bottom line
What was strong in the report was everything tied to growth: revenue crossed a billion for the first time, accelerated to +63.1%, the gross margin rose, and operating cash flow stayed positive. What was one-off was the $453.4 million buyback, which drained cash but left debt untouched. The real question for a holder is not profit but price: EV/EBITDA of 72.4 sits on its three-year average, P/E of 94.0 assumes continued growth, and the portal model offers only +16%. The share looks rather attractive, but the cushion is thin and rests on hitting fourth-quarter guidance.
Open the company's financial profile MPWR →
See also: market overview · valuation map · stock screeners