Regency Centers: net income fell 31.4%, yet FFO rose and the dividend was raised 6%

On November 5 Regency Centers released third-quarter 2026 results. Net income attributable to common shareholders was $75.1 million, down 31.4% year on year, but it includes a $65.1 million impairment and a $23.8 million gain on real estate sales. Nareit FFO rose to $230.8 million, or $1.23 per share, same-property NOI grew 5.1%, and the board raised the quarterly dividend to $0.800 per share. At the current price the stock looks rather attractive: the dividend is growing, pro-rata net debt to TTM operating EBITDA is 4.9x, and the net income decline reflects one-offs rather than operations.
Key takeaways
— Net income fell 31.4% because of a $65.1 million impairment, not because of operations
— FFO rose to $230.8 million, up 8.1% year on year
— Same-property NOI grew 5.1%, with base rent contributing 4.0% of that growth
— Leverage at 4.9x pro-rata EBITDA remains comfortable for a REIT
— The dividend was raised 6% to $0.800 per share against $1.23 of FFO
— The portfolio is 97.0% leased, and blended cash rent spreads reached 11.9%
Attractiveness
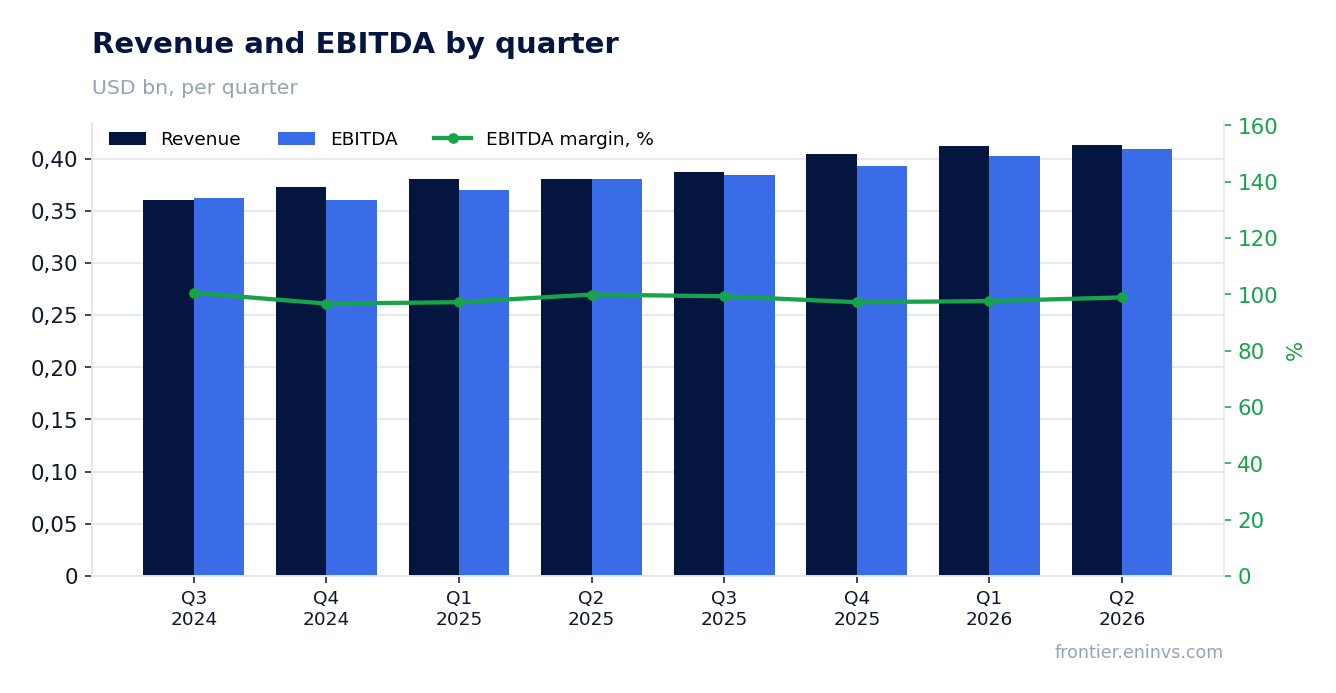
Key figures, USD bn
| Metric | Q3 2025 | Q3 2026 | Change |
|---|---|---|---|
| Revenue | 0.39 | — | — |
| EBITDA | 0.38 | — | — |
| Operating profit | 0.28 | — | — |
| Net profit | 0.11 | 0.08 | -31.4% |
| Operating cash flow | 0.22 | — | — |
| Capex | 0.00 | — | — |
| EBITDA margin | 99.3% | — | — |
| Net margin | 28.2% | — | — |
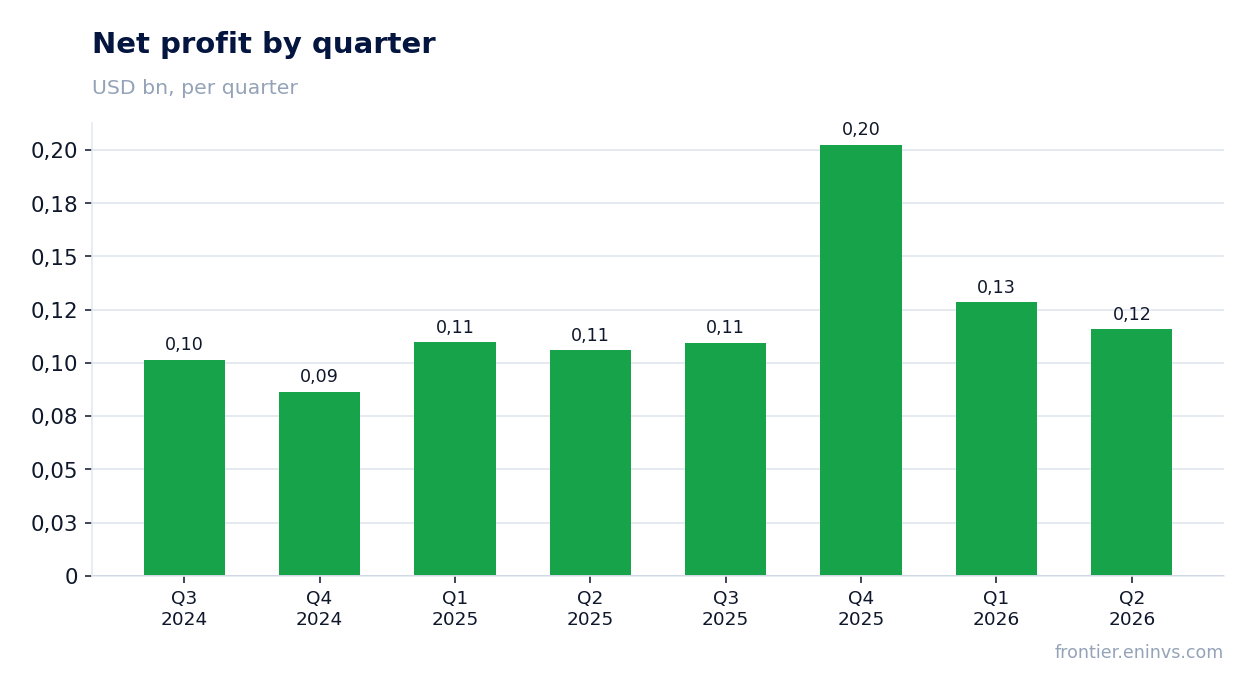
Net income fell 31.4% because of a $65.1 million impairment, not because of operations
For the third quarter of 2026, net income attributable to common shareholders was $75.1 million, or $0.41 per diluted share, against $106.0 million, or $0.58, a year earlier. The 31.4% decline is fully explained by two one-off items: a $65.1 million real estate impairment ($0.35 per share) and a $23.8 million gain on real estate sales ($0.13 per share). Without the impairment, net income would have been higher than last year's.
The impairment does not reflect the current earnings power of the portfolio: it marks the value of specific assets, not a deterioration in rental cash flow. The gain on sales, by contrast, adds to the result but does not recur quarter to quarter. For a REIT, FFO, which excludes both items, is the better gauge of operations.
FFO rose to $230.8 million, up 8.1% year on year
Nareit FFO for the third quarter of 2026 was $230.8 million, or $1.23 per diluted share, against $213.5 million, or $1.15, in the same period of 2025. The 8.1% increase in dollars and 7.0% per share is above net income growth and reflects the resilience of rental cash flow. Core Operating Earnings, which further excludes non-cash items, was $220.6 million, or $1.18 per share, against $202.6 million, or $1.09.
The gap between FFO and Core Operating Earnings is small – about $10 million – and consists of straight-line rent and market-rate amortisation adjustments. That means earnings quality is high: most of FFO is backed by cash flow rather than accounting accruals. The company raised full-year FFO guidance to $4.86–$4.88 per share.
Same-property NOI grew 5.1%, with base rent contributing 4.0% of that growth
Same-property NOI for the third quarter of 2026 grew 5.1% year on year to $289.1 million. Base rent contributed 4.0 percentage points of that growth – organic rate increases rather than one-off fees or filling vacant space. Total NOI rose 7.6% to $303.2 million, faster than the same-property figure thanks to acquisitions and development projects.
Same-property occupancy reached 97.0%, up 60 basis points year on year. The commenced share was 95.1%, up 80 basis points. Blended new and renewal lease spreads were 11.9% on a cash basis and 21.8% on a straight-lined basis, indicating landlord pricing power. The company raised full-year same-property NOI growth guidance to 4.25%+.
Leverage at 4.9x pro-rata EBITDA remains comfortable for a REIT
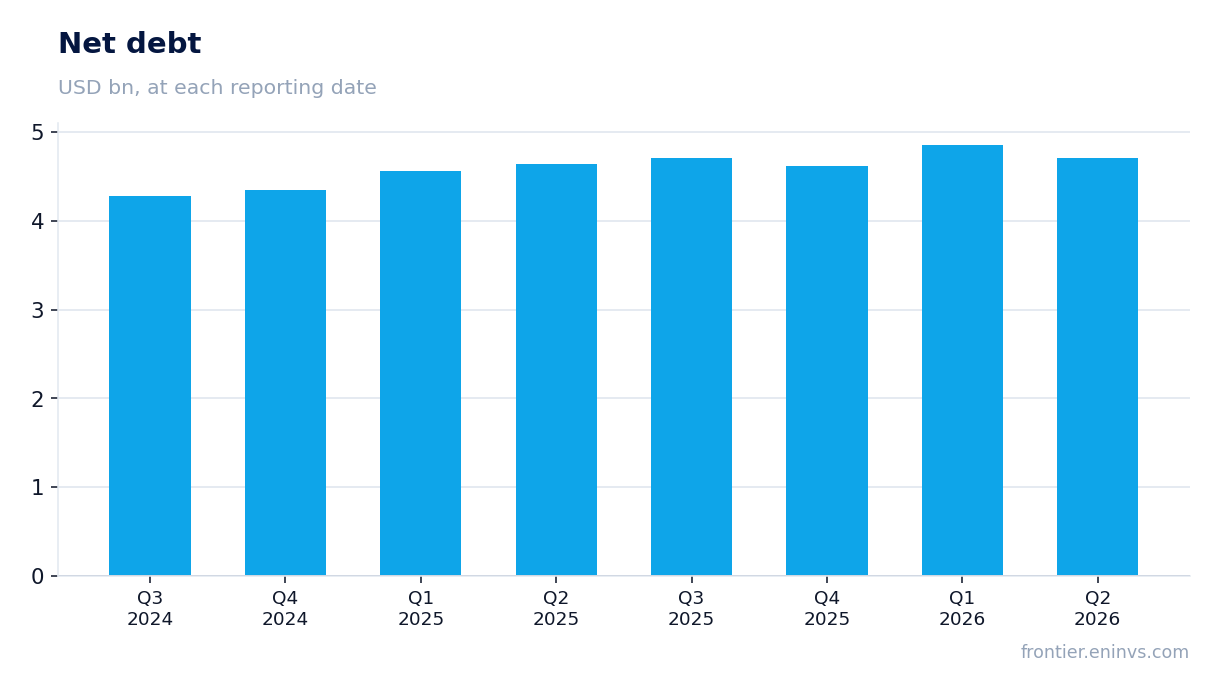
At the end of the third quarter of 2026, pro-rata net debt and preferred stock to trailing-twelve-month operating EBITDA was 4.9x. That is a moderate level for a retail REIT: it leaves room to manoeuvre and does not pressure the dividend. On the balance sheet, net debt at the latest annual reporting was $4,618.6 million, and at the end of the second quarter of 2026 it was $4,711.6 million.
The company has about $1.4 billion of available capacity under its revolving credit facility, covering refinancing and development needs. Interest expense and preferred dividends are guided at about $250 million for the year. With quarterly FFO of $230.8 million, interest coverage remains high.
The dividend was raised 6% to $0.800 per share against $1.23 of FFO
The board declared a quarterly dividend of $0.800 per share, 6% above the previous level. It is payable on January 5, 2027 to shareholders of record on December 14, 2026. With annual FFO of $4.86–$4.88 per share, the annual payout will be $3.20, or about 66% of FFO – a moderate payout ratio for a REIT.
At the current price the dividend yield of about 4.5–5% (calculated from the $3.20 annual payout) looks attractive relative to the policy rate, although the exact price is not given in the facts. The company has consistently raised the payout: the 6% increase matches FFO growth. The risk of a dividend cut is low as long as FFO grows and leverage stays near 4.9x.
The portfolio is 97.0% leased, and blended cash rent spreads reached 11.9%
Same-property occupancy of 97.0% is a high level for shopping centres, and it rose 60 basis points over the year. Cash rent spreads of 11.9% on new and renewal leases mean new rates are above old ones, so rental revenue grows even without adding space. Over twelve months the company signed about 7.0 million square feet of leases at an average spread of 11.5%.
The portfolio is expanding: $101 million of projects were started in the quarter, including Redlands Marketplace at $46 million and The Shops at Fall Hill at $24 million. Total in-process projects stand at $682 million, 46% of which has already been funded. That provides a pipeline for future NOI growth, albeit with capital spending.
Bottom line
The report's strength remains operational resilience: FFO grew 8.1%, same-property NOI 5.1%, occupancy is 97.0%, and the dividend was raised 6%. The 31.4% decline in net income is the result of impairment and gains on sales, not a deterioration in the rental business. Leverage at 4.9x and $1.4 billion of available credit capacity pose no threat to payouts. The question for a holder now is whether rent spreads near 12% persist and whether further impairments will be required. At the current price the stock looks rather attractive for a conservative, dividend-oriented investor.
Open the company's financial profile REG →
See also: market overview · valuation map · stock screeners