Charles Schwab: profit up 23.2%, but revenue growth decelerated to 16.9%
In Q3 2026, Charles Schwab increased revenue to $7,171 million, up 16.9% year-over-year. Net profit reached $2,906 million, adding 23.2% YoY, while net margin rose to 40.5% from 38.4% a year earlier. However, compared to Q2 2026, revenue growth decelerated: 16.9% vs 20.9%. The share is held in our model strategies US Financials (banks). At the current price, the stock looks neutral: strong profitability and profit growth are balanced by decelerating revenue and lack of data on dividends and valuation.
Key takeaways
— Revenue grew 16.9% YoY, but this is slower than 20.9% in Q2 2026
— Net profit added 23.2% YoY, outpacing revenue growth due to margin expansion
— Net margin rose to 40.5% from 38.4% a year earlier
— Net debt at end-2025 was minus $23,831 million, indicating a net cash position
— Operating cash flow in Q2 2026 was $4,300 million, but Q3 2026 data is missing
— ROE is 7.63%, which is lower than one might expect given such a high margin
Attractiveness
Key figures, USD bn
| Metric | Q3 2025 | Q3 2026 | Change |
|---|---|---|---|
| Revenue | 6.13 | 7.17 | +16.9% |
| Net profit | 2.36 | 2.91 | +23.2% |
| Operating cash flow | 0.54 | — | — |
| Capex | 0.14 | — | — |
| Net margin | 38.4% | 40.5% | +2.1 pp |
Revenue grew 16.9% YoY, but this is slower than 20.9% in Q2 2026
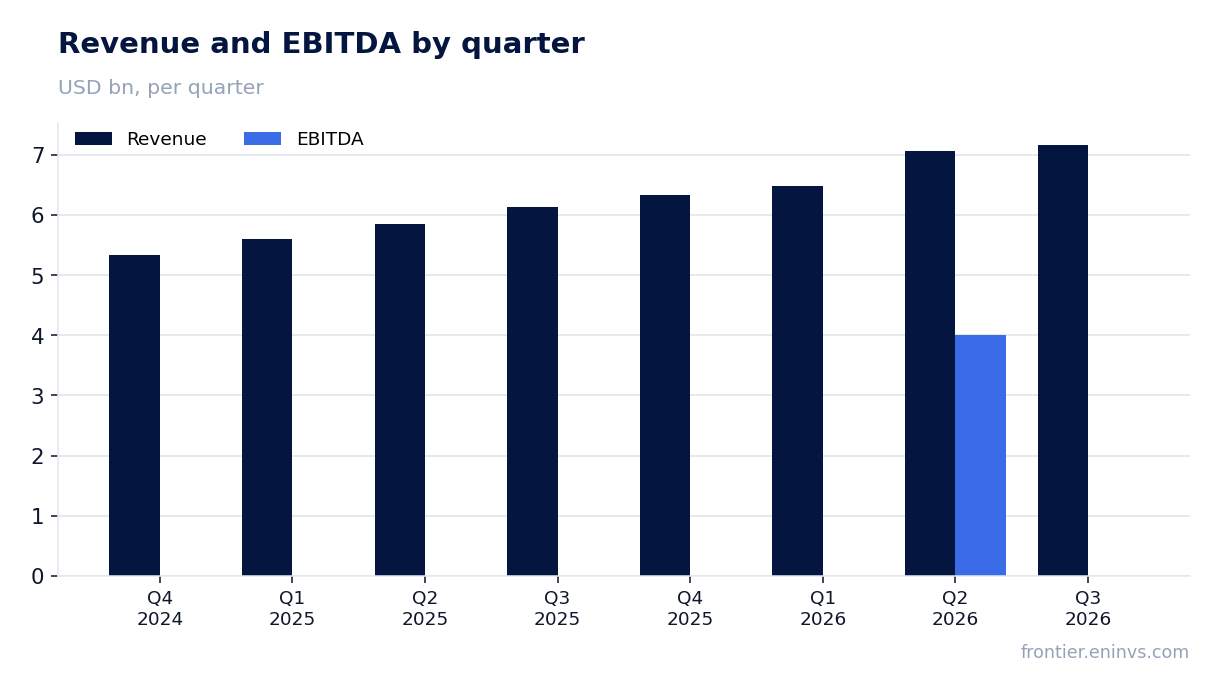
In Q3 2026, Charles Schwab's revenue reached $7,171 million, up 16.9% from the same period last year. This continues the growth trend, but the pace decelerated compared to Q2 2026, when revenue grew 20.9% YoY.
The deceleration may reflect a high base effect as well as possible changes in market conditions. In absolute terms, revenue has grown sequentially: from $6,482 million in Q1 2026 to $7,072 million in Q2 and $7,171 million in Q3. However, the annual growth rate has slowed, which is important for assessing the sustainability of the trend.
Net profit added 23.2% YoY, outpacing revenue growth due to margin expansion
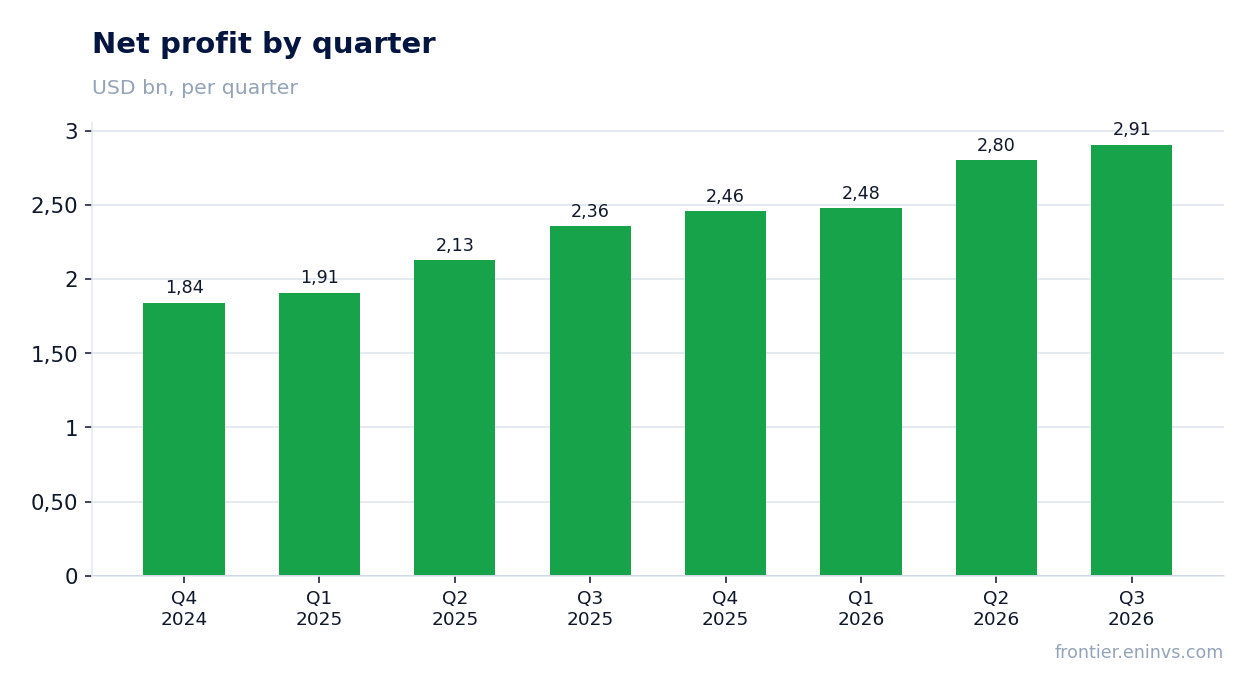
Net profit in Q3 2026 was $2,906 million, up 23.2% from a year earlier. Profit growth outpaced revenue growth, indicating improved profitability.
Net margin rose to 40.5% from 38.4% in Q3 2025. This means the company not only increased revenue but also improved cost control or benefited from a change in revenue mix. However, without data on profit components, it is difficult to say what exactly drove this.
Net margin rose to 40.5% from 38.4% a year earlier
Net margin in Q3 2026 reached 40.5%, up from 38.4% a year earlier. This is a significant improvement, which may be due to increased operational efficiency or lower relative costs.
A high margin of 40.5% is a strong indicator for the financial sector. However, the sustainability of this level depends on the company's ability to contain costs and generate revenue. In the next report, one should monitor margin dynamics to understand whether this is a one-off improvement or a new level.
Net debt at end-2025 was minus $23,831 million, indicating a net cash position
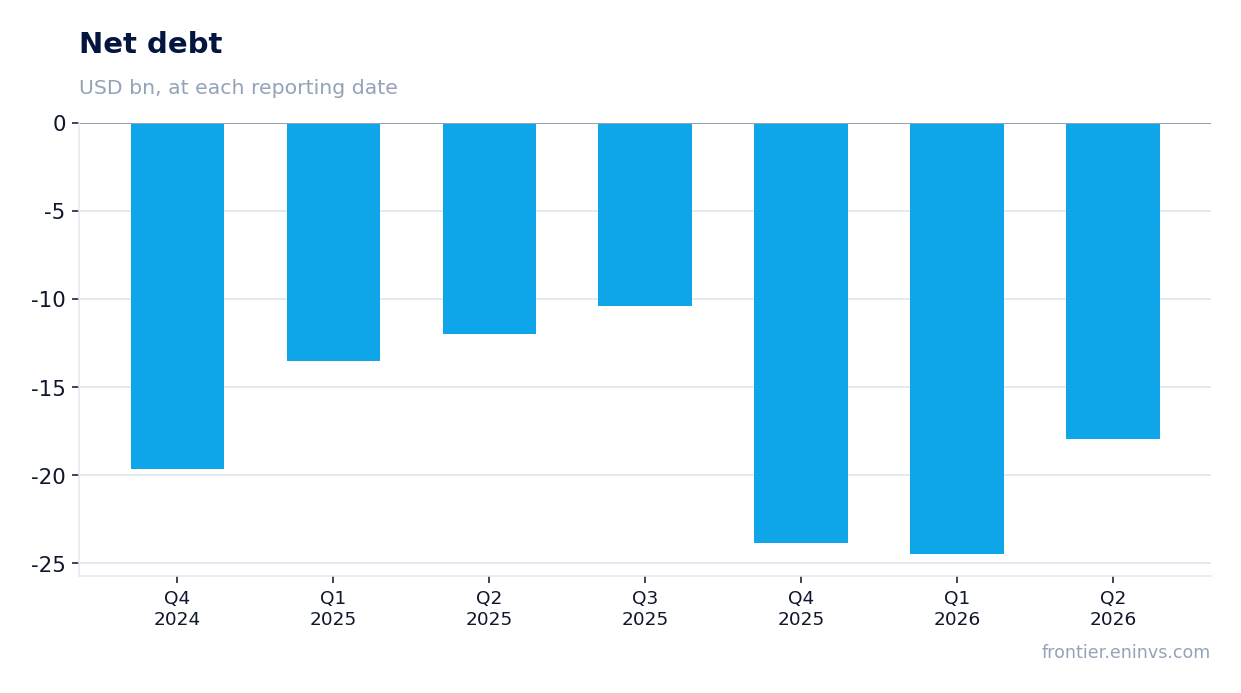
At end-2025, Charles Schwab's net debt was minus $23,831 million, meaning the company had a net cash position. This indicates that cash and equivalents exceeded debt obligations.
A net cash position reduces financial risks and gives the company flexibility. However, net debt data for Q3 2026 is missing, so it is impossible to assess whether this position persisted. In previous quarters, net debt fluctuated: for example, in Q1 2026 it was minus $24,489 million, and in Q2 – minus $17,931 million.
Operating cash flow in Q2 2026 was $4,300 million, but Q3 2026 data is missing
In Q2 2026, Charles Schwab's operating cash flow was $4,300 million. This is a substantial inflow that supports the company's ability to fund operations and return capital to shareholders.
However, Q3 2026 operating cash flow data is missing, which limits analysis. In previous periods, the flow was volatile: for example, in Q1 2026 it was $7,342 million, while in Q4 2025 it was negative – minus $763 million. For a bank or broker, operating cash flow may reflect client fund movements, so its fluctuations are not always a sign of trouble.
ROE is 7.63%, which is lower than one might expect given such a high margin
Charles Schwab's return on equity (ROE) is 7.63%. This is a relatively low figure, especially given the high net margin of 40.5%.
A low ROE may indicate a conservative capital structure or that the company holds a significant amount of capital that does not generate proportional profit. For investors, this means that the efficiency of equity utilisation is lower than it could be. Combined with a net cash position, this may indicate underutilised capital, but also financial stability.
Bottom line
Charles Schwab delivered strong profit growth of 23.2% YoY and margin expansion to 40.5%, which is the main positive of the report. However, revenue growth decelerated to 16.9% from 20.9% in Q2, and the company did not disclose net debt and operating cash flow data for Q3. The low ROE of 7.63% amid high margin indicates possible inefficiency in capital utilisation. The question for a holder now is whether the company can accelerate revenue growth and improve return on capital, or whether the deceleration will become a sustained trend.
Open the company's financial profile SCHW →
See also: market overview · valuation map · stock screeners