Sappi: a $116m quarterly loss, and $34m EBITDA does not even cover interest on $1.9bn of debt
Contents
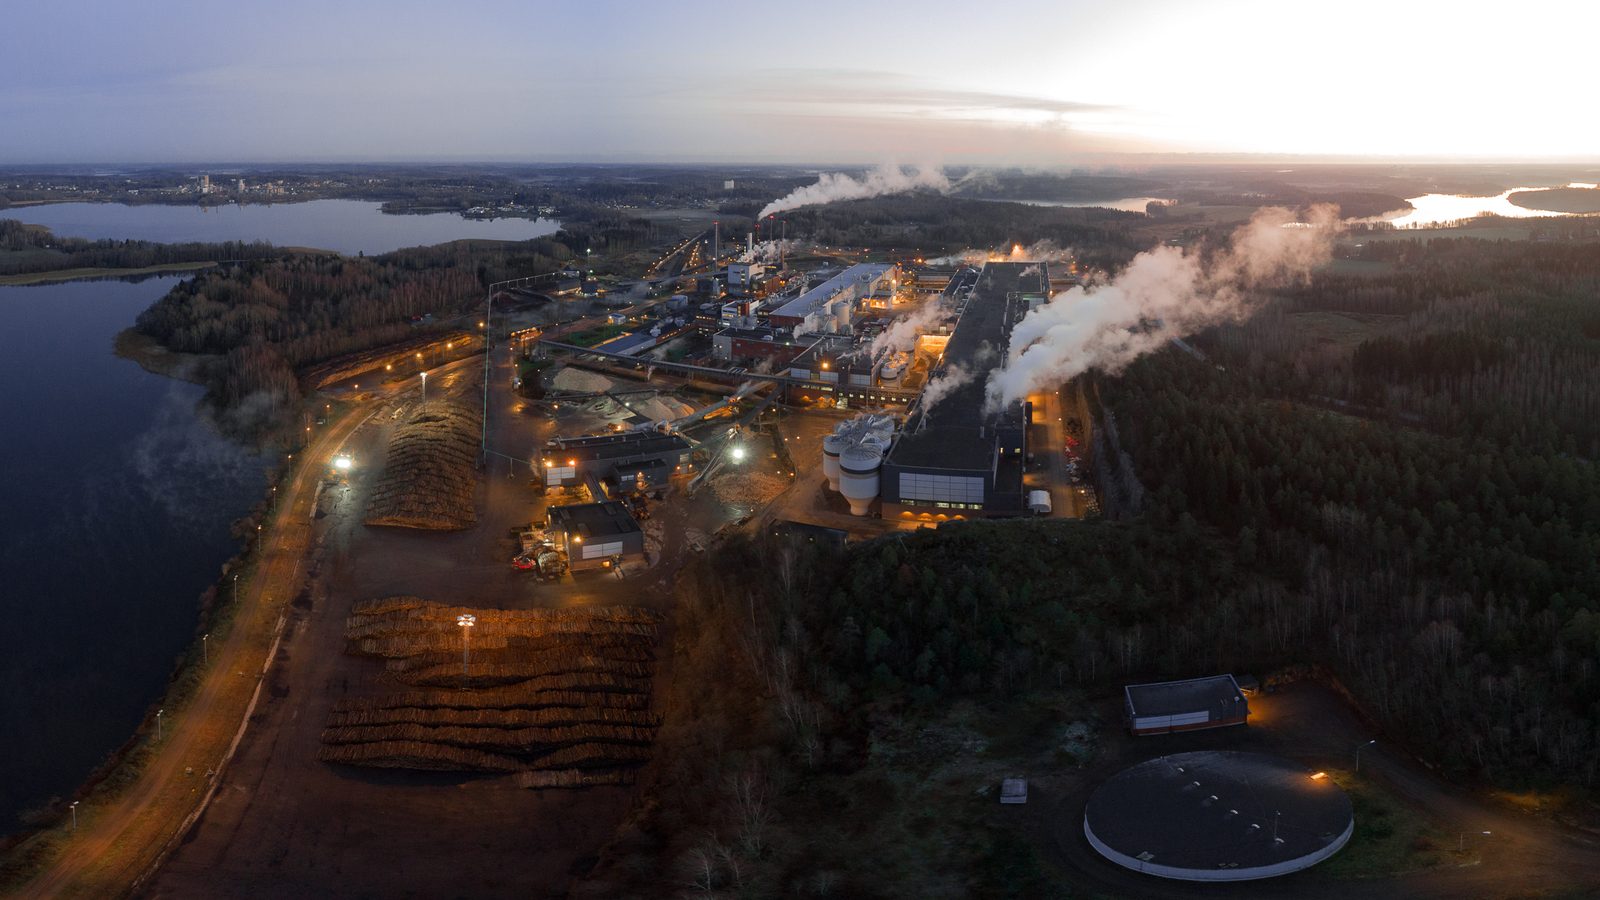
Sappi's fourth quarter of fiscal 2026 (July-September 2026) was weak on every key line: revenue of $1,322m, EBITDA of $34m (2.6% margin), an operating loss of $56m and a net loss of $116m (-8.8% margin). Net debt rose from $1.9bn to $1.9bn at 30 September 2026, while operating cash flow stayed negative at minus $10m against capital expenditure of $48m. Our conclusion: the share is rather unattractive – with a loss and debt 57 times quarterly EBITDA, there is no margin of safety in the valuation. Our view: the share is rather unattractive at the current price.
Our view: is there upside
Our view in numbers
| Metric | Our read |
|---|---|
| Verdict | Rather unattractive |
| Upside on the portal model | no portal model for this share |
| Strongest case for | A market capitalisation of $387m against quarterly revenue of $1.3bn means the market values the company very low, and any recovery in EBITDA could lead to a rapid share price rise. |
| Strongest case against | Debt of $1.9bn against quarterly EBITDA of $34m implies leverage of 57 times, and with negative cash flow the company cannot service it without new borrowing. |
| What would change the view | The verdict would move one step up if quarterly EBITDA sustainably exceeded $100m – that would bring the debt-to-EBITDA ratio below 20 times and restore market confidence. |
Key takeaways
— Revenue of $1,322m was almost flat year on year, but EBITDA collapsed to $34m at a 2.6% margin
— An operating loss of $56m and a net loss of $116m mark the third consecutive loss-making quarter
— Debt of $1.9bn against quarterly EBITDA of $34m implies leverage of 57 times
— Operating cash flow of minus $10m does not cover capital expenditure of $48m
— Return on equity of -27.3% with a market capitalisation of $387m means the market values the company below book value
— No dividends were paid, and with the current loss there is no basis for payouts
Key figures, USD bn
| Metric | — | Q3 2026 | Change |
|---|---|---|---|
| Revenue | — | 1.32 | — |
| EBITDA | — | 0.03 | — |
| Operating profit | — | -0.06 | — |
| Net profit | — | -0.12 | — |
| Operating cash flow | — | -0.01 | — |
| Capex | — | 0.05 | — |
| EBITDA margin | — | 2.6% | — |
| Net margin | — | -8.8% | — |
Revenue of $1,322m was almost flat year on year, but EBITDA collapsed to $34m at a 2.6% margin
Revenue in the fourth quarter of fiscal 2026 was $1,322m, down 5.6% from $1,363m a year earlier. The decline is modest but continues a pattern: a 1.0% fall in the first quarter of 2026, 1.0% growth in the second, and a decline again in the reported quarter.
More important, with revenue almost flat, EBITDA fell to $34m – a 2.6% margin. A year earlier in the same quarter EBITDA was $210m at a margin of around 15%. Such a gap cannot be explained by sales volumes alone: it points to a sharp squeeze in prices or a rise in costs that could not be passed on to customers.
The operating loss reached $56m and the net loss $116m. For a company with quarterly revenue above $1.3bn, this means fixed costs and depreciation are consuming the entire gross profit. Until revenue starts growing and the margin recovers, quarterly losses will remain the norm.
Revenue and EBITDA by quarter
| Period | Measure | bn USD |
|---|---|---|
| Q4 2024 | Revenue | 1.363 |
| Q1 2025 | Revenue | 1.347 |
| Q2 2025 | Revenue | 1.321 |
| Q4 2025 | Revenue | 1.287 |
| Q1 2026 | Revenue | 1.334 |
| Q2 2026 | Revenue | 1.334 |
| Q3 2026 | Revenue | 1.322 |
| Q4 2024 | EBITDA | 0.21 |
| Q1 2025 | EBITDA | 0.087 |
| Q2 2025 | EBITDA | 0.088 |
| Q4 2025 | EBITDA | 0.083 |
| Q1 2026 | EBITDA | −0.318 |
| Q2 2026 | EBITDA | −0.108 |
| Q3 2026 | EBITDA | 0.034 |
EBITDA margin
| Period | Measure | % |
|---|---|---|
| Q4 2024 | EBITDA margin | 15.4 |
| Q1 2025 | EBITDA margin | 6.5 |
| Q2 2025 | EBITDA margin | 6.7 |
| Q4 2025 | EBITDA margin | 6.4 |
| Q1 2026 | EBITDA margin | −23.8 |
| Q2 2026 | EBITDA margin | −8.1 |
| Q3 2026 | EBITDA margin | 2.6 |
An operating loss of $56m and a net loss of $116m mark the third consecutive loss-making quarter
The loss is not a one-off: in the first quarter of 2026 EBITDA was minus $318m, in the second minus $108m, and only in the reported quarter did it turn positive at $34m. The operating result has been negative for three consecutive quarters: minus $422m, minus $203m and minus $56m respectively.
The net loss of $116m is smaller than the operating loss, which points to a positive contribution from financial or tax items, but it does not change the picture: the company is losing money at the operating level. Return on equity of -27.3% confirms that shareholders' capital is being eroded.
For an investor, the key point is that the loss is not one-off. Three consecutive quarters of negative EBITDA and operating losses mean the problem is structural – either Sappi's product prices have fallen below cost or costs have risen irreversibly.
Net profit by quarter
| Period | Measure | bn USD |
|---|---|---|
| Q4 2024 | Net profit | 0.07 |
| Q1 2025 | Net profit | −0.02 |
| Q2 2025 | Net profit | −0.033 |
| Q4 2025 | Net profit | −0.037 |
| Q1 2026 | Net profit | −0.413 |
| Q2 2026 | Net profit | −0.181 |
| Q3 2026 | Net profit | −0.116 |
Debt of $1.9bn against quarterly EBITDA of $34m implies leverage of 57 times
Net debt at 30 September 2026 was $1.9bn – the same as at 30 June 2026 and $0.1bn more than a year earlier ($1.8bn at 30 June 2025). Debt is not growing catastrophically, but it is large relative to the company's ability to service it.
With quarterly EBITDA of $34m, the debt-to-EBITDA ratio is roughly 57 times – a figure that for an industrial company means current earnings will not even cover interest. Trailing twelve-month EBITDA is not disclosed in the facts, but three consecutive loss-making quarters make the annual picture no better than the quarterly one.
High debt limits options: the company cannot invest in growth without new borrowing, and rising rates make debt service even more expensive. Until EBITDA recovers to a level comparable with the debt, financial stability remains in question.
Net debt
at each reporting date
| Period | Measure | bn USD |
|---|---|---|
| Q4 2024 | Net debt | 1.31 |
| Q1 2025 | Net debt | 1.572 |
| Q2 2025 | Net debt | 1.83 |
| Q4 2025 | Net debt | 1.817 |
| Q1 2026 | Net debt | 1.836 |
| Q2 2026 | Net debt | 1.872 |
| Q3 2026 | Net debt | 1.931 |
Operating cash flow of minus $10m does not cover capital expenditure of $48m
Operating cash flow in the reported quarter remained negative at minus $10m. This means the company is not generating cash from core operations, even despite positive EBITDA of $34m: part of the profit is likely going into working capital or interest payments.
Capital expenditure was $48m, and it is financed not from operating cash flow but from new borrowing or existing reserves. Over the last twelve months operating cash flow was only $60m – insufficient to cover even annual capital expenditure, which in some quarters reached $182m.
Negative free cash flow is the main risk for shareholders: the company is forced to borrow to sustain production, and debt will rise if EBITDA does not recover.
Return on equity of -27.3% with a market capitalisation of $387m means the market values the company below book value
Return on equity of -27.3% is the direct result of losses: shareholders' equity is shrinking, and the market reflects this. With a market capitalisation of $387m and net debt of $1.9bn, enterprise value is around $2.3bn.
The ratio of EV to quarterly EBITDA of $34m gives a multiple that makes no sense for valuation: $2.3bn divided by $34m is about 68. For comparison, normal multiples for industrial companies are 5-10. This means the market either expects EBITDA to recover or values the company's assets below their book value.
The loss and negative return on equity make the company unattractive to investors seeking stable income. Restoring profitability will require either higher product prices or lower costs – both scenarios take time.
No dividends were paid, and with the current loss there is no basis for payouts
Over the last twelve months Sappi paid no dividends. With a net loss of $116m for the quarter and negative operating cash flow, paying a dividend would only be possible through new borrowing, which would increase already high debt.
For an investor this means the share provides no current income. All value is concentrated in the expectation of a profit recovery, but three consecutive loss-making quarters and $1.9bn of debt make that scenario uncertain.
Until the company returns to profit and positive free cash flow, there will be no dividends. This is another argument against the share at the current level.
Valuation on the latest reported figures
| Metric | Value |
|---|---|
| Market cap | 0.39 bn USD |
| P/B | 0.23 |
| Operating cash flow (LTM) | 0.06 bn |
| ROE | -27.3% |
Bottom line
The quarter showed that Sappi is in a difficult position: revenue was almost flat, but EBITDA fell to $34m and the net loss was $116m. Debt of $1.9bn against such EBITDA implies leverage of 57 times, and negative operating cash flow does not cover capital expenditure. The only thing that could change the situation is a recovery in product prices or cost cuts, but both scenarios look distant for now. Our conclusion: the share is rather unattractive – with a loss and debt 57 times quarterly EBITDA, there is no margin of safety in the valuation. Our view: the share is rather unattractive at the current price.