Aldar Properties: revenue accelerated to +16.4%, but quarterly cash flow came in at a third of profit
Aldar Properties reported results for the third quarter of 2026. Revenue reached AED 9,344.7 mn (+16.4% year on year), net profit – AED 1,913.2 mn (+25.1%), and the net margin rose to 20.5% from 19.1% a year earlier. Revenue growth accelerated from +4.8% in the second quarter, yet operating cash flow for the quarter was only AED 668.6 mn – about a third of profit. At a P/E LTM of 7.0 and a portal-model upside of +12%, the share looks rather attractive, but weak cash conversion keeps it from a higher rating.
Key takeaways
— Revenue accelerated to +16.4% from +4.8% in the second quarter, the fastest pace since the first quarter
— Net margin rose to 20.5% from 19.1%, and profit grew faster than revenue
— Operating cash flow for the quarter was AED 668.6 mn, a third of net profit of AED 1,913.2 mn
— Leverage at 1.79x EBITDA LTM is a moderate level, but net debt itself rose during the quarter
— P/E LTM of 7.0 and EV/EBITDA LTM of 6.7 are low multiples for a growing developer
— The portal model implies +12% upside to fair value, and that is our own calculation
Attractiveness
Key figures, AED bn
| Metric | Q3 2025 | Q3 2026 | Change |
|---|---|---|---|
| Revenue | 8.03 | 9.34 | +16.4% |
| EBITDA | 2.34 | — | — |
| Operating profit | 2.18 | — | — |
| Net profit | 1.53 | 1.91 | +25.1% |
| Operating cash flow | 1.22 | 0.67 | -45.1% |
| Capex | 0.85 | — | — |
| EBITDA margin | 29.2% | — | — |
| Net margin | 19.1% | 20.5% | +1.4 pp |
Revenue accelerated to +16.4% from +4.8% in the second quarter, the fastest pace since the first quarter
In the third quarter of 2026, Aldar Properties' revenue reached AED 9,344.7 mn, up 16.4% year on year. Growth in the second quarter was a more modest 4.8%, so the acceleration is clear: the pace more than tripled. This is the fastest growth since the first quarter, when revenue added 12.1%.
Quarter on quarter, revenue rose from AED 8,108.8 mn to AED 9,344.7 mn – roughly 15%. Such a step up after a relatively flat second quarter suggests that sales and handovers are uneven, and the third quarter was a strong one.
For a developer, quarterly revenue depends on the schedule of handing over completed homes, so a single quarter says little about the trend. More important is that the company has been growing at double-digit rates year on year for several quarters, and the third quarter restored the pace after the second-quarter slowdown.
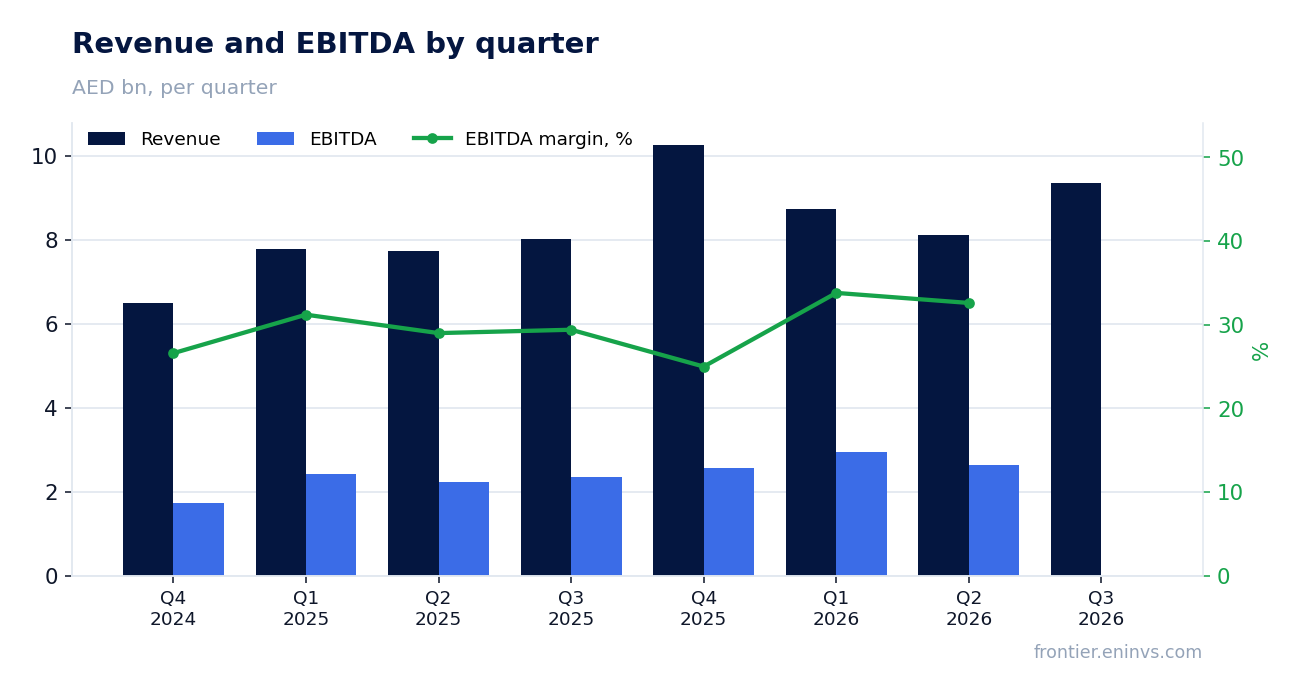
Net margin rose to 20.5% from 19.1%, and profit grew faster than revenue
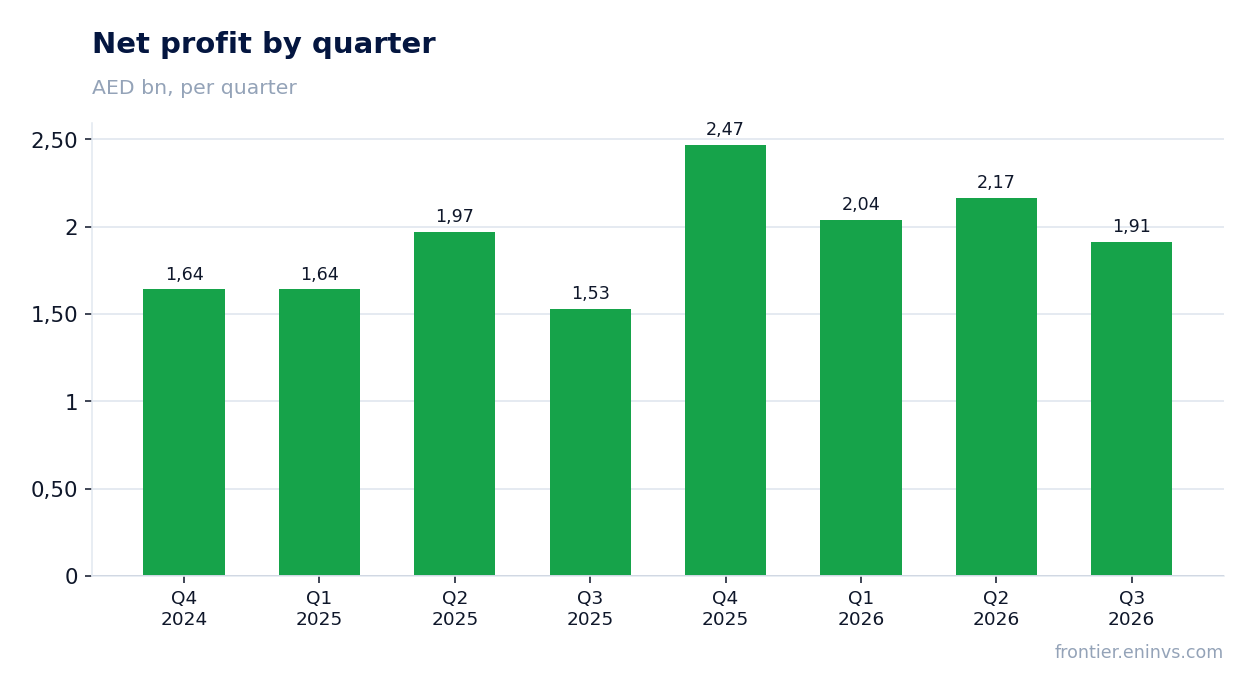
Net profit for the third quarter of 2026 was AED 1,913.2 mn, up 25.1% year on year. Revenue over the same period grew 16.4%, meaning profit grew faster than revenue, which showed up in the margin: 20.5% versus 19.1% a year earlier.
A 1.4 percentage point margin gain on that revenue dynamic means costs grew slower than sales. The facts do not break out individual cost lines, so the exact cause cannot be named – all that is visible is that operating leverage worked in the company's favour.
Profit of AED 1,913.2 mn is a level the company delivers consistently: AED 2,038.9 mn in the first quarter of 2026 and AED 2,165.7 mn in the second. The third quarter is slightly weaker than the two preceding ones, but still higher year on year.
Operating cash flow for the quarter was AED 668.6 mn, a third of net profit of AED 1,913.2 mn
Operating cash flow for the third quarter of 2026 was AED 668.6 mn against net profit of AED 1,913.2 mn. A gap of nearly three times is the main question about the report: there is profit, but noticeably less cash from operations.
In the second quarter the flow was even lower at AED 143.2 mn, and in the first quarter it was AED 1,550.6 mn. So the third quarter is better than the second, but still delivered only a third of profit. For a developer such a gap usually means growth in work in progress and inventories, but the facts do not disclose the specific cause.
Capital expenditure for the third quarter is not disclosed, so free cash flow for the quarter cannot be calculated. Over the first two quarters capex was moderate – AED 614.7 mn and AED 769.1 mn – so the main outflow appears to run through working capital rather than construction.
Leverage at 1.79x EBITDA LTM is a moderate level, but net debt itself rose during the quarter
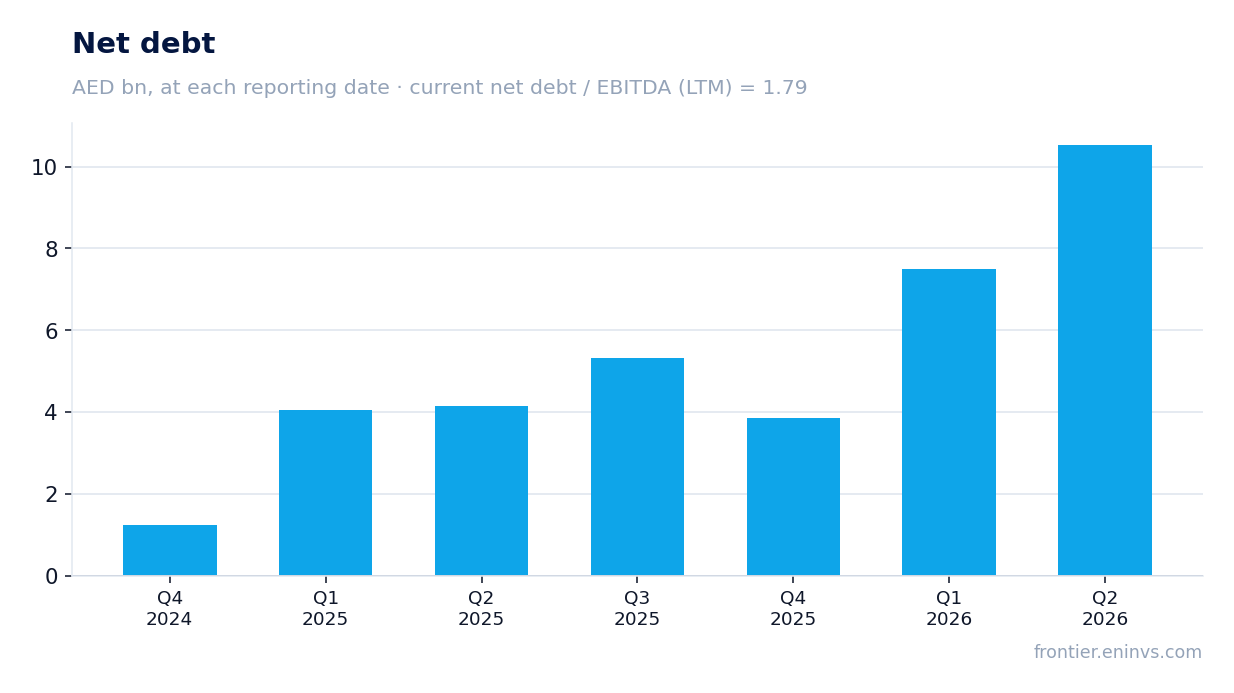
Net debt at the latest annual balance sheet date was AED 21,883.2 mn, and the ratio of net debt to EBITDA over the trailing twelve months was 1.79. That is a moderate level for a developer: debt is less than two years' EBITDA.
Net debt itself rose during the quarter: at the end of the second quarter of 2026 it was AED 10,534.7 mn, and at the end of the first quarter AED 7,501.7 mn. Rising debt against weak operating cash flow is what to watch in the next report.
EBITDA over the trailing twelve months was AED 12,221.8 mn, and revenue over the same period was AED 36,500.0 mn. With a market capitalisation of AED 60,149.1 mn and EV/EBITDA LTM of 6.7, the company is valued cheaply relative to its own ability to generate operating profit.
P/E LTM of 7.0 and EV/EBITDA LTM of 6.7 are low multiples for a growing developer
Aldar Properties shares trade at a P/E LTM of 7.0 and EV/EBITDA LTM of 6.7. For a company growing revenue at double-digit rates and holding a margin above 20%, these are modest valuations: the market is not pricing in continued growth.
Return on equity (ROE) is 4.7% – low relative to the cost of capital. This means the company's balance sheet is heavy: assets are large, and profit on them is still small. That, rather than debt, is what limits the valuation.
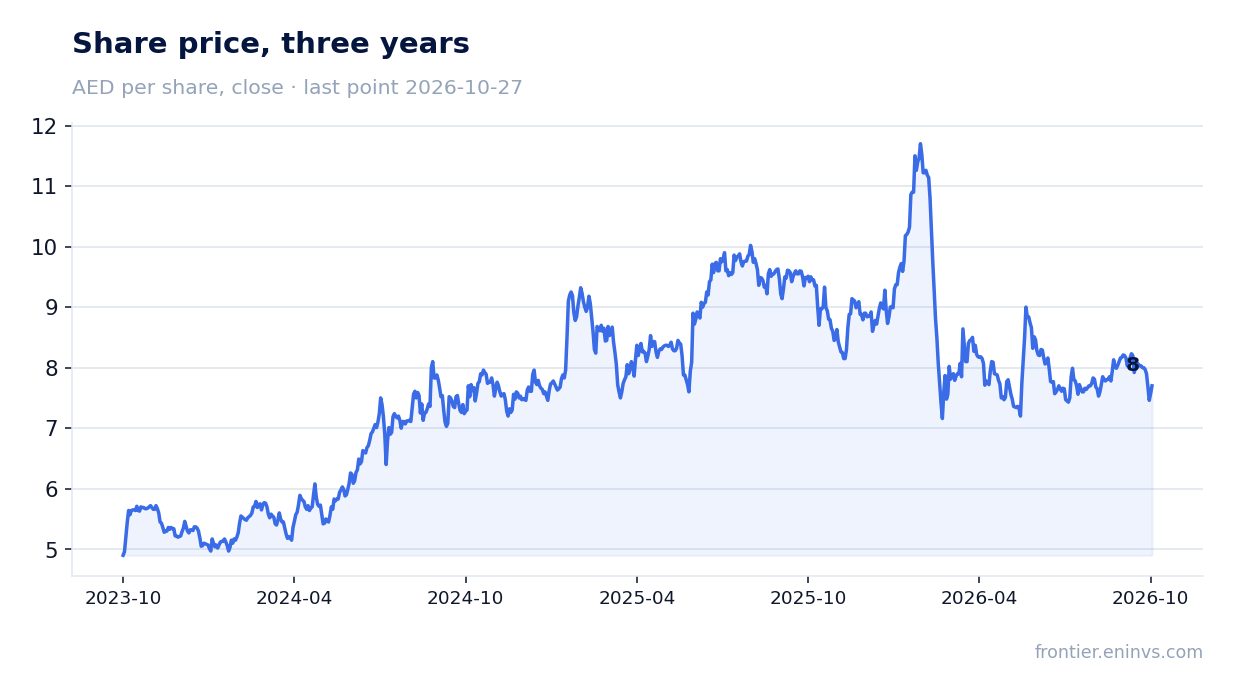
On the portal's model, the share's fair value is 12% above the current market price. This is our own calculation based on EBITDA growth and a target multiple, not a market consensus and not a target price.
The portal model implies +12% upside to fair value, and that is our own calculation
On the portal's model, the fair value of Aldar Properties shares is 12% above the current market price. The model is built on EBITDA growth and a target multiple – it is our internal tool, not a market consensus and not a recommendation.
Upside of 12% is moderate. It does not offset the risk of weak cash conversion: if operating cash flow stays at a third of profit, the market is unlikely to re-rate the stock higher.
Confirmation of the valuation requires the next report: sustained revenue growth, a margin above 20%, and a recovery in cash flow to a level comparable with profit. If debt keeps rising while cash flow stays weak, the model's upside will shrink.
Valuation on the latest reported figures
| Metric | Value |
|---|---|
| Market cap | 60.1 bn AED |
| P/E (LTM) | 7.0 |
| EV/EBITDA (LTM) | 6.7 |
| P/B | 1.23 |
| Net debt / EBITDA (LTM) | 1.79 |
| ROE | 4.7% |
Bottom line
The strong side of the report is the acceleration in revenue to +16.4% and the rise in margin to 20.5%: the company is growing faster than a year earlier and doing so at a higher margin. The weak side is cash flow: AED 668.6 mn of operating flow against AED 1,913.2 mn of profit, and rising debt. The valuation is low – P/E LTM 7.0, EV/EBITDA LTM 6.7 – and the portal model implies +12% upside to fair value, but a re-rating requires converting profit into cash. The verdict is rather attractive: the multiples and revenue growth outweigh, but weak cash flow keeps it from a higher rating.
Open the company's financial profile ALDAR →
See also: market overview · valuation map · stock screeners