Americana: revenue accelerated to +14.4%, but profit rests on a low year-ago base
On 25 November Americana reported results for the third quarter of 2026. Revenue reached USD 712.3 mn, up 14.4% year on year, operating profit was USD 91.0 mn, and net profit USD 69.9 mn (+63.0% year on year), lifting the net margin to 9.8% from 6.9%. The profit jump is almost entirely a low-base effect rather than an improvement in operating economics, so at P/E 19.5 and EV/EBITDA 9.2 the share looks neutral: revenue is accelerating, but the price already reflects it.
Key takeaways
— Revenue accelerated to +14.4% year on year from +11.1% a quarter earlier, the fastest pace in four quarters
— Net profit rose 63.0% mainly on a weak year-ago base, not on operating margin expansion
— Operating profit grew 44.5% year on year but stayed below the level of the second quarter of 2026
— Operating cash flow of USD 157.1 mn covers capital expenditure of USD 24.6 mn more than six times over
— Net debt of USD 524.3 mn at 0.88x LTM EBITDA is moderate, but net debt rose by USD 1.0 bn over the year
— At P/E 19.5 and EV/EBITDA 9.2 the share carries no meaningful discount, and the portal model implies only +9% upside
Attractiveness
Key figures, USD bn
| Metric | Q3 2025 | Q3 2026 | Change |
|---|---|---|---|
| Revenue | 0.62 | 0.71 | +14.4% |
| EBITDA | 0.14 | — | — |
| Operating profit | 0.06 | 0.09 | +44.5% |
| Net profit | 0.04 | 0.07 | +63.0% |
| Operating cash flow | 0.10 | 0.16 | +51.9% |
| Capex | 0.02 | -0.02 | -201.6% |
| EBITDA margin | 22.1% | — | — |
| Net margin | 6.9% | 9.8% | +2.9 pp |
Revenue accelerated to +14.4% year on year from +11.1% a quarter earlier, the fastest pace in four quarters
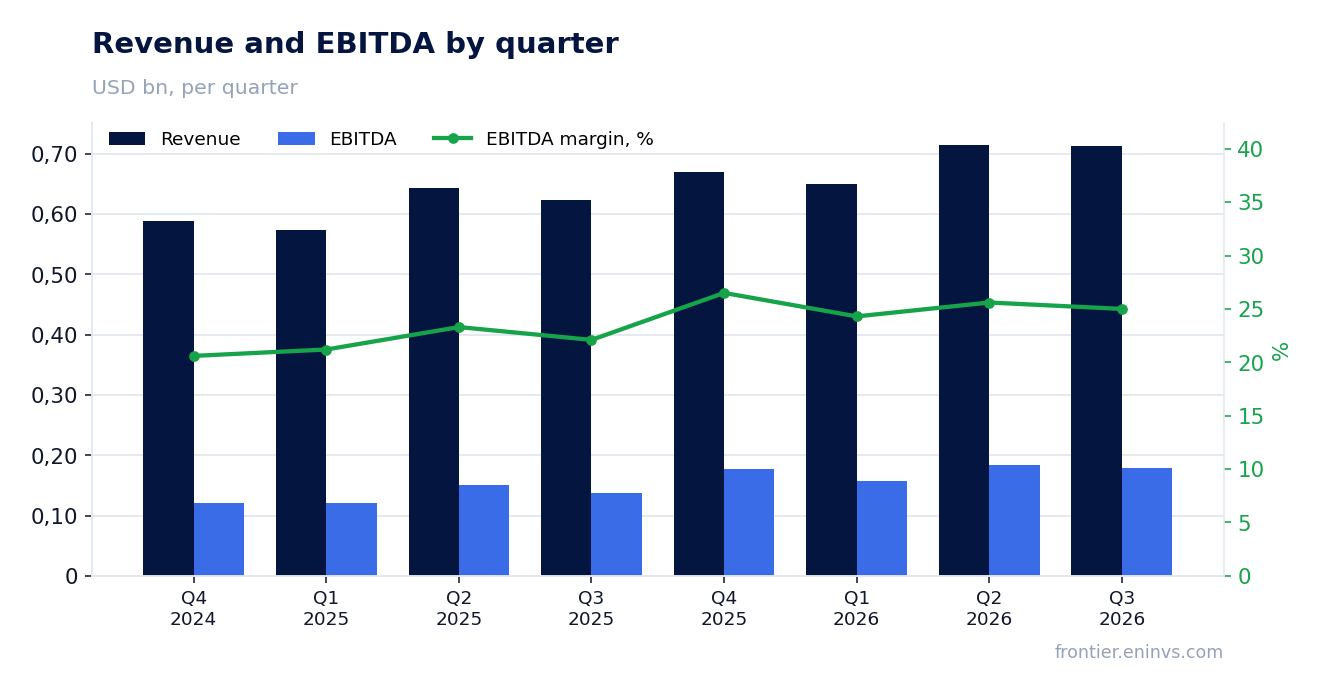
Revenue for the third quarter of 2026 was USD 712.3 mn against USD 622.7 mn a year earlier. Growth of 14.4% was faster than 11.1% in the second quarter and faster than 13.6% in the fourth quarter of 2025. This is acceleration, not a reversal: the company has grown at double-digit rates for several quarters running.
In absolute terms, quarterly revenue was almost flat versus the second quarter of 2026 (USD 714.8 mn), so the year-on-year acceleration reflects a weak base in the third quarter of 2025 rather than a new leg of sequential growth. For judging durability, the sequential picture matters more, and it is flat.
The facts provided do not break down what supported revenue. Without segment or regional detail, it is impossible to say whether growth came from new store openings or from higher sales at existing locations. That is the key question for the next report: acceleration is durable only if like-for-like sales are rising.
Net profit rose 63.0% mainly on a weak year-ago base, not on operating margin expansion
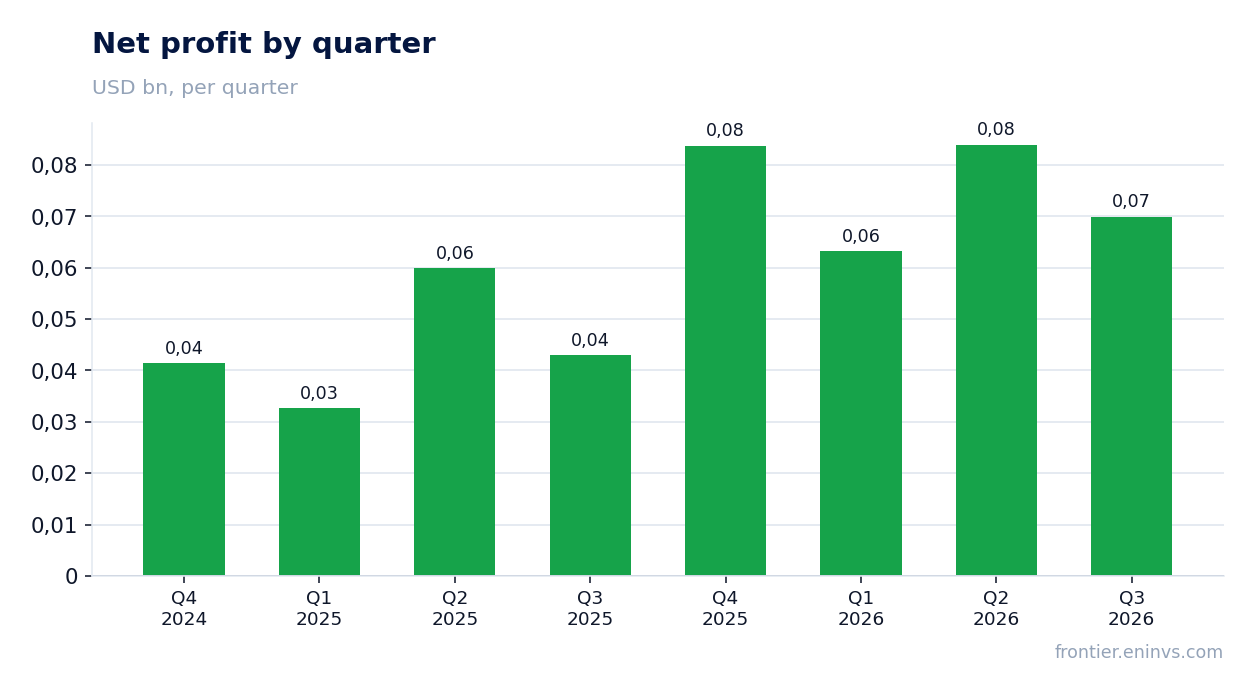
Net profit for the third quarter of 2026 was USD 69.9 mn against USD 42.9 mn a year earlier. The net margin rose to 9.8% from 6.9%. Growth of 63.0% looks impressive, but the third-quarter 2025 base was one of the weakest in the past two years.
Operating profit rose to USD 91.0 mn from USD 63.0 mn, or 44.5%. That is less than net profit growth, meaning part of the increase below the operating line came from items unrelated to the core business: interest, taxes or one-offs. The facts do not disclose their composition.
Sequentially, operating profit fell from USD 104.7 mn in the second quarter of 2026. That matters: the year-on-year picture is improving, while the quarter-on-quarter operating economics weakened. Margin durability is the main question for the next report.
Operating profit grew 44.5% year on year but stayed below the level of the second quarter of 2026
Operating profit of USD 91.0 mn on revenue of USD 712.3 mn implies an operating margin of about 12.8%. A year earlier, on revenue of USD 622.7 mn and operating profit of USD 63.0 mn, the margin was about 10.1%. The 2.7 percentage point improvement is the main source of net profit growth.
Yet in the second quarter of 2026 the operating margin was higher: USD 104.7 mn of profit on USD 714.8 mn of revenue. The quarter-on-quarter margin decline on broadly flat revenue means costs grew faster than sales. The facts do not specify which line – cost of sales, staff or rent – was responsible.
For an investor this is the key point: year on year the company is improving, but the sequential margin trend is negative. If the margin does not recover next quarter, the annual profit growth will look increasingly less durable.
Operating cash flow of USD 157.1 mn covers capital expenditure of USD 24.6 mn more than six times over
Operating cash flow for the third quarter of 2026 was USD 157.1 mn, with capital expenditure of USD 24.6 mn. Free cash flow before interest and taxes therefore exceeds USD 130 mn for the quarter. This is a strong part of the report: the business generates cash markedly faster than it invests.
Capital expenditure is modest relative to revenue – about 3.5%. For a restaurant chain that is a low level, which could mean either discipline in opening new locations or underinvestment in growth. The facts do not disclose the reason.
Operating cash flow declined versus the second quarter of 2026 (USD 230.5 mn), consistent with weaker operating profit. Over the past twelve months operating cash flow was USD 598.7 mn on revenue of USD 2,700.0 mn – conversion of revenue into cash remains high.
Net debt of USD 524.3 mn at 0.88x LTM EBITDA is moderate, but net debt rose by USD 1.0 bn over the year
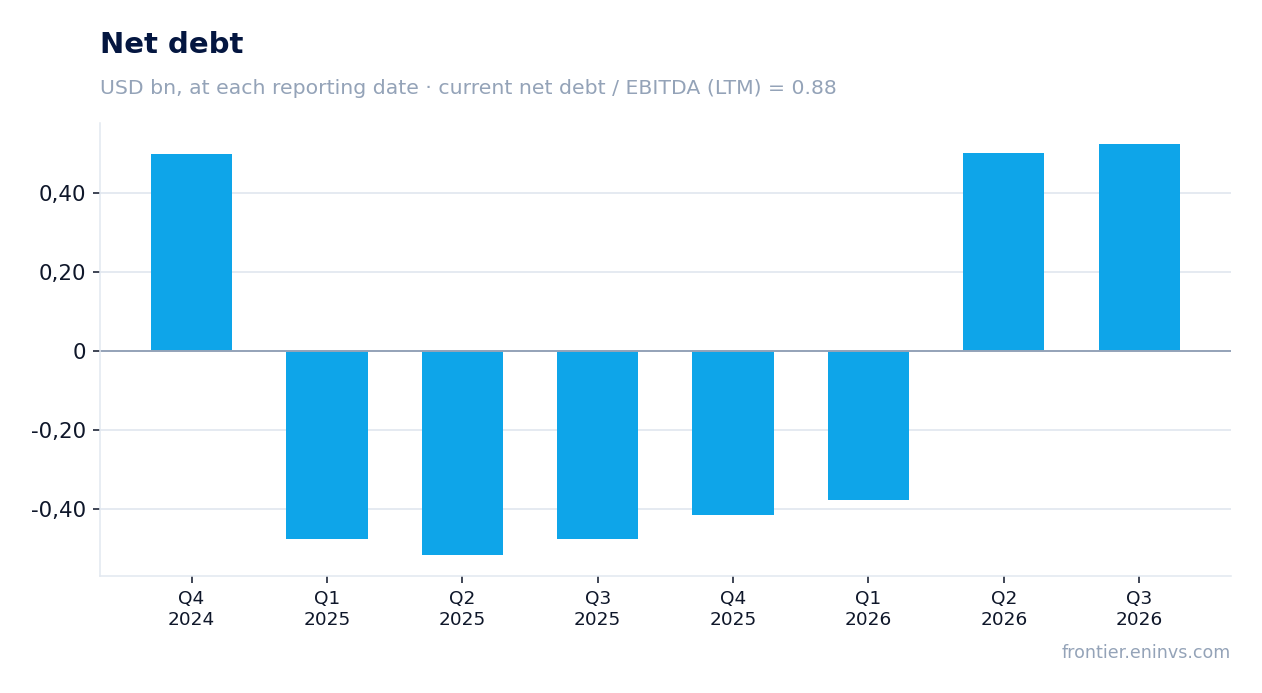
Net debt at 30 September 2026 was USD 524.3 mn, or 0.88x LTM EBITDA. That is a moderate level: the company services its debt without strain, and LTM EBITDA of USD 593.8 mn covers it almost entirely within a year.
The trend matters more than the level. At 30 June 2026 net debt was USD 0.5 bn, and at 30 September USD 0.5 bn, a zero change for the quarter. But a year earlier, at 30 September 2025, the company had a net cash position of USD 0.5 bn, meaning net debt rose by USD 1.0 bn over twelve months. The facts do not disclose the reason.
Rising debt alongside strong operating cash flow means the money went either to shareholder distributions, acquisitions or working capital. Without the cash flow statement this cannot be pinned down. For a holder this is the main risk: if debt keeps growing at this pace, the EBITDA ratio will start to climb.
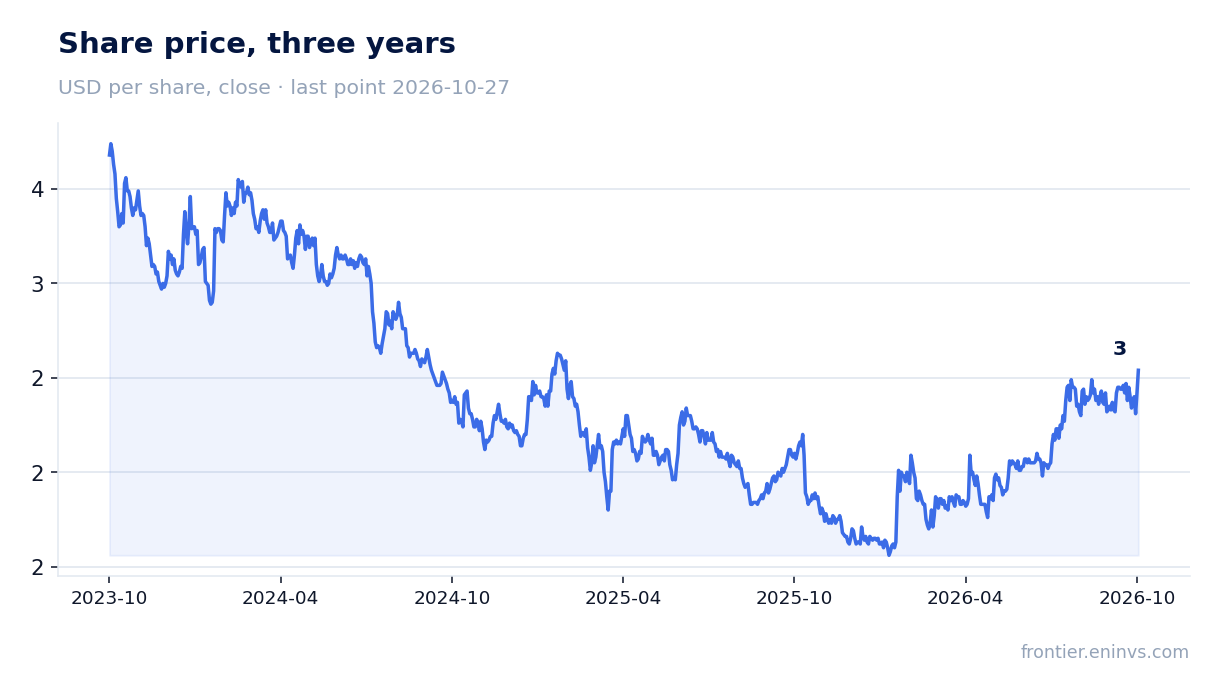
At P/E 19.5 and EV/EBITDA 9.2 the share carries no meaningful discount, and the portal model implies only +9% upside
The company's market capitalisation is USD 5,855.4 mn, with a trailing P/E of 19.5 and EV/EBITDA of 9.2. Return on equity is 22.2%, a good figure for a restaurant business. The multiples are consistent with a mature cash-generative business rather than a growth story.
The facts do not provide the company's own three-year multiple history, so the current valuation cannot be compared with its average. On the portal's model, fair value implies +9% upside to the current price. That is moderate upside and offers no margin of safety against rising debt.
A re-rating would require either sustained like-for-like sales growth or a recovery in the operating margin to the second-quarter level. Without that, the current price looks fair rather than cheap.
Valuation on the latest reported figures
| Metric | Value |
|---|---|
| Market cap | 5.86 bn USD |
| P/E (LTM) | 19.5 |
| EV/EBITDA (LTM) | 9.2 |
| P/B | 11.95 |
| Net debt / EBITDA (LTM) | 0.88 |
| Operating cash flow (LTM) | 0.60 bn |
| ROE | 22.2% |
Bottom line
The strong part of the report is revenue acceleration to 14.4% and cash flow covering capital expenditure more than six times over. The weak part is earnings quality: 63.0% growth rests on a low year-ago base, while the operating margin declined sequentially. Net debt of USD 524.3 mn at 0.88x EBITDA is moderate, but it rose by USD 1.0 bn over the year and the facts do not disclose why. At P/E 19.5 and with the portal model implying +9% upside, the share is fairly valued, so the verdict is neutral. An upgrade would require margin recovery and a halt in debt growth.
Open the company's financial profile AMR →
See also: market overview · valuation map · stock screeners