Borouge: revenue held flat year on year, but EBITDA halved as margin compressed from 39.1% to 19.3%
Borouge reported third-quarter 2026 results. Revenue came in at USD 1,444.1 million, down 0.2% year on year; EBITDA was USD 279.0 million, 50.6% lower than a year earlier; net profit was USD 106.6 million, down 63.5%. Operating cash flow remained strong at USD 635.2 million, and net debt fell to USD 2.5 billion at end-September from USD 3.2 billion at 30 June. The stock trades at EV/EBITDA LTM of 12.96 and P/E LTM of 21.9, which looks expensive for a company with a collapsing margin; the verdict is rather unattractive.
Key takeaways
— Revenue held flat year on year, but EBITDA halved as margin compressed from 39.1% to 19.3%
— Net profit fell 63.5% year on year to USD 106.6 million on revenue of USD 1,444.1 million
— Operating cash flow of USD 635.2 million with capital expenditure of just USD 15.2 million left almost the entire quarterly cash flow with the company
— Net debt fell to USD 2.5 billion from USD 3.2 billion at 30 June, and from USD 2.8 billion a year earlier at 30 September 2025
— Leverage of 1.54x EBITDA LTM is moderate, but profit is falling faster than debt
— Valuation at 12.96x EV/EBITDA LTM and 21.9x P/E LTM leaves no margin of safety as margins compress
Attractiveness
Key figures, USD bn
| Metric | Q3 2025 | Q3 2026 | Change |
|---|---|---|---|
| Revenue | 1.45 | 1.44 | -0.2% |
| EBITDA | 0.57 | 0.28 | -50.6% |
| Operating profit | 0.45 | 0.17 | -62.0% |
| Net profit | 0.29 | 0.11 | -63.5% |
| Operating cash flow | 0.54 | 0.64 | +16.8% |
| Capex | 0.04 | 0.02 | -61.2% |
| EBITDA margin | 39.1% | 19.3% | -19.8 pp |
| Net margin | 20.2% | 7.4% | -12.8 pp |
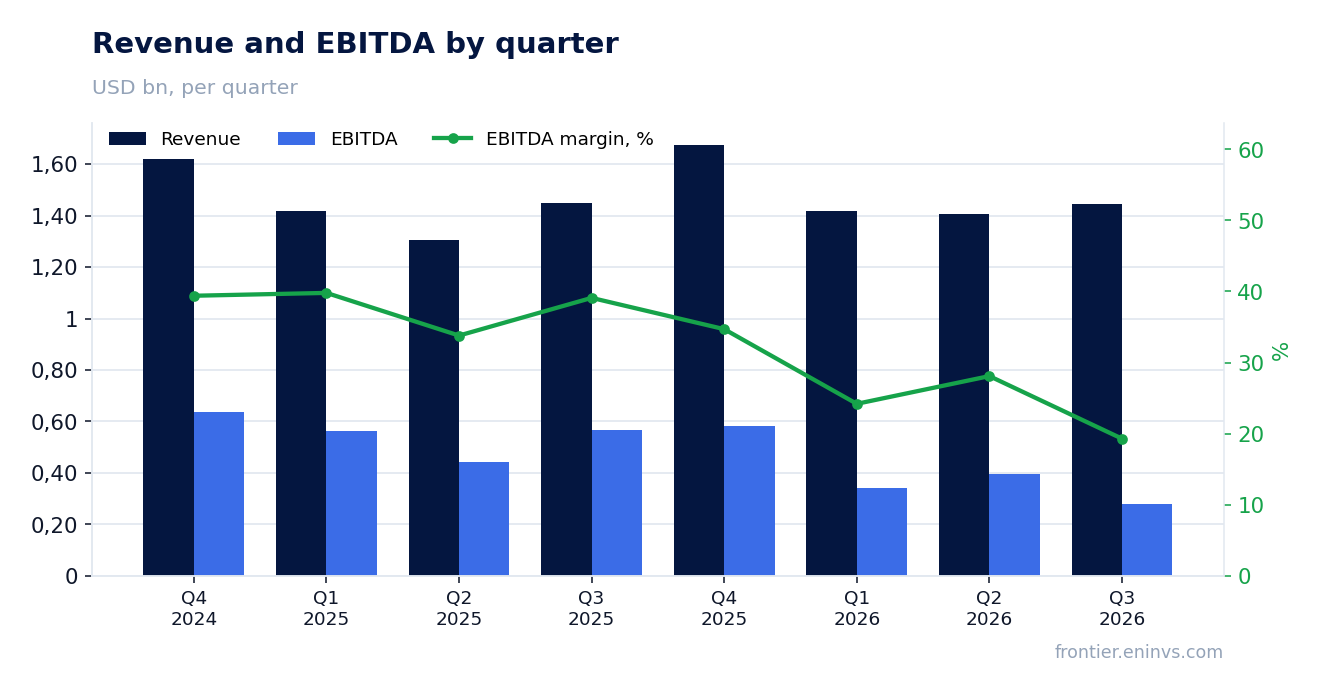
Revenue held flat year on year, but EBITDA halved as margin compressed from 39.1% to 19.3%
Third-quarter 2026 revenue was USD 1,444.1 million, down 0.2% year on year. That is a marked deceleration from the second quarter, when growth was 7.7%. The company neither lost sales volume nor grew it.
The main surprise is in profitability. EBITDA fell to USD 279.0 million, and its margin to 19.3% from 39.1% a year earlier. Operating profit declined to USD 172.0 million. Such margin compression on flat revenue means costs or selling prices changed sharply, and that is the key negative of the report.
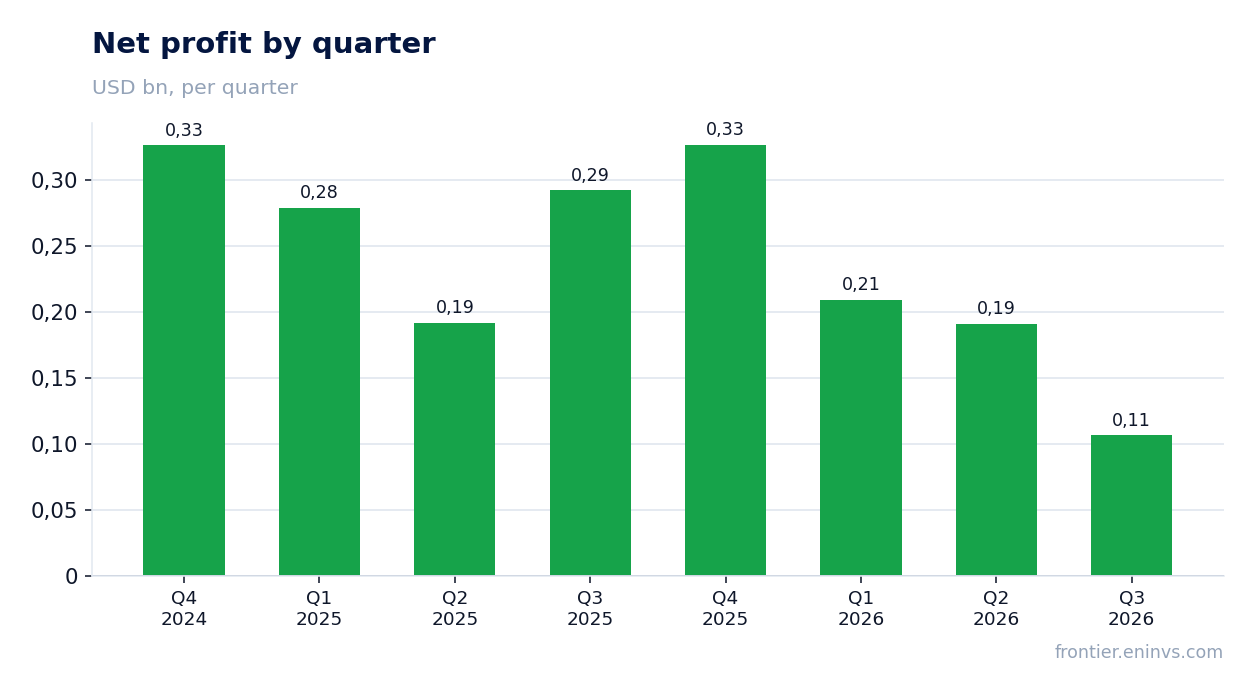
Net profit fell 63.5% year on year to USD 106.6 million, and net margin to 7.4% from 20.2%. Profit is falling faster than EBITDA, pointing to a higher share of interest or other expenses below the operating line.
Net profit fell 63.5% year on year to USD 106.6 million on revenue of USD 1,444.1 million
Third-quarter 2026 net profit was USD 106.6 million versus USD 292.1 million a year earlier. A 63.5% decline on revenue down just 0.2% shows the issue is profitability, not volumes.
Operating profit was USD 172.0 million, and the gap between it and net profit – USD 65.4 million – is interest and taxes. With net debt of USD 2.5 billion, interest burden remains noticeable, even though the company reduced debt over the quarter.
For an investor, the key point is that profit is falling faster than revenue: a sign of structural rather than one-off deterioration. If margin does not recover, profit will stay under pressure in coming quarters.
Operating cash flow of USD 635.2 million with capital expenditure of just USD 15.2 million left almost the entire quarterly cash flow with the company
Third-quarter 2026 operating cash flow was USD 635.2 million – more than double EBITDA. Such a gap usually means working-capital release rather than improved operating profitability.
Capital expenditure was minimal at USD 15.2 million, well below prior quarters (e.g., USD 111.7 million in the second quarter). As a result, free cash flow after capex exceeded USD 600 million, which enabled the reduction in net debt.
However, the sustainability of such flow is questionable: with falling EBITDA and low capex, the next quarter could show a reversal in working capital. Investors should look at the average flow over several quarters, not just one.
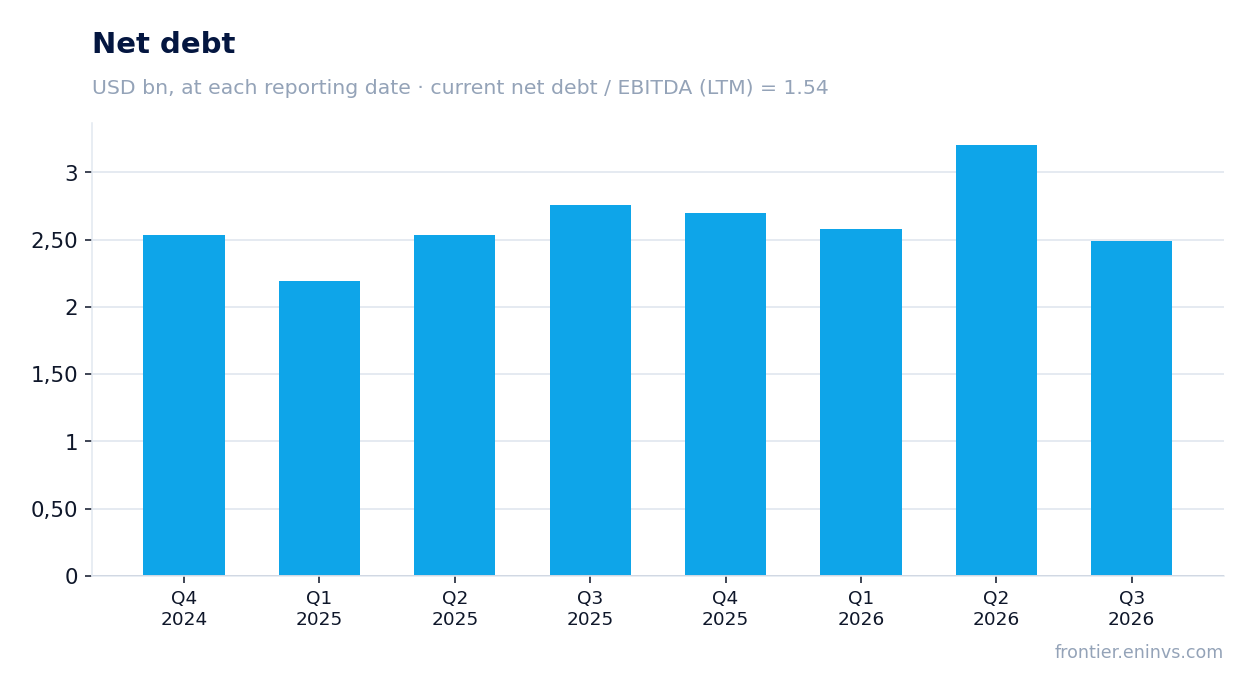
Net debt fell to USD 2.5 billion from USD 3.2 billion at 30 June, and from USD 2.8 billion a year earlier at 30 September 2025
Net debt at 30 September 2026 was USD 2,492.4 million. Over the quarter it fell from USD 3,206.3 million at 30 June – a reduction of USD 713.8 million. Year on year, from USD 2,755.9 million at 30 September 2025, the decline was USD 263.5 million.
The debt reduction was financed by strong operating cash flow with low capex. The net debt to EBITDA LTM ratio is 1.54, a moderate level. However, with falling EBITDA this ratio could rise even without new debt.
Interest expenses remain significant: the USD 65.4 million gap between operating and net profit for the quarter includes them. Further debt reduction will help, but the main risk is profit, not debt.
Leverage of 1.54x EBITDA LTM is moderate, but profit is falling faster than debt
The ratio of net debt to trailing-twelve-month EBITDA is 1.54. That is a comfortable level for most industries and does not create immediate refinancing risks.
However, the denominator – LTM EBITDA of USD 1,614.0 million – includes strong prior quarters. If the current quarterly EBITDA of USD 279.0 million persists, annual EBITDA would fall below USD 1.2 billion, and leverage would approach 2.1x without any increase in debt.
Thus debt itself is not the problem, but its ratio to profit is deteriorating due to falling operating profitability. This limits the company's ability to pay dividends and invest.
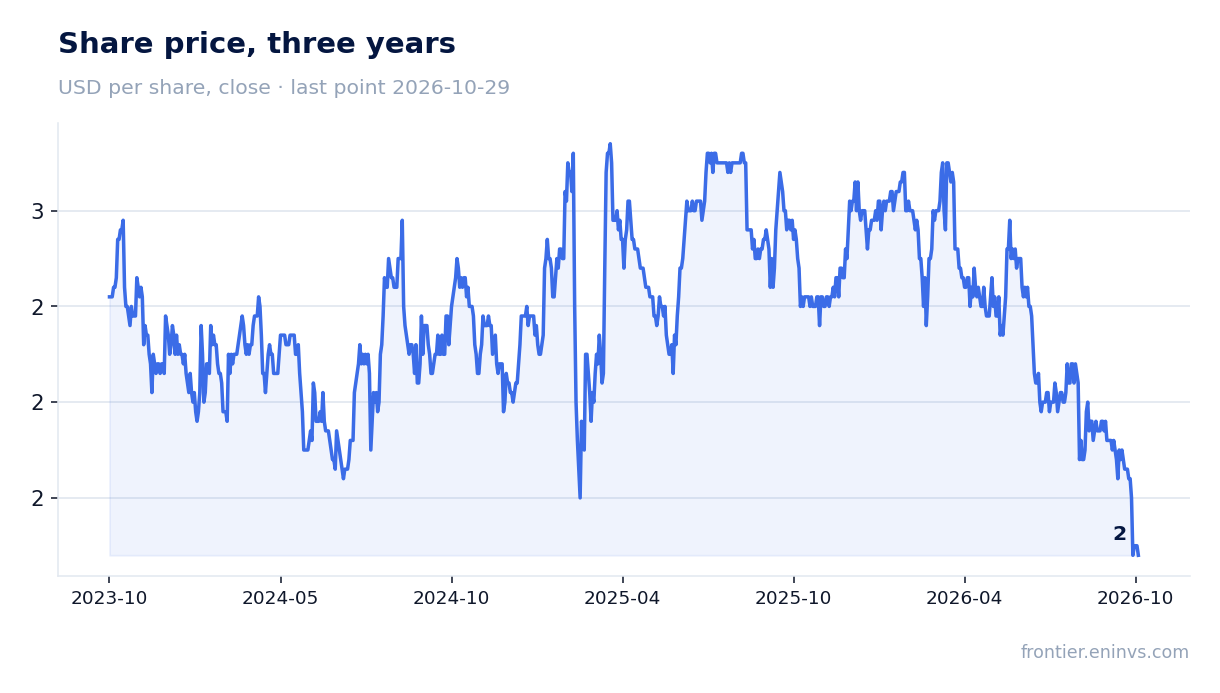
Valuation at 12.96x EV/EBITDA LTM and 21.9x P/E LTM leaves no margin of safety as margins compress
With a market capitalisation of USD 18.2 billion and net debt of USD 2.5 billion, EV/EBITDA LTM is 12.96 and P/E LTM is 21.9. For a company whose EBITDA halved and profit fell 63.5%, such multiples look high.
Return on equity (ROE) is 12.3%, which is not bad, but it is based on trailing-twelve-month profit that still includes strong quarters. At the current profit level, ROE will decline.
We cannot compare with the company's own multiple history – the facts do not include three-year averages. But even without that, it is clear the market has not yet priced in a sustained margin decline. Any confirmation of weak results in the next quarter could lead to a re-rating.
Valuation on the latest reported figures
| Metric | Value |
|---|---|
| Market cap | 18.2 bn USD |
| P/E (LTM) | 21.9 |
| EV/EBITDA (LTM) | 13.0 |
| P/B | 4.43 |
| Net debt / EBITDA (LTM) | 1.54 |
| Operating cash flow (LTM) | 1.44 bn |
| ROE | 12.3% |
Bottom line
The strong side of the report is cash flow: USD 635.2 million from operations with minimal capex allowed net debt to be cut to USD 2.5 billion. However, this is more likely a one-off working-capital release than a sustainable improvement. The main problem is the collapse in EBITDA by 50.6% and net profit by 63.5% on flat revenue: margin compressed from 39.1% to 19.3%, and there is no visible reason for a quick recovery. At 12.96x EV/EBITDA and 21.9x P/E the stock looks expensive for a company with falling profitability. The verdict is rather unattractive: the risk of further profit decline outweighs moderate leverage.
Open the company's financial profile BOROUGE →
See also: market overview · valuation map · stock screeners