du (EITC): revenue accelerated to +7.1%, but profit barely outpaces it
On 29 October du (EITC) reported third-quarter 2026 results: revenue of AED 4,145.0m (+7.1% YoY), EBITDA of AED 1,444.8m (+6.4%) and net profit of AED 785.8m (+7.3%). Revenue growth accelerated from +4.6% in the second quarter, but the EBITDA margin slipped to 34.9% from 35.1% a year earlier. At an EV/EBITDA of 10.3 versus its own three-year average of 8.0 and a modest +7% upside on the portal's model, the share looks neutral: a 5.4% dividend yield and low leverage support the valuation, but the premium to history is already priced in.
Key takeaways
— Revenue accelerated to +7.1% YoY, the fastest pace in three quarters
— The EBITDA margin slipped to 34.9% as costs outgrew revenue
— Net profit rose 7.3%, but the margin barely moved
— Free cash flow for the quarter covered the dividend with room to spare
— Net debt fell to AED 1.1bn, with leverage at 0.2x EBITDA
— A 5.4% dividend yield remains the main support for the valuation
— EV/EBITDA of 10.3 is 29% above its own three-year average of 8.0
Attractiveness
Key figures, AED bn
| Metric | Q3 2025 | Q3 2026 | Change |
|---|---|---|---|
| Revenue | 3.87 | 4.15 | +7.1% |
| EBITDA | 1.36 | 1.44 | +6.4% |
| Operating profit | 0.82 | 0.88 | +7.7% |
| Net profit | 0.73 | 0.79 | +7.3% |
| Operating cash flow | 2.07 | 2.23 | +7.9% |
| Capex | 0.46 | 0.60 | +31.9% |
| EBITDA margin | 35.1% | 34.9% | -0.2 pp |
| Net margin | 18.9% | 19.0% | +0.1 pp |
Revenue accelerated to +7.1% YoY, the fastest pace in three quarters
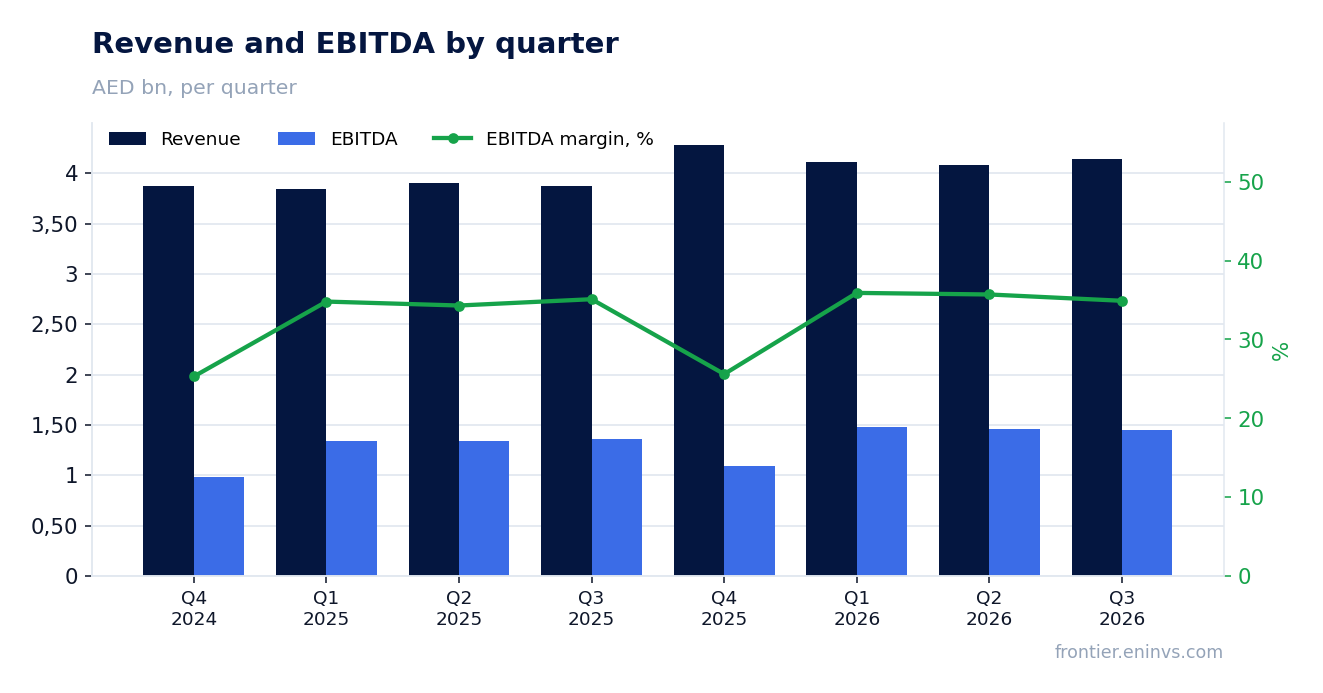
In the third quarter of 2026 revenue reached AED 4,145.0m, up 7.1% year on year. That is an acceleration from 4.6% in the second quarter and the best result since the fourth quarter of 2025, when revenue grew 10.6%.
The quarterly pattern within the year is even: AED 4,114.1m in the first quarter, AED 4,083.5m in the second and AED 4,145.0m in the third. The narrow spread points to stable demand without one-off spikes.
Over the trailing twelve months revenue amounted to AED 16,600.0m. For a company of this scale, growth of around 7% is a moderate but steady pace that supports both profit and cash flow.
The EBITDA margin slipped to 34.9% as costs outgrew revenue
EBITDA for the third quarter of 2026 was AED 1,444.8m, up 6.4% year on year. That is slower than revenue growth, so the EBITDA margin fell to 34.9% from 35.1% a year earlier.
Operating profit rose to AED 882.5m, but its dynamics are close to EBITDA. The gap between revenue and EBITDA means operating costs grew faster than revenue, and that is the main constraint on profitability in the quarter.
Over the trailing twelve months EBITDA was AED 5,505.5m. Against revenue of AED 16,600.0m that implies a margin of about 33%, below the quarterly level, reflecting weaker earlier quarters.
Net profit rose 7.3%, but the margin barely moved
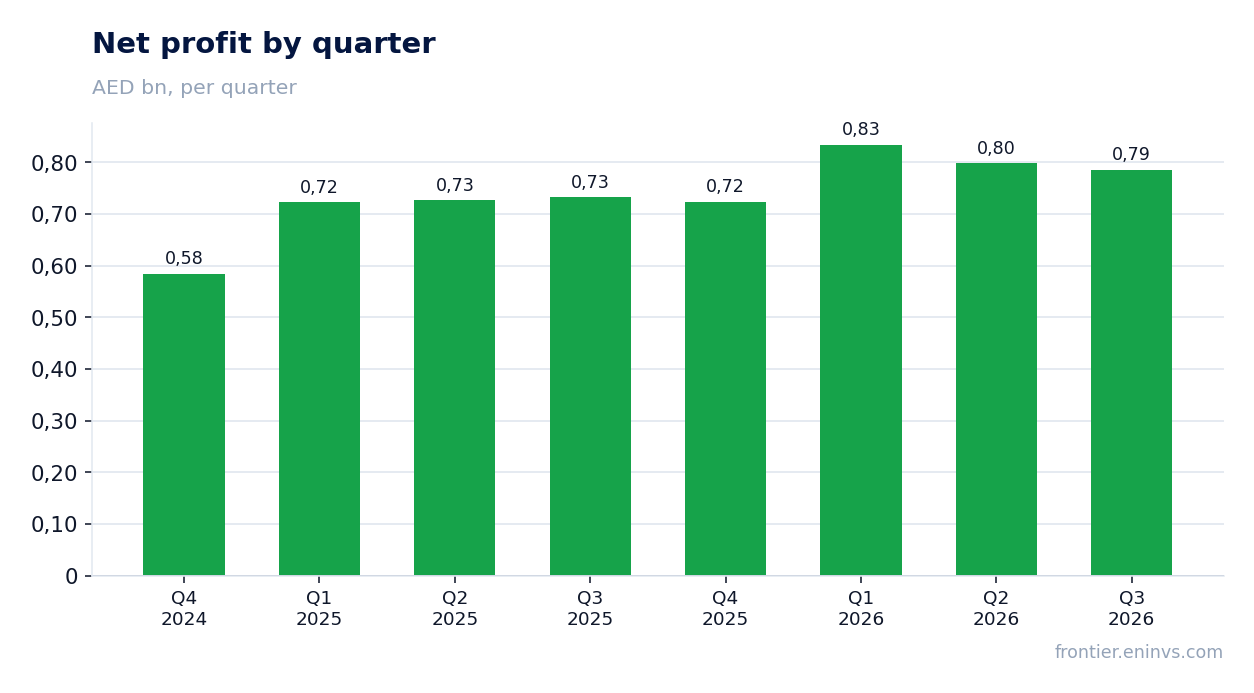
Net profit for the third quarter of 2026 was AED 785.8m, up 7.3% year on year. Growth slightly outpaced revenue, keeping the net margin at 19.0% versus 18.9% a year earlier.
The difference between net profit and EBITDA growth comes from lines below operating profit, including finance costs and taxes. At a 19.0% net margin the company retains a high conversion of revenue into profit.
Over the trailing twelve months net profit was AED 3,141.5m. Against a market capitalisation of AED 55,301.5m that gives a P/E of 17.6, which looks expensive for a company growing at around 7%.
Free cash flow for the quarter covered the dividend with room to spare
Operating cash flow for the third quarter of 2026 was AED 2,230.7m, with capital expenditure of AED 601.7m. Free cash flow for the quarter was therefore about AED 1,629.0m, comfortably covering dividend payments.
Over the trailing twelve months operating cash flow was AED 5,462.8m. With capital expenditure of about AED 2.1bn over the same period, free cash flow remains positive and covers the dividend.
The quarterly flow is volatile: in the second quarter of 2026 it was negative at minus AED 76.7m, then recovered sharply in the third. Such swings are typical of working capital, and the annual figure matters more than the quarterly one.
Net debt fell to AED 1.1bn, with leverage at 0.2x EBITDA
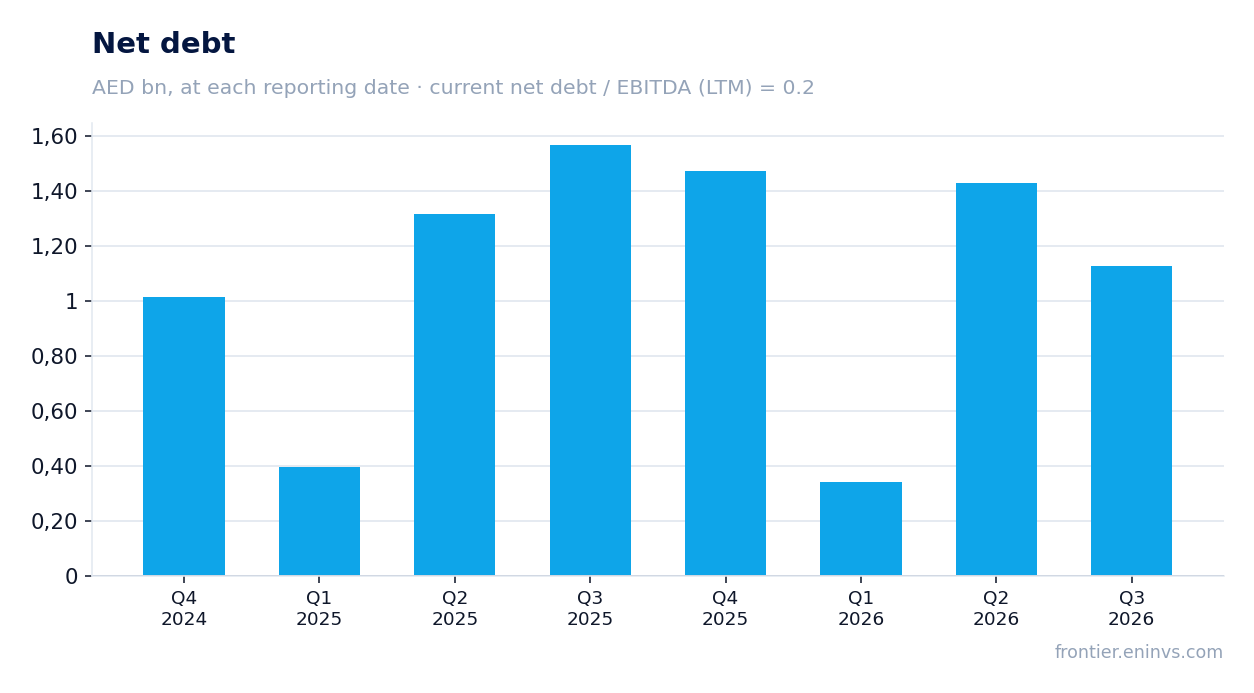
Net debt at 30 September 2026 was AED 1,127.1m. It fell from AED 1,427.9m at 30 June 2026, a decrease of AED 0.3bn, and from AED 1,568.9m at 30 September 2025, a decrease of AED 0.4bn over twelve months.
The ratio of net debt to trailing-twelve-month EBITDA is 0.2. That is a low level and leaves the company room for investment and payouts.
The debt reduction was supported by strong operating cash flow in the third quarter. Interest burden at this debt level is small and does not eat into profit.
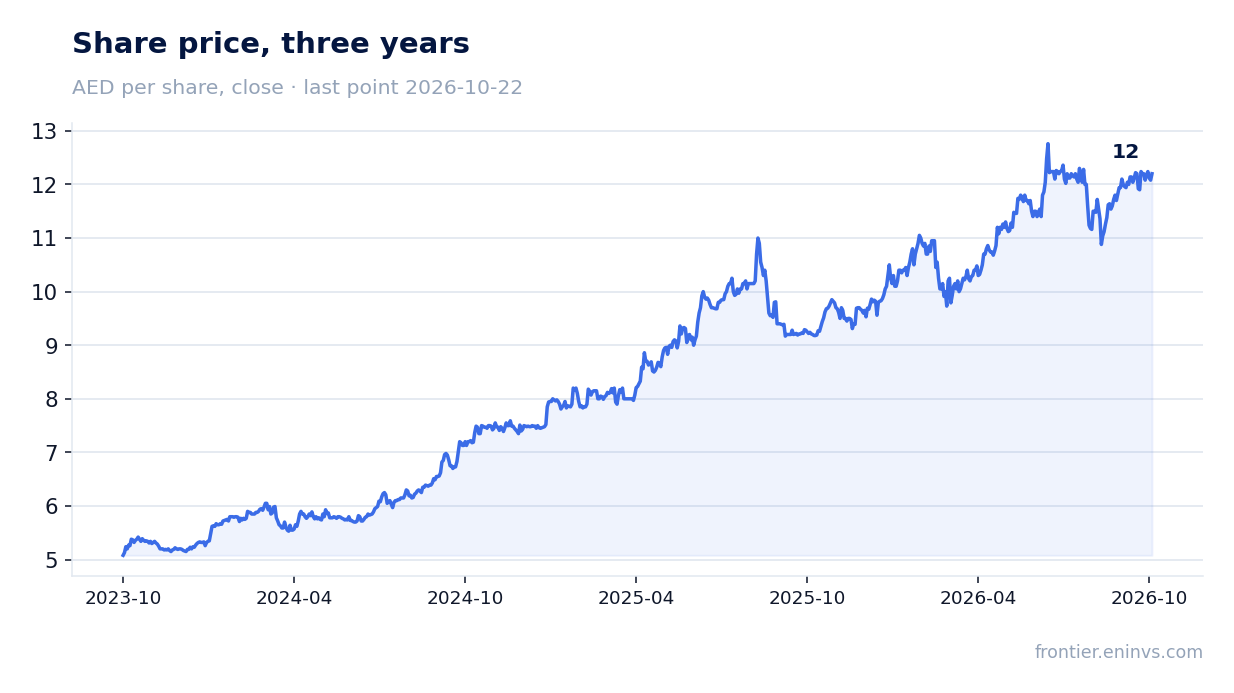
A 5.4% dividend yield remains the main support for the valuation
The trailing-twelve-month dividend yield is 5.4%. That is above many companies in the sector and is the main argument for the share at the current price.
Payouts are covered by free cash flow: it was positive over the trailing twelve months, and net debt is low. This reduces the risk of a dividend cut.
A yield of 5.4% is well above the key rate, making the share attractive to income-oriented investors. However, at a P/E of 17.6 the market is already paying for payout stability.
EV/EBITDA of 10.3 is 29% above its own three-year average of 8.0
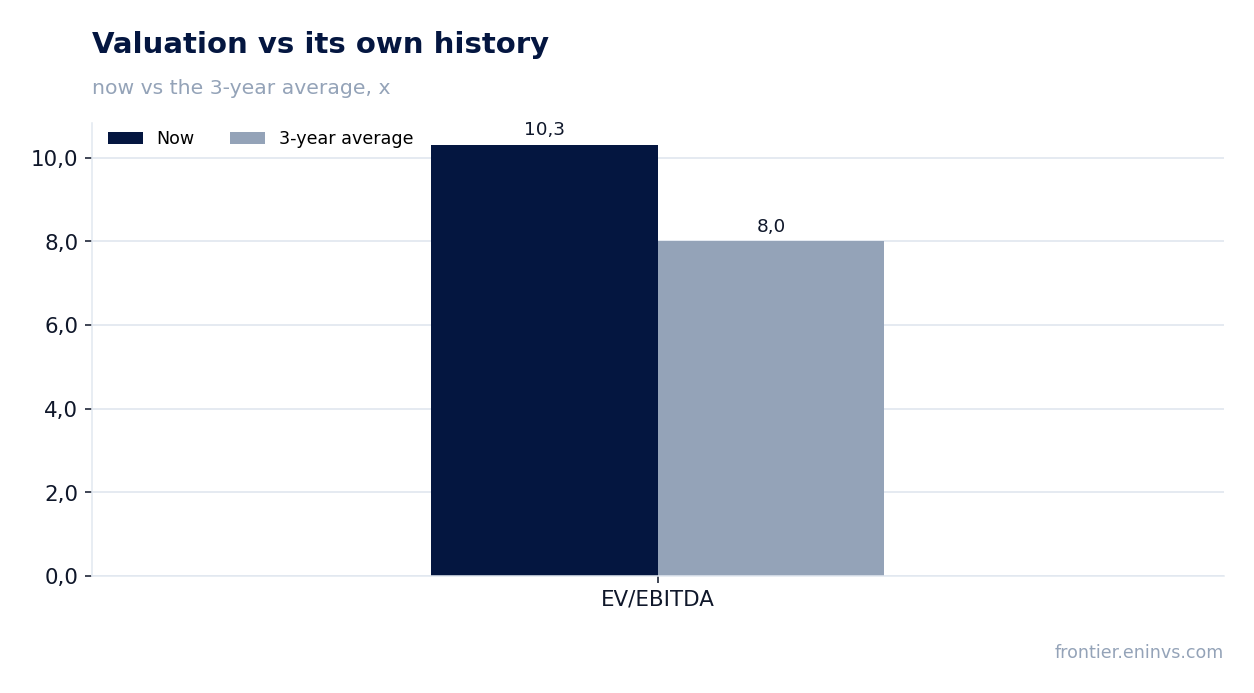
The trailing-twelve-month EV/EBITDA multiple is 10.3. That is 29% above its own three-year average of 8.0, meaning the share is more expensive than usual relative to its history.
The trailing-twelve-month P/E is 17.6 and return on equity is 10.7%. The combination of moderate growth and a premium to history limits re-rating potential.
On the portal's model, fair value implies +7% upside to the current price. That is a modest gain that does not offset the premium to the historical multiple.
Valuation on the latest reported figures
| Metric | Value |
|---|---|
| Market cap | 55.3 bn AED |
| P/E (LTM) | 17.6 |
| EV/EBITDA (LTM) | 10.3 |
| P/B | 5.45 |
| Net debt / EBITDA (LTM) | 0.20 |
| Operating cash flow (LTM) | 5.46 bn |
| ROE | 10.7% |
| Dividend yield (12m) | 5.4% |
| EV/EBITDA, 3-year average | 8.0 |
Bottom line
The quarter's strength was accelerating revenue growth to +7.1% and a recovery in operating cash flow to AED 2,230.7m, which covered capital expenditure and dividends. The weak spot is the EBITDA margin, which slipped to 34.9% as costs outgrew revenue. Net debt fell to AED 1.1bn, with leverage at 0.2x EBITDA. The key question for a holder is whether the EV/EBITDA premium of 10.3 to its own history of 8.0 is justified by profit growth of around 7% and a 5.4% dividend yield. The verdict is neutral: the share is fairly valued but offers no margin of safety.
Open the company's financial profile DU →
See also: market overview · valuation map · stock screeners