TECOM: revenue accelerated to +11.7%, but profit is flat year on year
TECOM's third-quarter 2026 results showed revenue of AED 808.6 mn and net profit of AED 416.6 mn. Year-on-year revenue growth was +11.7%, faster than in the second quarter (+10.8%), but net profit added only +11.6%, and the net margin stayed at 51.5%. With leverage at 2.42x EBITDA and EV/EBITDA at 9.3 versus its own three-year average of 9.7, the stock has no clear edge, so at the current price the share looks neutral.
Key takeaways
— Revenue accelerated to +11.7% year on year, but profit grew only 11.6% – the margin is not expanding
— The net margin stayed at 51.5%, meaning the entire revenue increase went into costs
— Net debt rose from AED 4.9 bn on 30 June to AED 5.4 bn on 30 September
— Leverage at 2.42x EBITDA is moderate, but the facts do not disclose its direction
— EV/EBITDA at 9.3 is in line with its own three-year average of 9.7
— A dividend yield of 5.4% remains the main support for the shareholder
— On the portal's model, the upside to fair value is +7%
Attractiveness
Key figures, AED bn
| Metric | Q3 2025 | Q3 2026 | Change |
|---|---|---|---|
| Revenue | 0.72 | 0.81 | +11.7% |
| EBITDA | 0.54 | — | — |
| Operating profit | 0.42 | — | — |
| Net profit | 0.37 | 0.42 | +11.6% |
| Operating cash flow | 0.53 | 0.56 | +5.6% |
| EBITDA margin | 75.0% | — | — |
| Net margin | 51.5% | 51.5% | +0.0 pp |
Revenue accelerated to +11.7% year on year, but profit grew only 11.6% – the margin is not expanding
In the third quarter of 2026, TECOM's revenue was AED 808.6 mn, up 11.7% year on year. This is an acceleration from the second quarter, when growth was 10.8%. Quarterly revenue is rising sequentially: AED 754.6 mn in the first quarter, AED 785.7 mn in the second and AED 808.6 mn in the third.
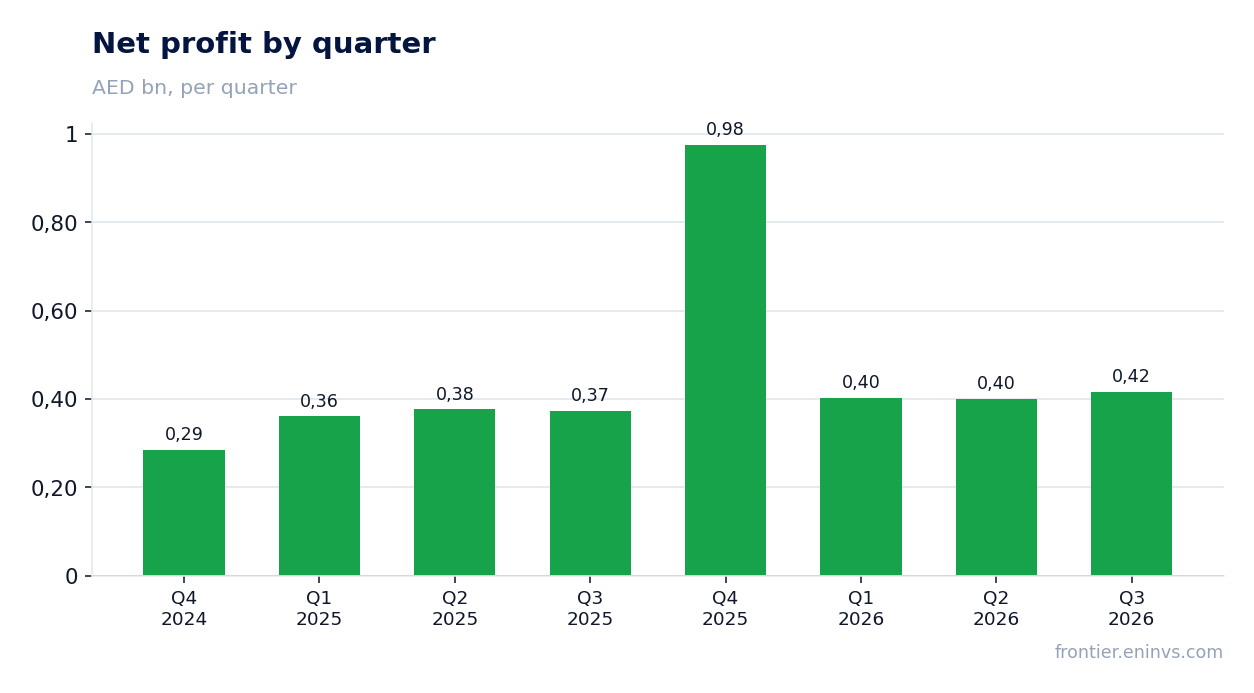
Net profit for the quarter reached AED 416.6 mn, up 11.6% year on year. The gap with revenue growth of 0.1 percentage points shows that the company is not improving operating efficiency: each additional dirham of revenue brings roughly the same profit as before.
For the shareholder, this means that business growth is not yet translating into margin expansion. Accelerating revenue is a positive signal, but without margin expansion it does not create additional value per share.
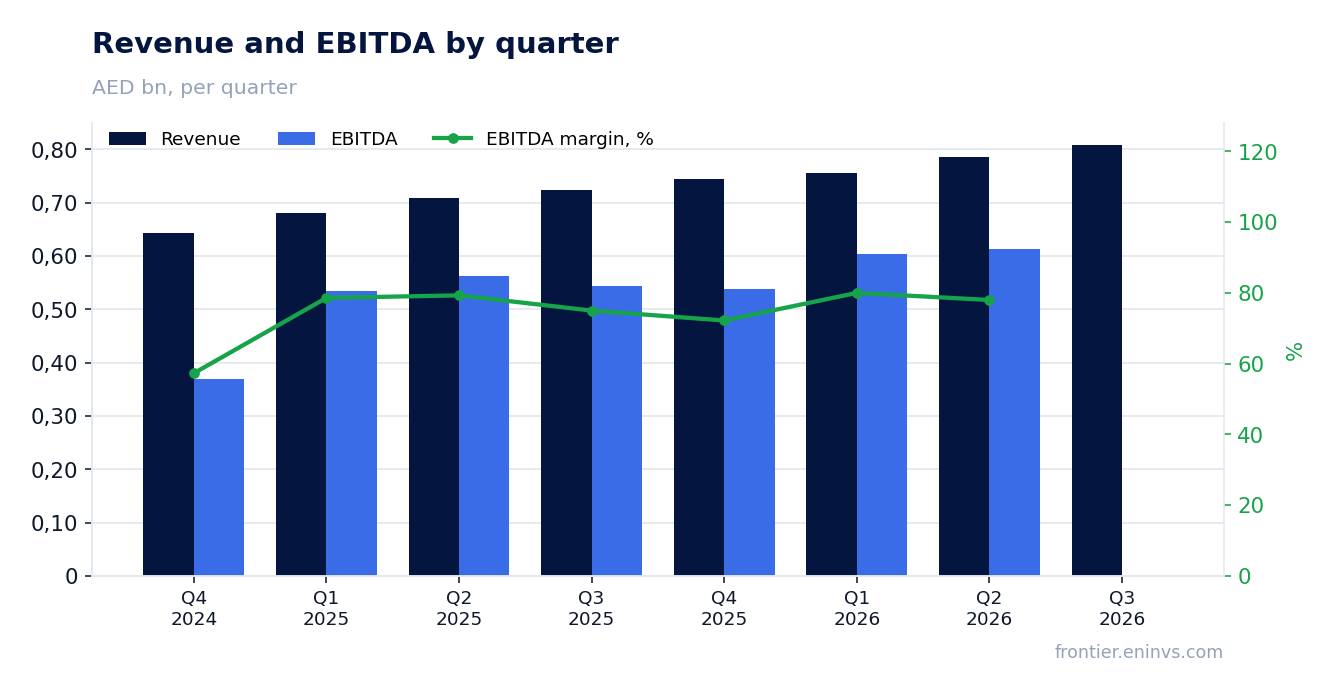
The net margin stayed at 51.5%, meaning the entire revenue increase went into costs
The net margin in the third quarter of 2026 was 51.5%, exactly the same as a year earlier. With revenue up 11.7%, profit rose 11.6%, meaning the company maintained its share of profit in revenue but did not increase it.
This means operating costs are growing in proportion to revenue. Without a breakdown by cost line, it is impossible to say which line is absorbing the increase, but the fact remains: no margin expansion occurred.
For the investor, a stable margin is reliability, not a growth driver. For earnings per share to grow faster than revenue, the company needs either to raise prices or cut costs, and neither is visible in the reported quarter.
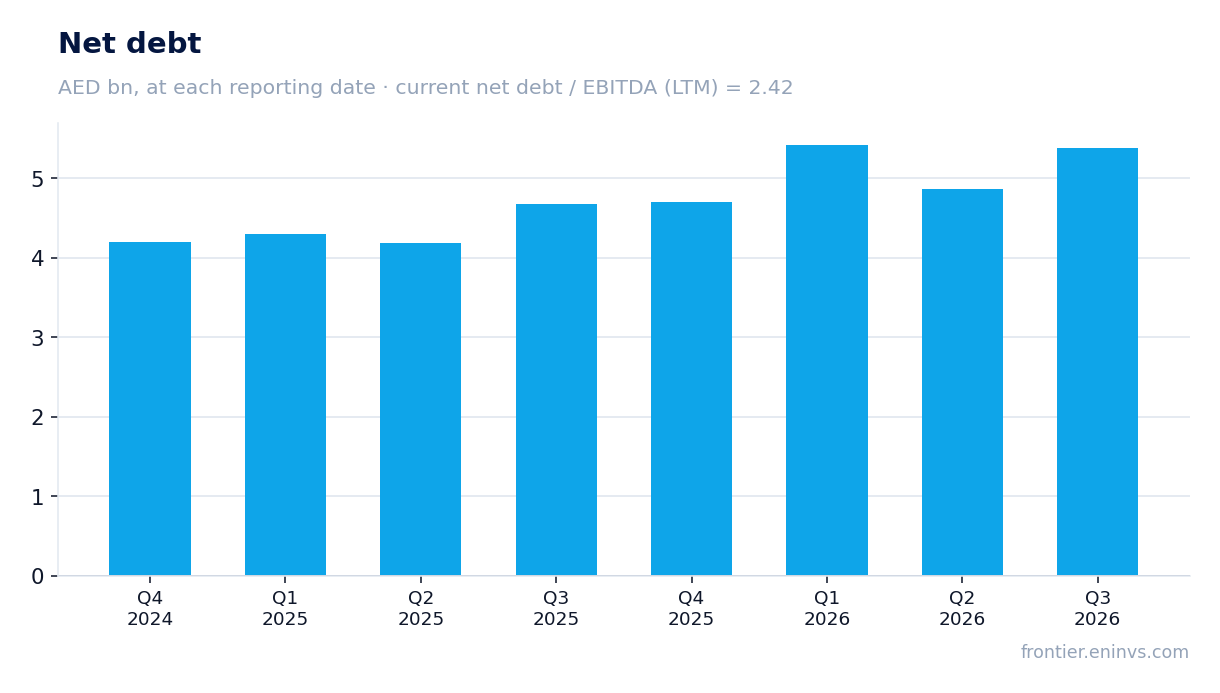
Net debt rose from AED 4.9 bn on 30 June to AED 5.4 bn on 30 September
TECOM's net debt on 30 September 2026 was AED 5.4 bn versus AED 4.9 bn on 30 June – an increase of AED 0.5 bn over the quarter. Over twelve months, from 30 September 2025, net debt rose from AED 4.7 bn to AED 5.4 bn, i.e. by AED 0.7 bn.
The rise in debt is partly explained by seasonality and the payment schedule, but the facts provide no breakdown. What matters is that the company generates operating cash flow: AED 556.9 mn in the third quarter of 2026, which covers interest expenses and part of capital expenditure.
Leverage at 2.42x EBITDA remains moderate for a company with such profitability. However, the facts do not contain the previous value of this ratio, so it cannot be said that leverage rose or fell – only the current level can be stated.
Leverage at 2.42x EBITDA is moderate, but the facts do not disclose its direction
The ratio of net debt to trailing-twelve-month EBITDA is 2.42. This is a moderate level for a company with operating profitability above 50%, leaving room for manoeuvre and not pressuring the dividend.
Operating cash flow in the third quarter of 2026 was AED 556.9 mn, comfortably covering interest expenses. With such a flow, the company can service its debt without raising new financing.
However, the facts do not contain the previous value of the ratio, so it cannot be said that leverage is rising or falling. For the investor, this means debt risk remains controlled, but its trend requires monitoring in the next report.
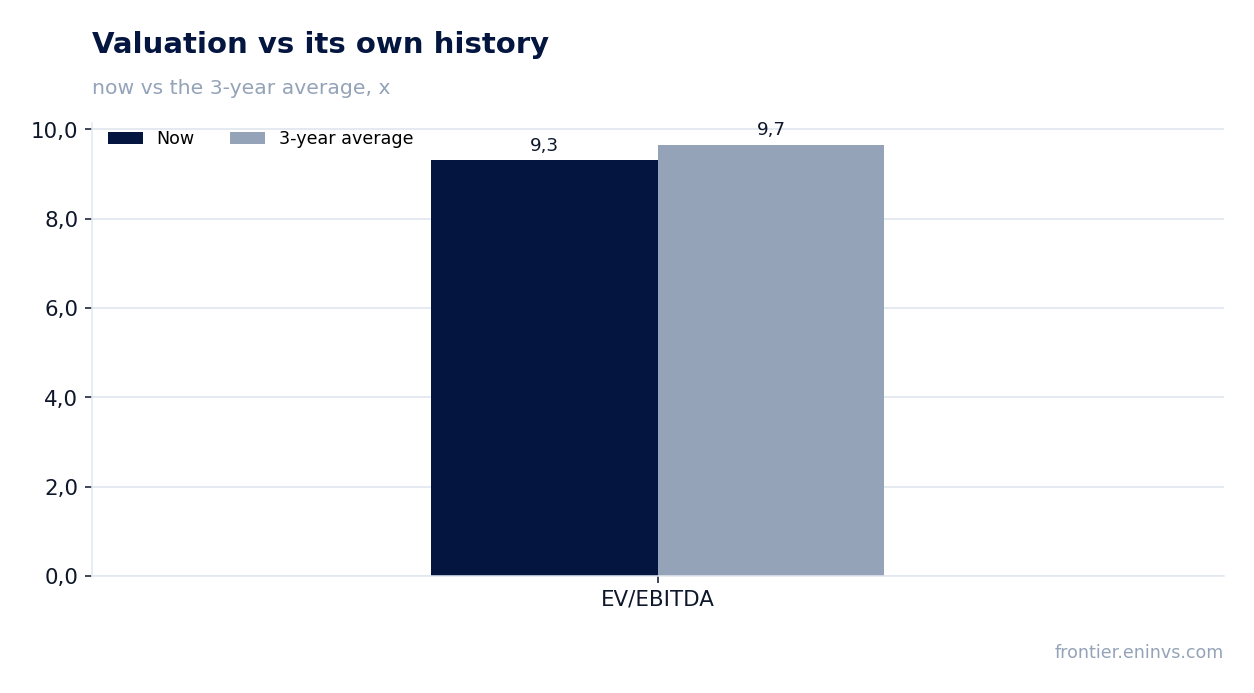
EV/EBITDA at 9.3 is in line with its own three-year average of 9.7
The trailing-twelve-month EV/EBITDA multiple is 9.3, which is 4% below its own three-year average of 9.7. This is in line with the historical level rather than a deviation from it: the market values the company roughly as it did over the previous three years.
The trailing-twelve-month P/E is 7.28, reflecting high profitability and earnings stability. Market capitalisation is AED 16.0 bn, while net debt is AED 5.4 bn.
On the portal's model, which compares EBITDA growth with the target multiple, the upside of the share to fair value is estimated at +7%. This is a moderate upside that does not create a strong case for buying.
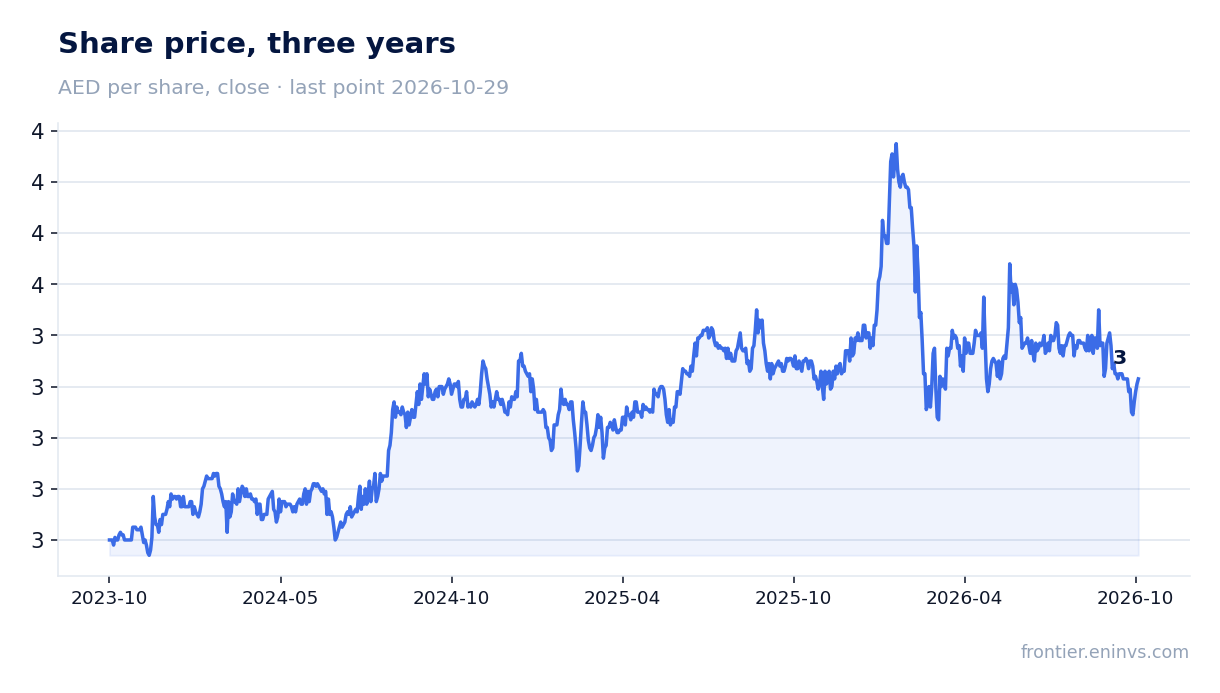
A dividend yield of 5.4% remains the main support for the shareholder
The trailing-twelve-month dividend yield is 5.45%. This is a substantial figure that provides the shareholder with regular income and supports the valuation of the stock.
The company pays dividends out of net profit, which over the last twelve months amounted to AED 2.2 bn. With a market capitalisation of AED 16.0 bn, a dividend yield of 5.4% corresponds to a payout of about AED 0.87 bn per year, or roughly 40% of profit.
For the investor, the dividend is the main argument for holding the stock. However, the sustainability of the payout depends on the company's ability to generate cash flow, which in the third quarter was AED 556.9 mn and covers both dividends and capital expenditure.
On the portal's model, the upside to fair value is +7%
Our valuation model, which compares EBITDA growth with the target multiple, shows an upside of the share to fair value of +7%. This is a moderate result that does not distinguish the stock from alternatives.
At the current price and a dividend yield of 5.45%, the total return for the shareholder consists of dividends and upside. However, the 7% upside does not compensate for the risks associated with the lack of margin expansion and rising debt.
For the investor, this means the stock is fairly valued but without a margin of safety. The next report will show whether the company can accelerate profit growth or improve its margin, which would be a trigger for a re-rating.
Valuation on the latest reported figures
| Metric | Value |
|---|---|
| Market cap | 16.0 bn AED |
| P/E (LTM) | 7.3 |
| EV/EBITDA (LTM) | 9.3 |
| P/B | 2.03 |
| Net debt / EBITDA (LTM) | 2.42 |
| Operating cash flow (LTM) | 2.22 bn |
| ROE | 20.2% |
| Dividend yield (12m) | 5.4% |
| EV/EBITDA, 3-year average | 9.7 |
Bottom line
The strong point of the report was revenue growth to AED 808.6 mn, accelerating to +11.7% year on year. However, profit grew only 11.6%, and the margin stayed at 51.5%, meaning the entire revenue increase went into costs. Net debt rose to AED 5.4 bn, and its ratio to EBITDA of 2.42 gives no cause for concern but also no cushion. A dividend yield of 5.4% and an EV/EBITDA of 9.3 in line with its own history make the stock fairly valued. The verdict is neutral: the share looks neither cheap nor expensive, and the main question for the holder is whether the company can expand its margin in the next quarter.
Open the company's financial profile TECOM →
See also: market overview · valuation map · stock screeners