Ambev: revenue up 8.3% but EBITDA barely moved – margin down 2.7 pp

Ambev reported third-quarter 2026 results. Revenue came in at USD 4,193.5 mn, up 8.3% year on year, EBITDA at USD 1,475.7 mn, up just 0.5%, and net profit at USD 824.4 mn, down 8.8%. Revenue growth decelerated from 10.1% in the second quarter to 8.3%, while the EBITDA margin compressed from 37.9% to 35.2%: the share looks neutral – the EV/EBITDA multiple of 6.6 sits exactly at its own three-year average, the 0.9% dividend yield is too thin, and the portal model implies only -3% to fair value.
Key takeaways
— Revenue grew 8.3% but growth decelerated from 10.1% a quarter earlier
— EBITDA added just 0.5%, and the margin compressed from 37.9% to 35.2%
— Net profit fell 8.8%, and the net margin dropped from 23.3% to 19.7%
— Operating cash flow of USD 1,491.0 mn covers profit with room to spare
— Net debt is negative at -USD 3.7 bn, or -0.62x LTM EBITDA
— The 0.9% dividend yield does not compensate for weak profit growth
— EV/EBITDA of 6.6 sits exactly at its three-year average of 6.5
Attractiveness
Key figures, USD bn
| Metric | Q3 2025 | Q3 2026 | Change |
|---|---|---|---|
| Revenue | 3.87 | 4.19 | +8.3% |
| EBITDA | 1.47 | 1.48 | +0.5% |
| Operating profit | 1.17 | 1.07 | -8.7% |
| Net profit | 0.90 | 0.82 | -8.8% |
| Operating cash flow | 1.29 | 1.49 | +15.6% |
| Capex | 0.19 | — | — |
| EBITDA margin | 37.9% | 35.2% | -2.7 pp |
| Net margin | 23.3% | 19.7% | -3.6 pp |
Revenue grew 8.3% but growth decelerated from 10.1% a quarter earlier
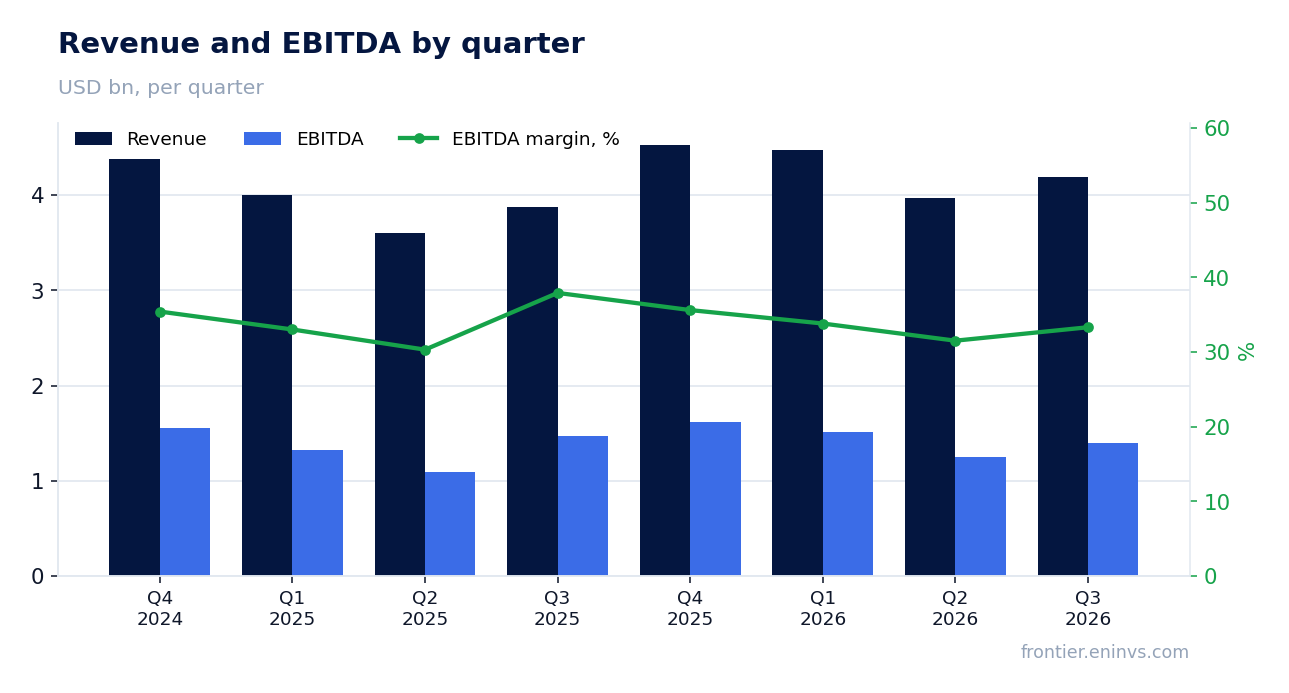
In the third quarter of 2026 Ambev's revenue reached USD 4,193.5 mn, up 8.3% year on year. That is noticeably slower than the 10.1% growth in the second quarter: the trend decelerated. This is the second consecutive quarter of deceleration after the 11.8% peak in the first quarter of 2026.
Over the trailing twelve months revenue amounted to USD 17,200.0 mn. The company remains a large player with resilient demand, but the growth rate is easing. The report does not disclose the reason for the slowdown, so we stick to the fact: growth remains positive, but its pace is falling.
EBITDA added just 0.5%, and the margin compressed from 37.9% to 35.2%
EBITDA in the third quarter of 2026 was USD 1,475.7 mn, up just 0.5% year on year. With revenue growing 8.3%, costs must have grown faster than income. The EBITDA margin fell from 37.9% to 35.2% – a 2.7 percentage point decline.
Operating profit came in at USD 1,068.3 mn. A 2.7 pp margin compression on revenue of USD 4.2 bn implies roughly USD 113 mn of EBITDA foregone relative to last year's profitability level. The facts do not disclose which cost line drove this; what is clear is that operating leverage worked in reverse.
Net profit fell 8.8%, and the net margin dropped from 23.3% to 19.7%
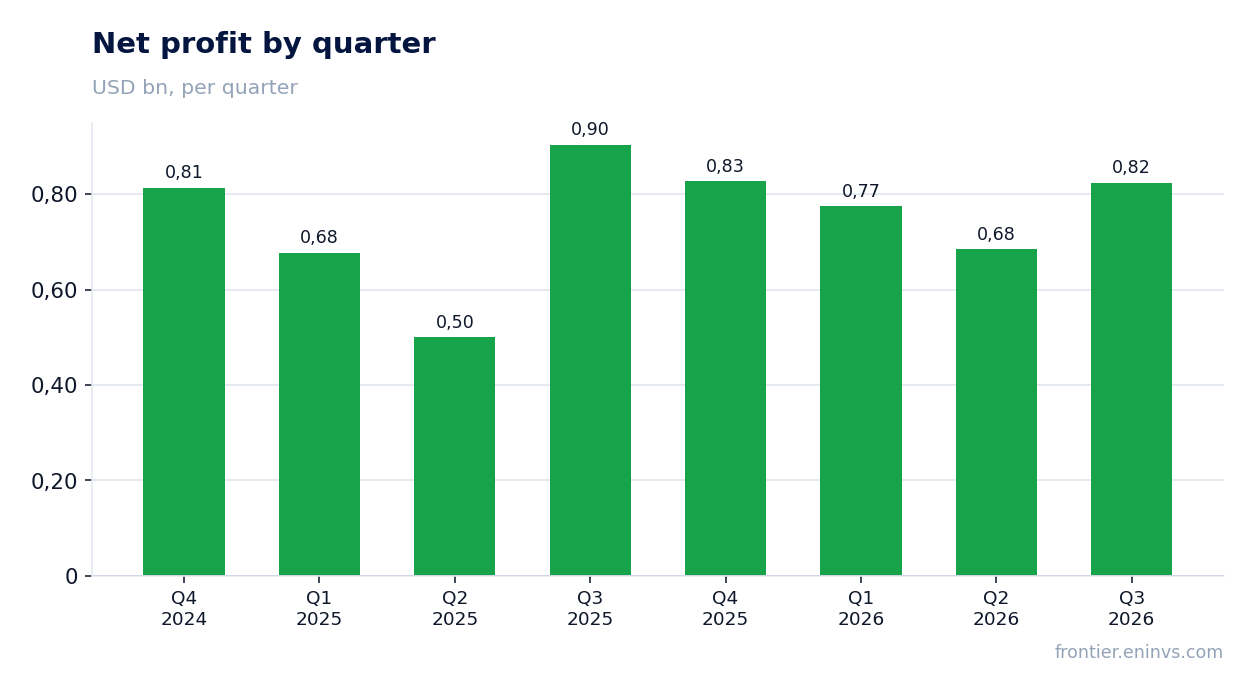
Net profit in the third quarter of 2026 was USD 824.4 mn, down 8.8% year on year. The net margin fell from 23.3% to 19.7%. The profit decline is steeper than the EBITDA margin compression, pointing to additional pressure below the operating line – likely financial or tax items, though the facts do not disclose the exact cause.
Over the trailing twelve months net profit was USD 3,110.2 mn. Against a market capitalisation of USD 41,542.6 mn that gives a P/E LTM of 13.4. The multiple is moderate, but it rests on profit that was falling in the reported quarter.
Operating cash flow of USD 1,491.0 mn covers profit with room to spare
Operating cash flow in the third quarter of 2026 was USD 1,491.0 mn – nearly double net profit for the same period. This is a strong point of the report: the company converts profit into cash efficiently, and the cash result did not suffer from the margin decline.
Over the trailing twelve months operating cash flow was USD 4,838.7 mn. The facts do not include capital expenditure for the third quarter of 2026, so we do not calculate free cash flow for the quarter. In earlier quarters capex was moderate – USD 93.0 mn in the first quarter of 2026 and USD 173.3 mn in the second – pointing to a low-capital-intensity business.
Net debt is negative at -USD 3.7 bn, or -0.62x LTM EBITDA
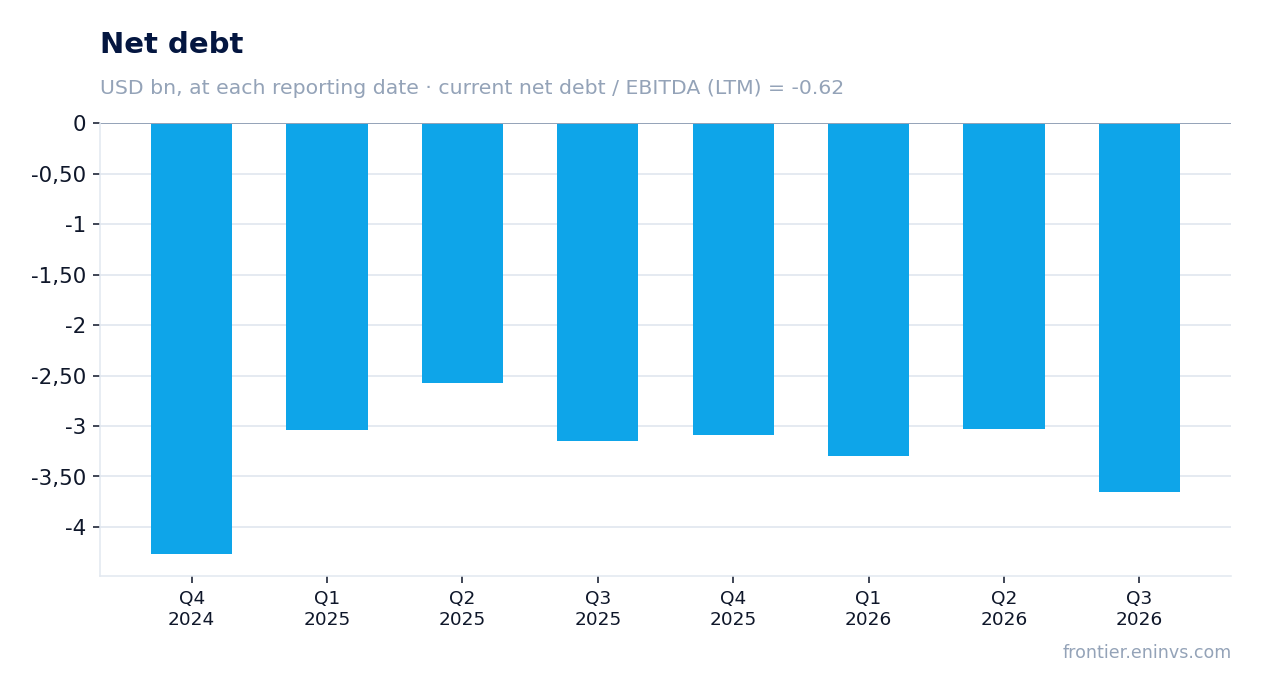
As of 30 September 2026 Ambev's net debt stood at -USD 3,657.6 mn, meaning the company holds more cash than it owes. The ratio of net debt to LTM EBITDA is -0.62. A negative value denotes a net cash position, not leverage.
Over the quarter net debt moved from -USD 3,032.1 mn on 30 June 2026 to -USD 3,657.6 mn on 30 September – the cash cushion grew by USD 0.6 bn. Over the year, from -USD 3,148.7 mn on 30 September 2025, it increased by USD 0.5 bn. This is the result of strong operating cash flow with moderate capital expenditure.
The 0.9% dividend yield does not compensate for weak profit growth
Ambev's trailing twelve-month dividend yield is 0.9%. That is a very low level – well below the yield on risk-free instruments and not comparable with the key rate. For the company's dividend history this looks modest, although the facts do not include past payouts for comparison.
Our estimate of the current-year dividend rests on trailing twelve-month net profit of USD 3,110.2 mn and a payout ratio not disclosed in the facts. If the current yield holds, the payout will remain small. The risk of a lower dividend is tied to falling net profit – it declined 8.8% in the third quarter, and if that trend continues the payout base will shrink.
EV/EBITDA of 6.6 sits exactly at its three-year average of 6.5
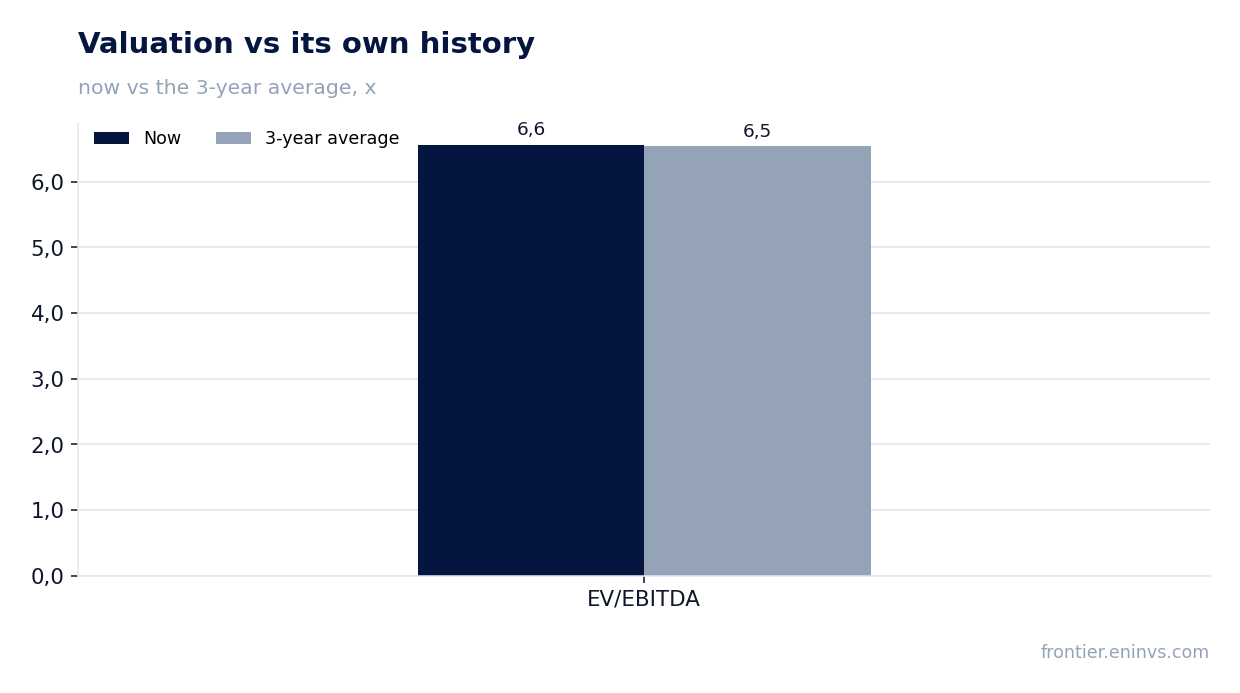
The trailing twelve-month EV/EBITDA multiple is 6.6 against a three-year average of 6.5. The difference is within 5%, meaning the share is valued exactly as it was on average over three years. There is neither a discount nor a premium to its own history.
The portal model, which compares EBITDA growth with the target multiple and market capitalisation, implies -3% to fair value. In other words, the current price is close to the model's estimate and offers no upside. A P/E LTM of 13.4 with falling profit does not look cheap.
Valuation on the latest reported figures
| Metric | Value |
|---|---|
| Market cap | 41.5 bn USD |
| P/E (LTM) | 13.4 |
| EV/EBITDA (LTM) | 6.6 |
| P/B | 2.56 |
| Net debt / EBITDA (LTM) | -0.62 |
| Operating cash flow (LTM) | 4.84 bn |
| ROE | 18.8% |
| Dividend yield (12m) | 0.9% |
| EV/EBITDA, 3-year average | 6.5 |
Bottom line
The report's strength is cash flow: USD 1,491.0 mn from operations is nearly double net profit, and net debt remains negative at -USD 3.7 bn. The weakness is the margin: EBITDA grew just 0.5%, profitability fell from 37.9% to 35.2%, and net profit declined 8.8%. The EV/EBITDA multiple of 6.6 sits exactly at its three-year average, and the portal model implies -3% to fair value. With a 0.9% dividend yield and decelerating revenue, the share looks neutral: a strong balance sheet and cash flow are offset by margin compression and no valuation upside.
Open the company's financial profile ABEV →
See also: market overview · valuation map · stock screeners