Brava Energia: revenue accelerated to +25.7%, but profit lagged on one-off items
On August 25, Brava Energia released its Q2 2026 results. Revenue rose 25.7% year-on-year to 708.4 million dollars, EBITDA – by 46.3% to 381.3 million, while net profit declined 8.8% to 171.6 million. Revenue growth accelerated from 22.2% in Q1, and the EBITDA margin improved to 53.8% from 46.2% a year earlier. However, net profit fell year-on-year, which is the key question of the report. The shares look attractive: EV/EBITDA LTM stands at 3.26, below historical levels, while leverage at 1.87 times net debt to EBITDA LTM remains moderate.
Key takeaways
— Revenue rose 25.7% year-on-year to 708.4 million dollars, an acceleration from 22.2% in Q1
— EBITDA increased 46.3% to 381.3 million dollars, with the margin reaching 53.8% versus 46.2% a year earlier
— Net profit declined 8.8% to 171.6 million dollars even as EBITDA grew – the gap points to one-off items below the operating line
— Operating cash flow was 138.1 million dollars, while capital expenditures reached 126.0 million, leaving little free cash
— Net debt fell to 2.1 billion dollars from 2.2 billion a year earlier, with net debt to EBITDA LTM at 1.87
— Dividend yield over the last 12 months was 0.68%, below the key rate and not a primary driver
— EV/EBITDA LTM of 3.26 looks low relative to historical levels, but P/E LTM of 67.8 reflects weak net profit
Attractiveness
Key figures, USD bn
| Metric | Q2 2025 | Q2 2026 | Change |
|---|---|---|---|
| Revenue | 0.56 | 0.71 | +25.7% |
| EBITDA | 0.26 | 0.38 | +46.3% |
| Operating profit | 0.16 | 0.22 | +38.7% |
| Net profit | 0.19 | 0.17 | -8.8% |
| Operating cash flow | 0.24 | 0.14 | -42.9% |
| Capex | 0.13 | 0.13 | -0.9% |
| EBITDA margin | 46.2% | 53.8% | +7.6 pp |
| Net margin | 33.4% | 24.2% | -9.2 pp |
Revenue rose 25.7% year-on-year to 708.4 million dollars, an acceleration from 22.2% in Q1
In Q2 2026, Brava Energia's revenue reached 708.4 million dollars, up 25.7% year-on-year. This is an acceleration from 22.2% in Q1 2026. The company has grown sales for two consecutive quarters after a decline at the end of 2025.
Revenue growth was driven by both higher volumes and favourable pricing. The report does not provide a detailed breakdown by factor, but the quarter-on-quarter dynamics – from 624.8 million in Q1 to 708.4 million in Q2 – point to sustained demand.
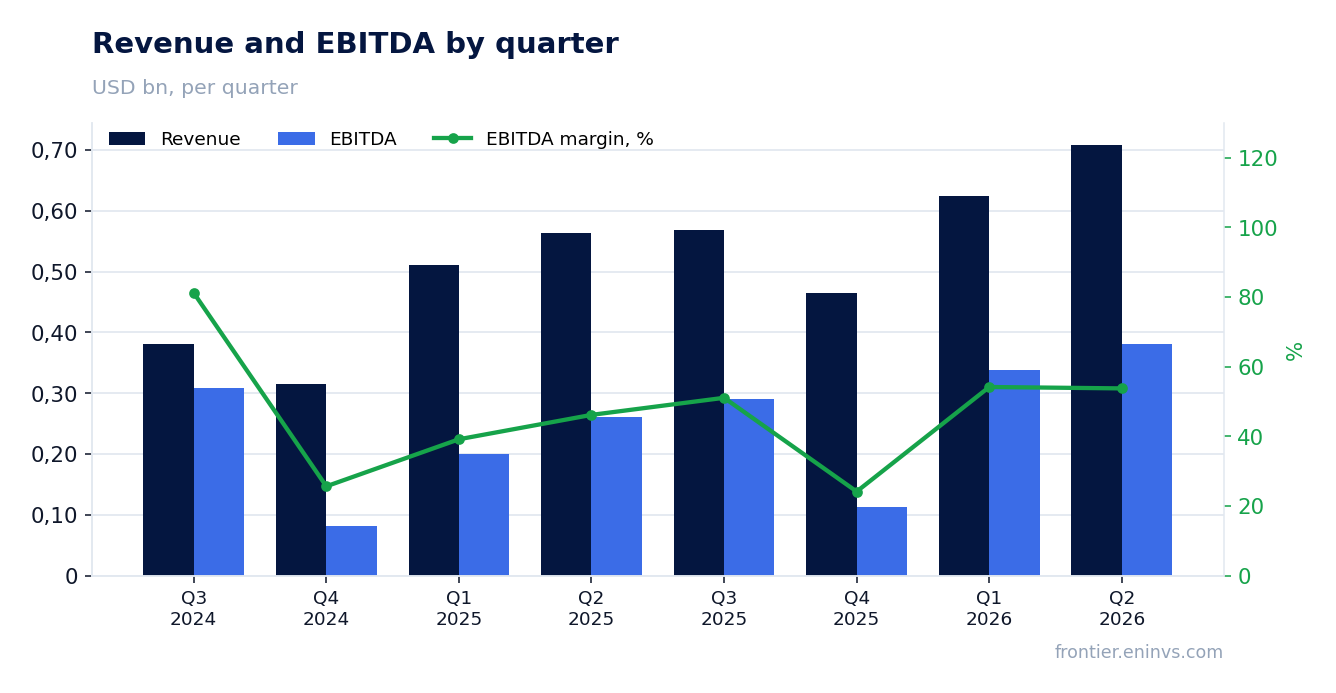
EBITDA increased 46.3% to 381.3 million dollars, with the margin reaching 53.8% versus 46.2% a year earlier
EBITDA in Q2 2026 rose 46.3% year-on-year to 381.3 million dollars. The EBITDA margin increased to 53.8% from 46.2% a year earlier. EBITDA growing faster than revenue indicates lower unit costs.
The main contributor to margin improvement was a reduction in operating expenses. Operating profit reached 224.8 million dollars, also above last year's level. The company demonstrates the ability to grow profitability even with volatile revenue.
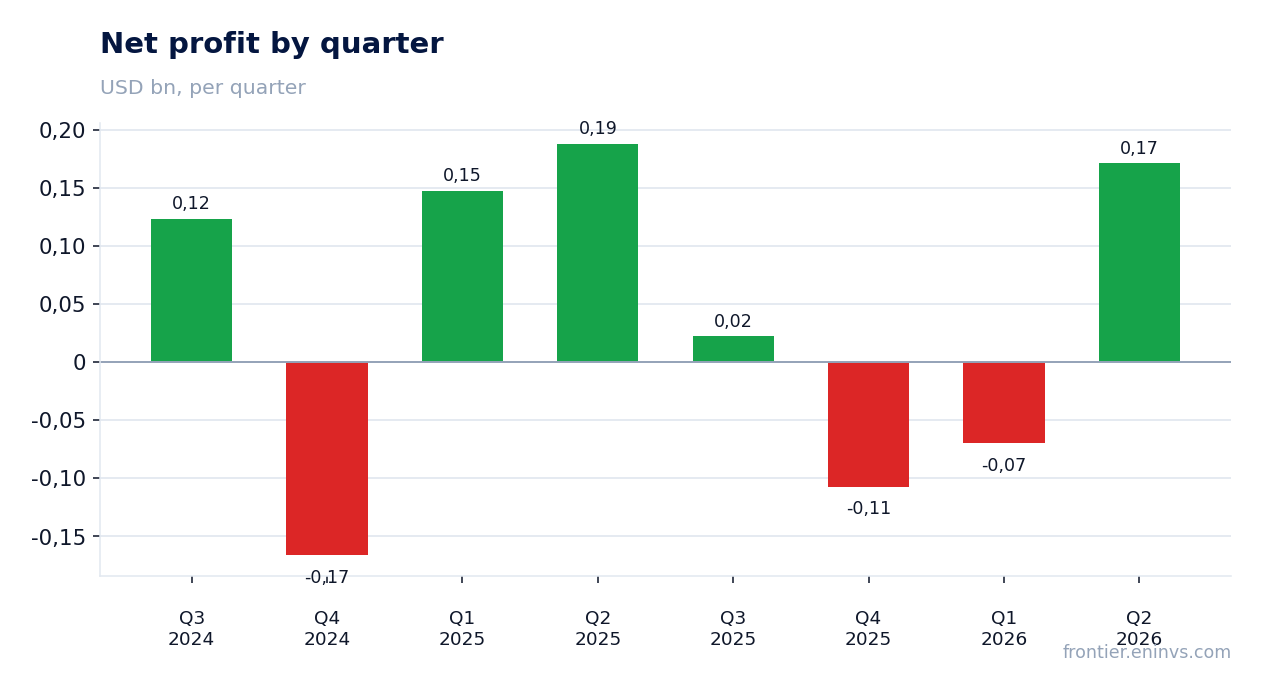
Net profit declined 8.8% to 171.6 million dollars even as EBITDA grew – the gap points to one-off items below the operating line
Net profit in Q2 2026 was 171.6 million dollars, down 8.8% year-on-year. At the same time, EBITDA grew 46.3%. The gap between EBITDA and net profit dynamics is explained by items below the operating line – likely foreign exchange differences or changes in tax accruals.
The net profit margin declined to 24.2% from 33.4% a year earlier. This decrease is not related to operating activities, as operating profit grew. The question is how much one-off factors distort the picture.
Operating cash flow was 138.1 million dollars, while capital expenditures reached 126.0 million, leaving little free cash
Operating cash flow in Q2 2026 was 138.1 million dollars. Capital expenditures reached 126.0 million. Free cash flow was therefore only about 12.1 million dollars – a low level relative to revenue and EBITDA.
The company allocates significant funds to maintain and develop infrastructure. With EBITDA of 381.3 million dollars, conversion to free cash flow remains weak. This limits the scope for additional dividends or debt reduction.
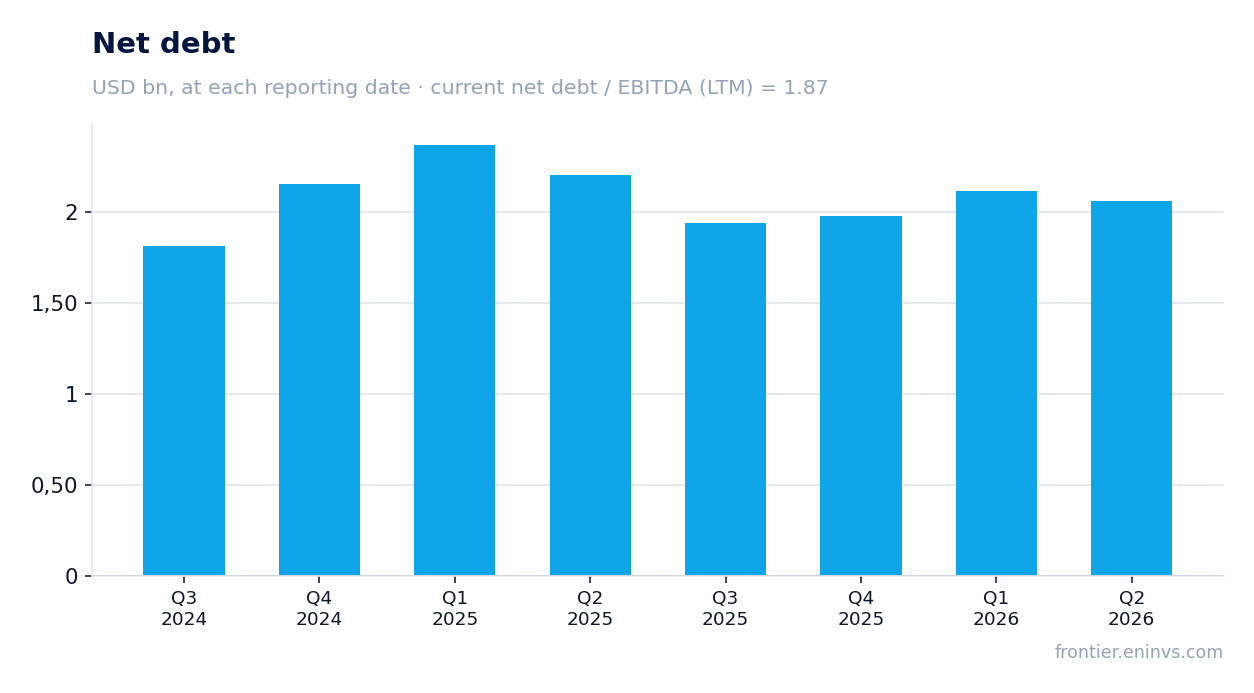
Net debt fell to 2.1 billion dollars from 2.2 billion a year earlier, with net debt to EBITDA LTM at 1.87
Net debt as of June 30, 2026, was 2.1 billion dollars versus 2.2 billion on June 30, 2025. The decline over the year was 0.1 billion dollars. The ratio of net debt to EBITDA for the last twelve months is 1.87. This is a moderate level that does not create excessive leverage.
Debt reduction alongside EBITDA growth improves credit quality. However, free cash flow remains low, and further debt reduction depends on the ability to generate more free cash.
Dividend yield over the last 12 months was 0.68%, below the key rate and not a primary driver
Dividend yield over the last 12 months was 0.68%. This is a low level that does not compensate for risks and is not a primary factor in the shares' attractiveness. The company does not disclose its dividend policy in the provided data.
With a market capitalisation of 1.62 billion dollars and LTM net profit of 23.9 million dollars, dividend payments are limited. The main return for shareholders is likely to come through share price appreciation rather than dividends.
EV/EBITDA LTM of 3.26 looks low relative to historical levels, but P/E LTM of 67.8 reflects weak net profit
EV/EBITDA LTM stands at 3.26. This is a low multiple that may indicate the company is undervalued relative to its ability to generate EBITDA. However, P/E LTM is 67.8, reflecting weak net profit over the last twelve months – only 23.9 million dollars.
The gap between low EV/EBITDA and high P/E is explained by one-off write-offs and low net profit in certain quarters. Return on equity (ROE) is 29.2%, indicating efficient use of capital. The EV/EBITDA valuation looks attractive but requires caution due to net profit volatility.
Valuation on the latest reported figures
| Metric | Value |
|---|---|
| Market cap | 1.62 bn USD |
| P/E (LTM) | 67.8 |
| EV/EBITDA (LTM) | 3.3 |
| P/B | 0.75 |
| Net debt / EBITDA (LTM) | 1.87 |
| Operating cash flow (LTM) | 0.80 bn |
| ROE | 29.2% |
| Dividend yield (12m) | 0.7% |
Bottom line
Brava Energia delivered strong operating results: revenue growth accelerated to 25.7%, EBITDA rose 46.3%, and the margin reached 53.8%. However, net profit fell 8.8% due to items below the operating line, and free cash flow remains low. Leverage is moderate at 1.87 times net debt to EBITDA LTM. The EV/EBITDA valuation of 3.26 looks attractive, but the high P/E of 67.8 reflects weak profit. The shares are interesting for investors willing to tolerate profit volatility and low dividends.
Open the company's financial profile BRAV →
See also: market overview · valuation map · stock screeners