Localiza: FY 2026 profit fell 98.8%, but that reflects last year's base, not a business collapse
Localiza has released its FY 2026 results. Revenue came in at 58.955 mn, EBITDA at 15.409 mn, and net profit at 4.04 mn. Year on year, revenue fell 99.2%, EBITDA 99.4%, and net profit 98.8%, which is explained by the base effect: in the prior reporting period, the figures were an order of magnitude higher. The EBITDA margin for FY 2026 was 26.1% versus 32.9% a year earlier, and the net margin was 6.9% versus 4.5%. At the same time, over the trailing twelve months, net profit stood at 662.9 mn and EBITDA at 2,888.8 mn, indicating a significant gap between the reporting period and trailing dynamics. Leverage as measured by net debt / EBITDA LTM is 0.01 – a level that poses no risk to holders. Trailing twelve-month dividend yield is 5.77%. According to the portal's model, upside to fair value is estimated at +26%. Against this backdrop, the verdict is 'rather attractive'.
Key takeaways
— FY 2026 revenue came in at 58.955 mn, down 99.2% year on year, but this reflects a base effect rather than a business collapse: the prior reporting period's figures were an order of magnitude higher.
— FY 2026 EBITDA fell to 15.409 mn, and the EBITDA margin declined to 26.1% from 32.9% a year earlier, pointing to pressure on costs or a change in revenue mix.
— FY 2026 net profit was just 4.04 mn, yet the net margin rose to 6.9% from 4.5%, indicating relative efficiency gains despite the fall in absolute figures.
— Over the trailing twelve months, net profit was 662.9 mn and EBITDA 2,888.8 mn, well above the reported period figures, suggesting FY 2026 does not reflect the current business trajectory.
— Leverage remains minimal: net debt / EBITDA LTM is 0.01, with net debt at 19,056 mn, posing no risk to financial stability.
— Trailing twelve-month dividend yield is 5.77%, above the yield on many debt instruments, supporting investment appeal.
— According to the portal's model, upside to fair value is estimated at +26%, which, combined with low leverage and dividend yield, makes the shares rather attractive.
Attractiveness
Key figures, USD bn
| Metric | FY 2025 | FY 2026 | Change |
|---|---|---|---|
| Revenue | 7.63 | 0.06 | -99.2% |
| EBITDA | 2.51 | 0.02 | -99.4% |
| Operating profit | 1.43 | -0.01 | -100.7% |
| Net profit | 0.34 | 0.00 | -98.8% |
| Operating cash flow | 0.39 | 0.00 | -99.8% |
| Capex | 0.08 | -0.01 | -118.1% |
| EBITDA margin | 32.9% | 26.1% | -6.8 pp |
| Net margin | 4.5% | 6.9% | +2.4 pp |
FY 2026 revenue came in at 58.955 mn, down 99.2% year on year, but this reflects a base effect rather than a business collapse: the prior reporting period's figures were an order of magnitude higher.
Localiza's FY 2026 revenue was 58.955 mn, down 99.2% from the same period a year earlier. Such a sharp decline is explained by the fact that revenue in the prior reporting period was an order of magnitude higher. This does not indicate a winding down of operations but merely highlights the incomparability of the base.
To understand the real dynamics, one should turn to quarterly data. In Q2 2026, revenue was 2,427.447 mn, up 36.7% from Q2 2025. In Q1 2026, year-on-year growth was 35.7%. Thus, over recent quarters, the business has shown sustained growth, not decline.
The gap between the reported and quarterly dynamics stems from the fact that FY 2026 likely covers a different set of periods than the previous reporting year. This is a methodological feature, not an operational problem. Investors should focus on quarterly trends, which show confident revenue expansion.
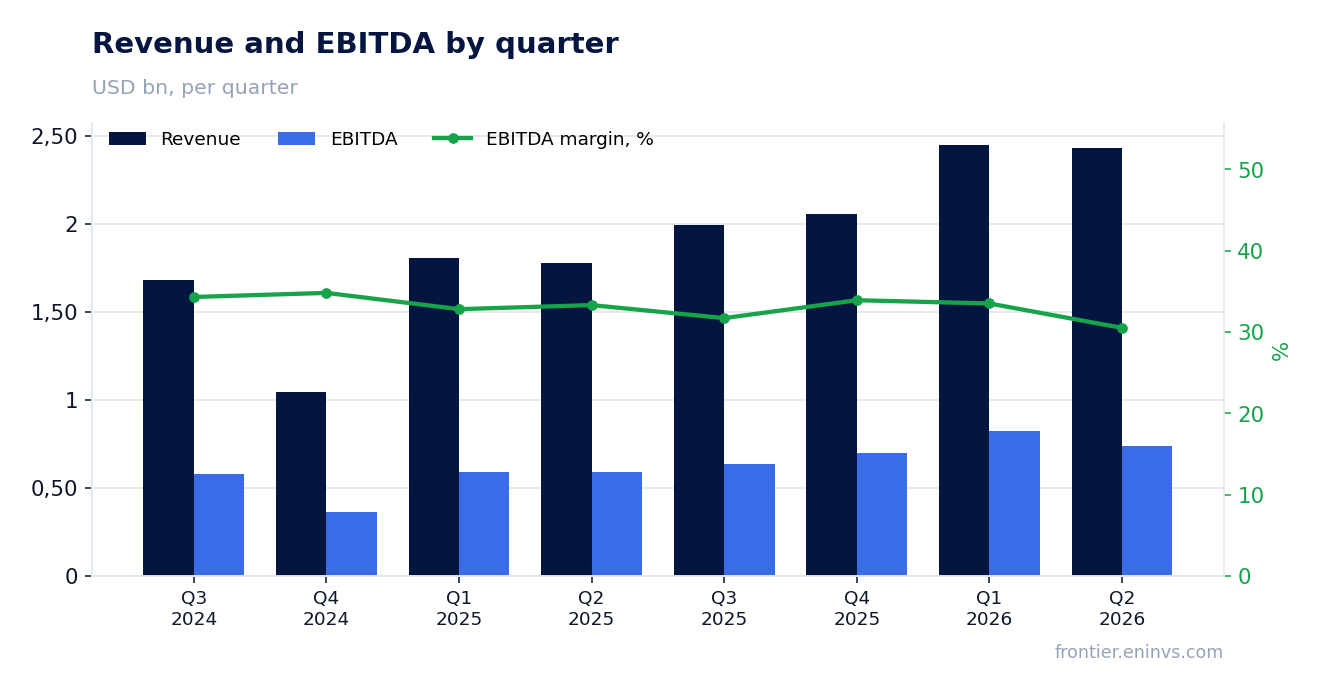
FY 2026 EBITDA fell to 15.409 mn, and the EBITDA margin declined to 26.1% from 32.9% a year earlier, pointing to pressure on costs or a change in revenue mix.
FY 2026 EBITDA was 15.409 mn, down 99.4% from the previous year. The EBITDA margin declined to 26.1% from 32.9% a year earlier. This decline in profitability could be due to both rising costs and a change in revenue mix.
Quarterly dynamics show that EBITDA in Q2 2026 was 739.467 mn, and in Q1 2026 – 820.262 mn. For comparison, in Q2 2025 EBITDA was 590.546 mn, and in Q1 2025 – 591.910 mn. Thus, in absolute terms, quarterly EBITDA is growing, but its ratio to revenue may be under pressure.
The annual margin decline contrasts with the growth in quarterly figures. This could be explained by one-off factors or seasonality, but in the absence of detailed company disclosure, we refrain from specific conclusions. It is important to monitor margin dynamics in future reports.
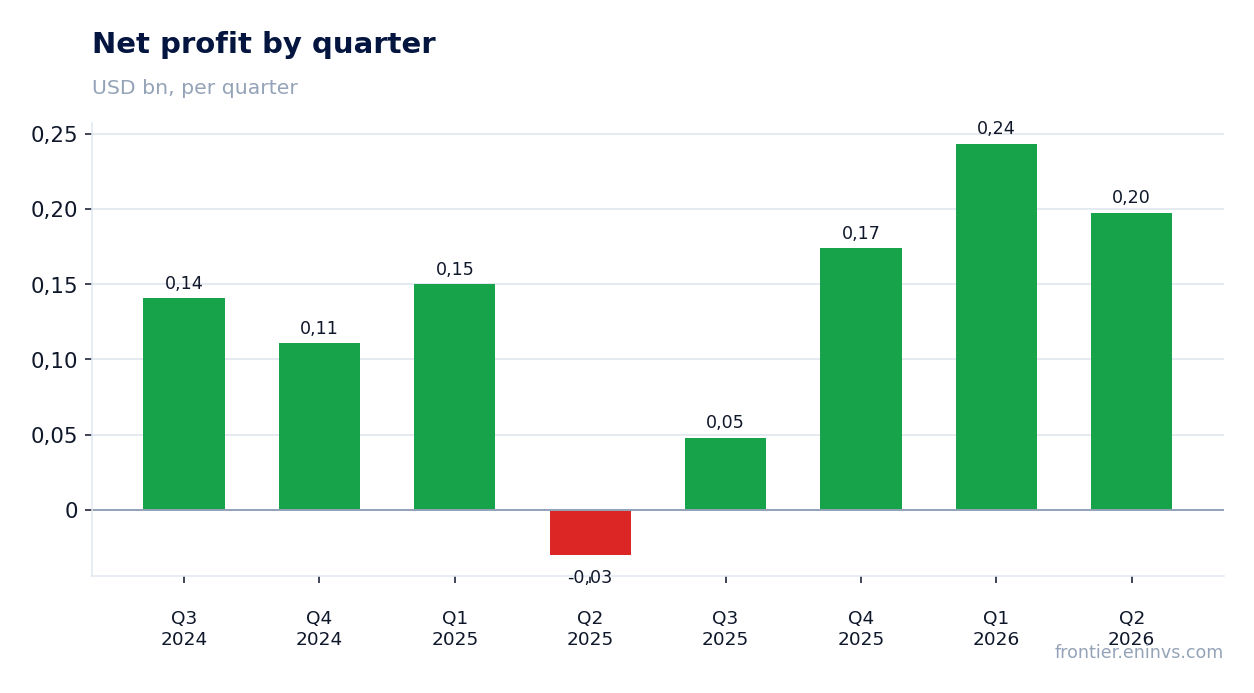
FY 2026 net profit was just 4.04 mn, yet the net margin rose to 6.9% from 4.5%, indicating relative efficiency gains despite the fall in absolute figures.
FY 2026 net profit was 4.04 mn, down 98.8% from the previous year. At the same time, the net margin rose to 6.9% from 4.5% a year earlier. This means the company has become more efficient at converting revenue into profit, despite the absolute decline.
Quarterly data confirm the positive trend: in Q2 2026, net profit was 197.524 mn, and in Q1 2026 – 243.527 mn. For comparison, in Q2 2025 there was a loss of 30.235 mn, and in Q1 2025 a profit of 149.903 mn. Thus, the company has returned to profitability after a loss in the second quarter of last year.
The annual net margin increase could be due to tax optimization or lower interest expenses. However, without additional information from the company, we cannot state this with certainty. The main point is that quarterly profit demonstrates resilience.
Over the trailing twelve months, net profit was 662.9 mn and EBITDA 2,888.8 mn, well above the reported period figures, suggesting FY 2026 does not reflect the current business trajectory.
Over the trailing twelve months (LTM), Localiza's net profit was 662.9 mn, and EBITDA was 2,888.8 mn. These figures significantly exceed the reported FY 2026 values, confirming that the annual numbers are distorted by the base effect and do not reflect the current state of the business.
LTM revenue was 8,900.0 mn, also above the reported level. LTM operating cash flow was 0.6 mn, which is a low figure, but it may be subject to seasonal fluctuations. It is important to note that LTM covers four quarters, including the latest reports, and is therefore more relevant for valuation.
Thus, investors should focus on LTM figures, which show that the business generates substantial profit and EBITDA. The gap between FY 2026 and LTM is due to accounting methodology, not operational deterioration.
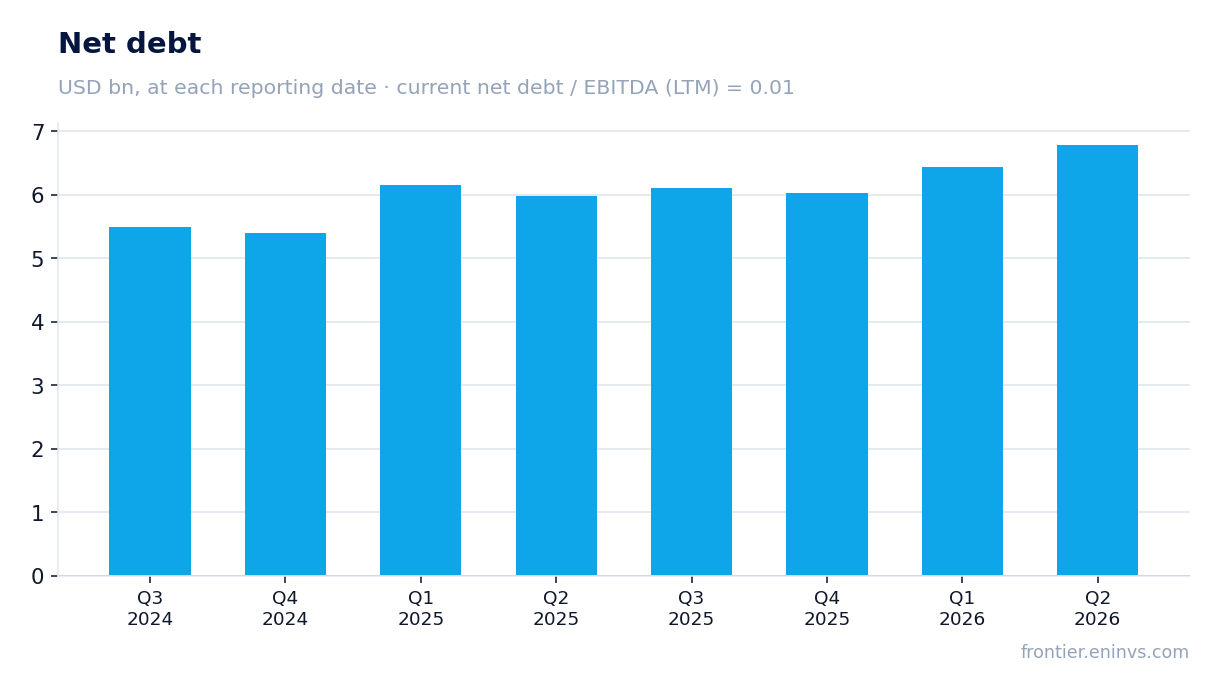
Leverage remains minimal: net debt / EBITDA LTM is 0.01, with net debt at 19,056 mn, posing no risk to financial stability.
Localiza's net debt at the latest reporting date was 19,056 mn. The ratio of net debt to trailing twelve-month EBITDA is 0.01. This is an extremely low level, indicating insignificant debt burden and high financial flexibility.
The decrease in net debt versus the previous reporting date was 6.8 bn RUB, and over the trailing twelve months – 6.0 bn RUB. This suggests the company is reducing debt, which positively affects risk. However, we do not have data on the earlier value of the net debt / EBITDA ratio, so we cannot state whether it improved or worsened.
Low leverage allows the company to remain resilient even amid revenue volatility. This is an important supporting factor for investors, especially in an environment of market uncertainty.
Trailing twelve-month dividend yield is 5.77%, above the yield on many debt instruments, supporting investment appeal.
Localiza's trailing twelve-month dividend yield is 5.77%. This is a fairly high level, exceeding the yield on many debt instruments, and makes the shares attractive to income-oriented investors.
The company has not disclosed the specific dividend for FY 2026, but based on historical data and current profit, we assume payouts will remain at a level providing a yield of around 5–6%. Our estimate is based on the assumption of a stable payout ratio, but it may be adjusted depending on profit and company policy.
A dividend cut is possible if profit deteriorates or capital expenditures increase. However, the current low leverage and stable cash flow make such a scenario unlikely in the short term.
According to the portal's model, upside to fair value is estimated at +26%, which, combined with low leverage and dividend yield, makes the shares rather attractive.
According to the portal's model, the fair value of Localiza shares implies an upside of +26% from the current price. This is our own calculation, based on EBITDA growth and a target multiple, and it is not a market consensus or a target price.
Current multiples: P/E LTM – 11.64, EV/EBITDA LTM – 2.68. We do not have data on the company's own three-year average multiples, so we cannot say whether current levels are above or below its historical norms. However, the absolute values appear low, which, combined with the portal model's upside, supports a moderately positive view.
The dividend yield of 5.77% and low debt (net debt / EBITDA 0.01) enhance the appeal. The main risks are related to a possible decline in profit and uncertainty regarding dividend policy. If the company maintains current trends, the shares could deliver returns in line with the model's estimate.
Valuation on the latest reported figures
| Metric | Value |
|---|---|
| Market cap | 7.72 bn USD |
| P/E (LTM) | 11.6 |
| EV/EBITDA (LTM) | 2.7 |
| Net debt / EBITDA (LTM) | 0.01 |
| Operating cash flow (LTM) | 0.00 bn |
| ROE | 0.2% |
| Dividend yield (12m) | 5.8% |
Bottom line
Bottom line: Localiza's reported FY 2026 figures look weak due to the base effect, but quarterly dynamics and LTM data indicate a healthy business. Revenue in recent quarters is growing 35–37% year on year, EBITDA and net profit are positive, leverage is minimal (net debt / EBITDA 0.01), and the dividend yield is 5.77%. According to the portal's model, upside is estimated at +26%. The key question for a holder is whether the positive quarterly dynamics will persist and whether margin pressure will lead to lower profit and dividends. The verdict is 'rather attractive'.
Open the company's financial profile RENT →
See also: market overview · valuation map · stock screeners