Archer-Daniels-Midland: profit up 8.6x, but the cash barely followed

On 3 November Archer-Daniels-Midland reported third-quarter 2026 results: revenue of USD 22,335 mn (+9.6% year on year), net profit of USD 821 mn against 108 mn a year earlier, and operating cash flow of just USD 489 mn. Profit rose 8.6x, but very little of it turned into cash, and net debt added 1.1 bn over the quarter. At the current price the share looks rather unattractive: the multiple sits above its own three-year history and cash flow does not confirm the profit jump.
Key takeaways
— Revenue accelerated to +9.6% from +7.2% a quarter earlier, the first meaningful growth in a year
— Profit rose 8.6x, but a 3.7% margin is still thin for this turnover
— Of the 821 mn profit only 489 mn reached operating cash flow, a wide gap
— Net debt rose over the quarter from 8.3 to 9.4 bn dollars, with the ratio at 2.89
— A 2.9% dividend yield is below what a risk-free instrument offers
— EV/EBITDA of 13.0 is 17% above its own three-year average of 11.1
— The portal model implies minus 36% to fair value, i.e. downside
Attractiveness
Key figures, USD bn
| Metric | Q3 2025 | Q3 2026 | Change |
|---|---|---|---|
| Revenue | 20.4 | 22.3 | +9.6% |
| EBITDA | 0.44 | — | — |
| Operating profit | 0.15 | — | — |
| Net profit | 0.11 | 0.82 | +660.2% |
| Operating cash flow | 1.81 | 0.49 | -73.0% |
| Capex | 0.30 | 0.31 | +3.7% |
| EBITDA margin | 2.2% | — | — |
| Net margin | 0.5% | 3.7% | +3.2 pp |
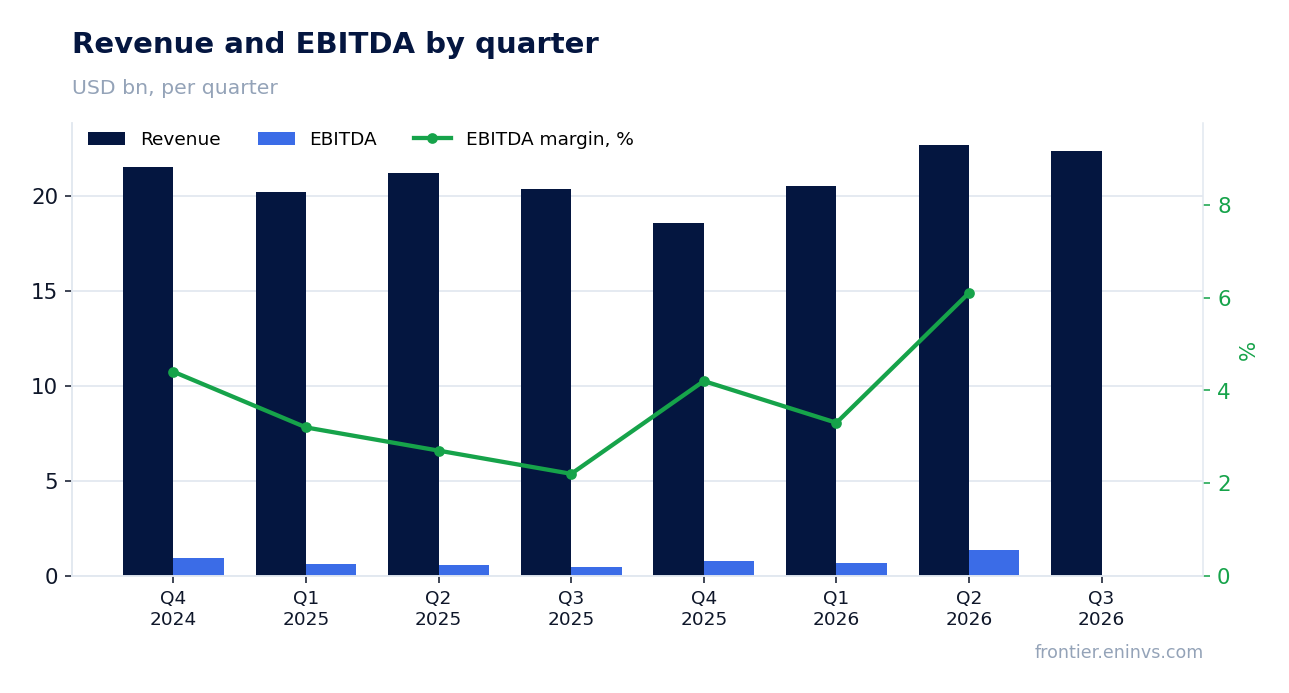
Revenue accelerated to +9.6% from +7.2% a quarter earlier, the first meaningful growth in a year
In the third quarter of 2026 revenue was USD 22,335 mn, 9.6% more than a year earlier. A quarter earlier growth was 7.2%, so the dynamic accelerated. For a company that showed a 13.7% decline at the end of 2025, this is a reversal.
The growth rests on a low base: in the third quarter of 2025 revenue was 20,372 mn and profit only 108 mn. Turnover is now back to the level of early 2026, when the first quarter brought 20,490 mn. The acceleration so far rests on recovering volumes and prices, not on new capacity.
What exactly pulled revenue up is not visible from the available data. What matters is that growth has accelerated for a second quarter in a row, the first sustained signal since the end of 2025.
Profit rose 8.6x, but a 3.7% margin is still thin for this turnover
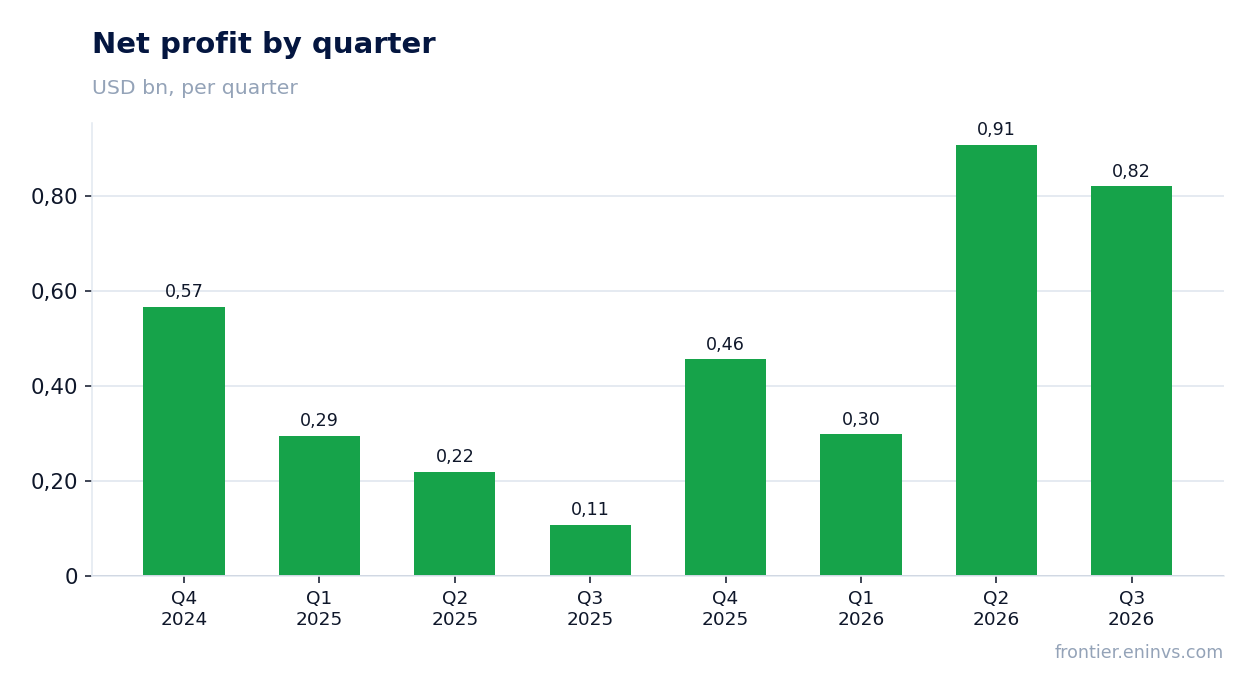
Net profit in the third quarter of 2026 was USD 821 mn against 108 mn a year earlier, 8.6x growth. The net margin rose to 3.7% from 0.5% a year earlier. The jump is explained by the low base of last year, when the margin was almost zero.
On turnover of 22,335 mn a 3.7% margin yields 821 mn, still a thin result for a processor. A quarter earlier profit was 908 mn on revenue of 22,681 mn, so the absolute result even slipped slightly. The durability of the new margin is not yet confirmed.
One-off items in profit are not identified in the available data. But the comparison with the previous quarter shows profit swings with the cycle rather than growing linearly.
Of the 821 mn profit only 489 mn reached operating cash flow, a wide gap
Operating cash flow in the third quarter of 2026 was USD 489 mn against net profit of 821 mn. Less than half of what was earned turned into cash. Capital expenditure in the same quarter was 307 mn, so free cash flow after investment is very small.
For comparison: in the second quarter of 2026 operating cash flow was 1,149 mn against profit of 908 mn, i.e. it exceeded profit. In the third quarter the relationship flipped. Over the last twelve months operating cash flow was 1,475 mn against net profit of 2,483 mn, a gap that accumulates on an annual basis.
The reason for the gap is not disclosed in the available data. But the fact matters: profit growth is not yet backed by cash, and it is cash flow that funds dividends and debt reduction.
Net debt rose over the quarter from 8.3 to 9.4 bn dollars, with the ratio at 2.89
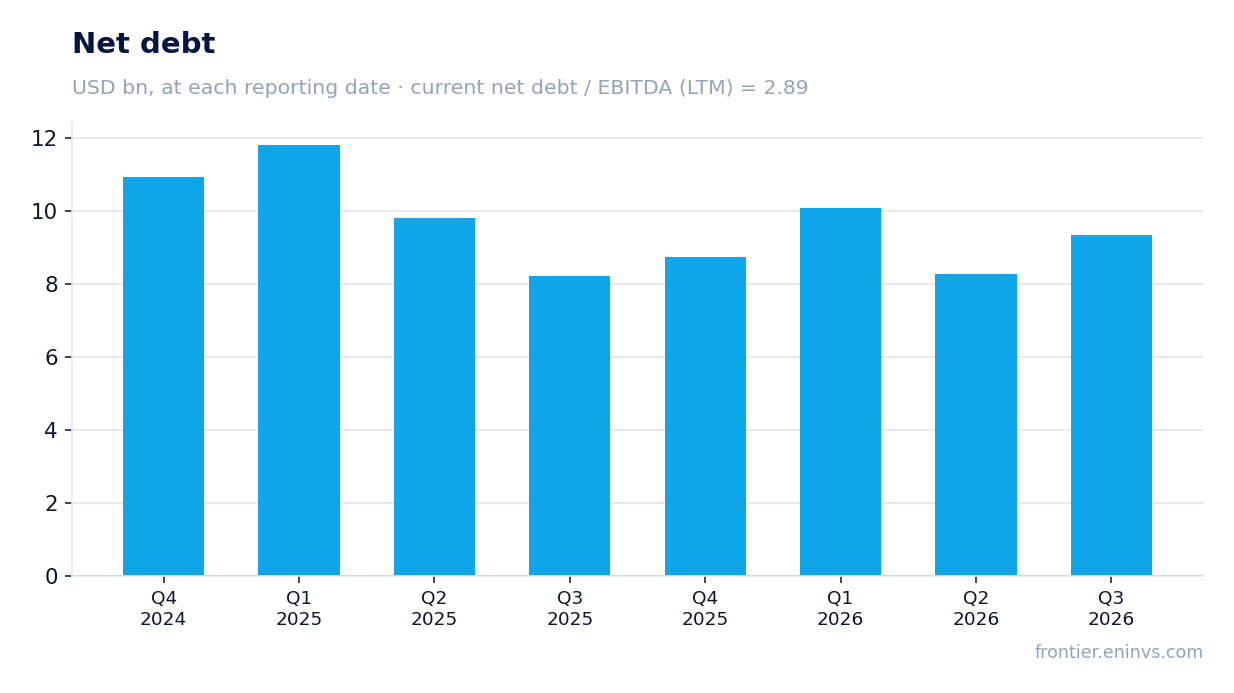
Net debt at 30 September 2026 was USD 9,358 mn against 8,289 mn at 30 June 2026, up 1.1 bn over the quarter. Over the year debt also added 1.1 bn: at 30 September 2025 it was 8,230 mn. Rising debt against weak operating cash flow is the main risk in the report.
The ratio of net debt to trailing-twelve-month EBITDA is 2.89. That is a level that still allows dividends and investment, but the cushion is thin. With EBITDA of 3,237 mn over twelve months, debt of 9.4 bn is material.
Interest and the repayment schedule are not disclosed in the available data. But the combination of rising debt and weak cash flow means the next large investment or buyback will require new financing.
A 2.9% dividend yield is below what a risk-free instrument offers
The trailing-twelve-month dividend yield is 2.93%. On a market capitalisation of 33,341 mn that is about 977 mn of payouts a year. For a company with trailing-twelve-month net profit of 2,483 mn this is a moderate burden, but operating cash flow over the same period was only 1,475 mn, and dividends absorb a noticeable part of it.
Our estimate for the current year's dividend is about 2.2 dollars per share, which gives the same 2.9% on the current price. The calculation rests on trailing-twelve-month profit and the established payout ratio; it is sensitive to whether the 3.7% margin holds and whether capex rises above 307 mn a quarter.
A 2.9% yield is below what a dollar risk-free instrument offers, and it does not compensate for processor risk. A weaker payout could come from weak operating cash flow: if it stays at 489 mn a quarter, dividends will be funded with debt.
EV/EBITDA of 13.0 is 17% above its own three-year average of 11.1
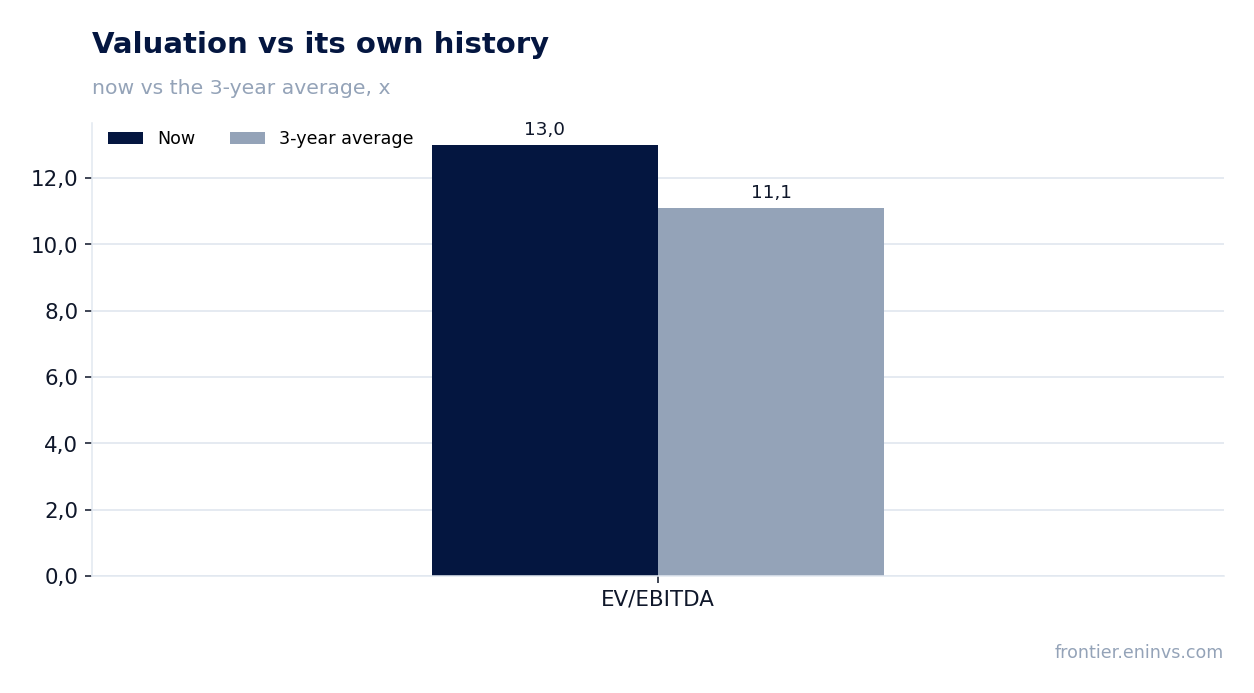
Trailing-twelve-month EV/EBITDA is 13.0 against its own three-year average of 11.1. The share trades 17% above its history. Trailing P/E is 13.4, which for a processor with a 3.7% margin does not look cheap.
The market has already priced in a profit recovery: profit rose 8.6x and the multiple reflects it. But if the margin returns to last year's levels, the current valuation will prove stretched. On the portal's model fair value implies minus 36% to the current price, our own estimate at current commodity prices.
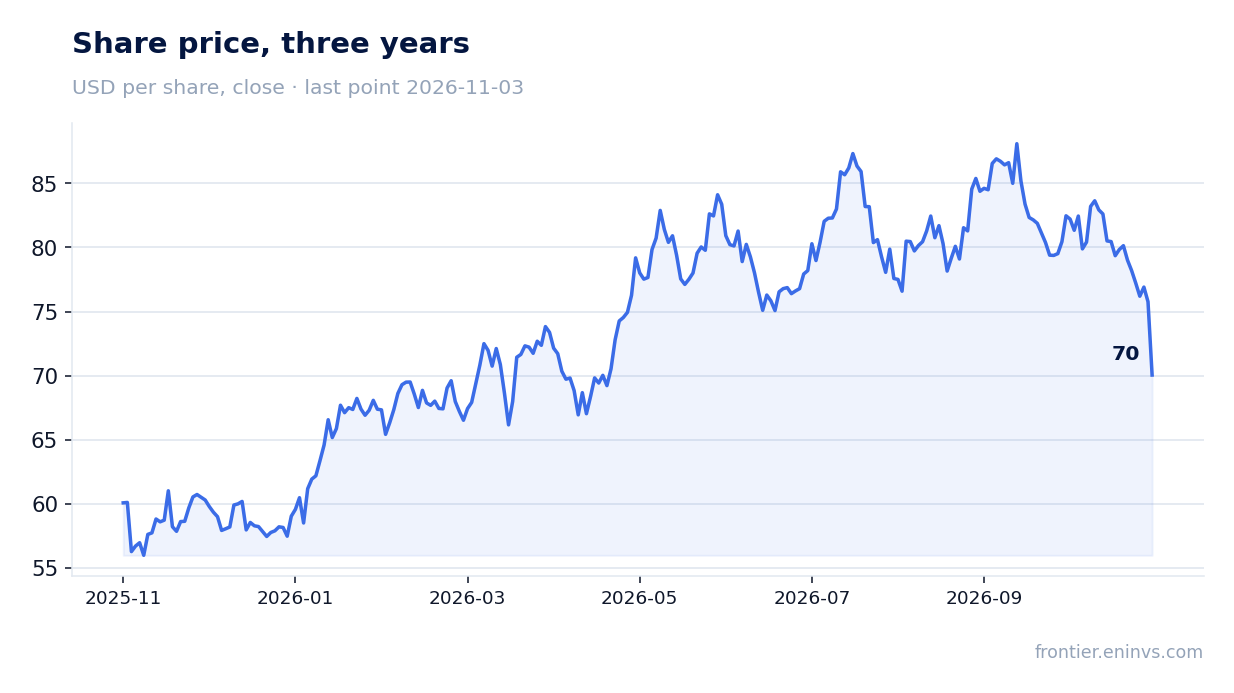
The market reaction confirms the caution: on the release day the share fell 7.5%, and from then to 3 November by another 7.5%. Investors did not buy the durability of the profit.
The portal model implies minus 36% to fair value, i.e. downside
On the portal's model, which re-prices EBITDA at current commodity prices and the target EV/EBITDA, fair value is 36% below the current price. This is our own estimate, not a market consensus and not a target price.
The calculation rests on trailing-twelve-month EBITDA of 3,237 mn and current debt of 9,358 mn. If commodity prices recover, the model will re-price upward, but at current conditions the downside is significant.
For a holder this means the current price already discounts an optimistic scenario. Only sustained operating cash flow above 1 bn a quarter, as in the second quarter of 2026, can confirm it.
Valuation on the latest reported figures
| Metric | Value |
|---|---|
| Market cap | 33.3 bn USD |
| P/E (LTM) | 13.4 |
| EV/EBITDA (LTM) | 13.0 |
| P/B | 1.47 |
| Net debt / EBITDA (LTM) | 2.89 |
| Operating cash flow (LTM) | 1.48 bn |
| ROE | 13.8% |
| Dividend yield (12m) | 2.9% |
| EV/EBITDA, 3-year average | 11.1 |
Bottom line
What was strong in the report was the acceleration of revenue to +9.6% and profit growth of 8.6x: the company turned around after a 13.7% decline at the end of 2025. But profit grew from an almost zero base and only partly turned into cash: operating cash flow of 489 mn against profit of 821 mn. Debt added 1.1 bn over the quarter, the 2.9% dividend yield is modest, and the multiple is above its own history. The verdict is rather unattractive: profit growth is not confirmed by cash flow, and the price already discounts an optimistic scenario.
Open the company's financial profile ADM →
See also: market overview · valuation map · stock screeners