Acadian Timber: profit up a quarter, but 7.1x EBITDA leverage and a multiple above its own history
On 30 September Acadian Timber released its third-quarter 2026 results. Revenue came in at USD 17.1m, EBITDA at USD 5.526m, net profit at USD 3.121m and operating cash flow at USD 2.239m. Profit rose by a quarter year on year, but leverage of 7.13x EBITDA and an EV/EBITDA of 28.2 against its own three-year average of 21.6 make the share rather unattractive at the current price.
Key takeaways
— Net profit rose by a quarter year on year to USD 3.121m on revenue of USD 17.1m
— EBITDA margin of 32.3% and net margin of 18.3% – profitability holds but does not grow
— Leverage of 7.13x EBITDA is the main constraint on the dividend and the valuation
— Operating cash flow of USD 2.239m covers only part of the interest burden
— A 6.8% dividend yield is attractive, but the payout is constrained by debt
— EV/EBITDA of 28.2 against its own three-year average of 21.6 – the share is more expensive than its history
Attractiveness
Key figures, USD bn
| Metric | — | Q3 2026 | Change |
|---|---|---|---|
| Revenue | — | 0.02 | — |
| EBITDA | — | 0.01 | — |
| Operating profit | — | 0.00 | — |
| Net profit | — | 0.00 | — |
| Operating cash flow | — | 0.00 | — |
| EBITDA margin | — | 32.3% | — |
| Net margin | — | 18.3% | — |
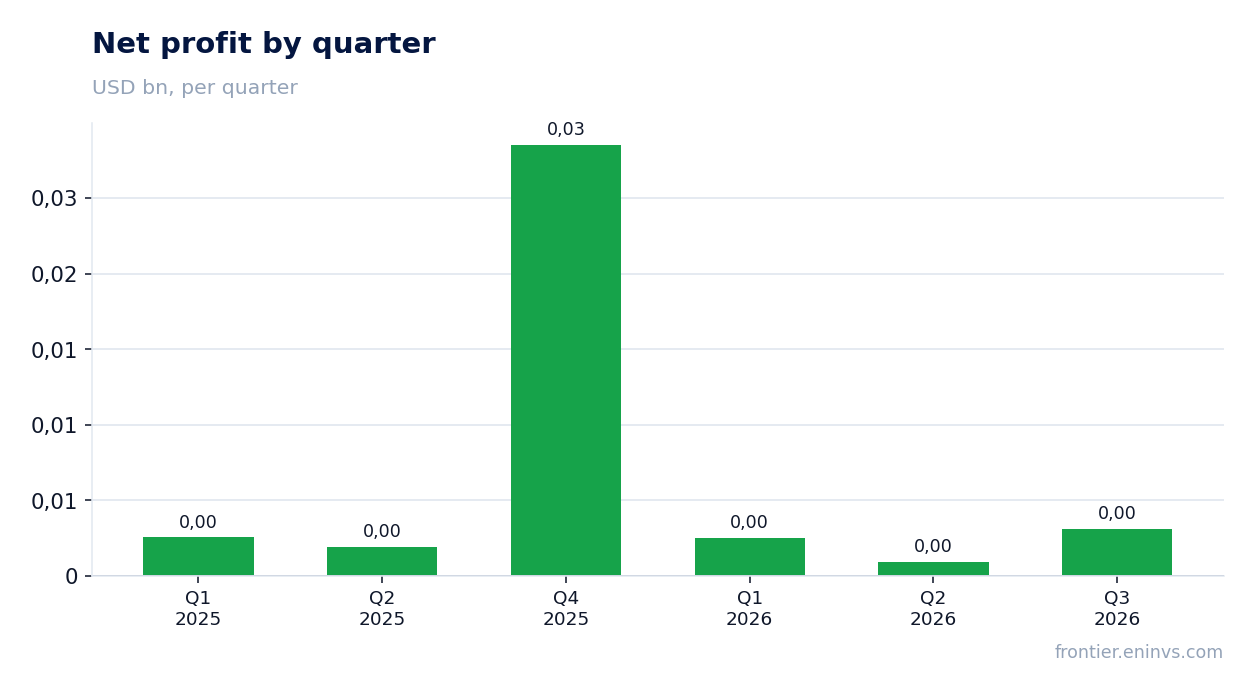
Net profit rose by a quarter year on year to USD 3.121m on revenue of USD 17.1m
Revenue for the third quarter of 2026 was USD 17.1m, net profit – USD 3.121m. Profit rose by a quarter year on year, roughly USD 0.6m above the same quarter a year earlier.
Operating profit was USD 2.674m, meaning net profit exceeded operating profit. That implies one-off or non-operating items supported the bottom line.
Revenue stayed flat year on year, so the profit growth came from the cost structure and non-operating income rather than from sales.
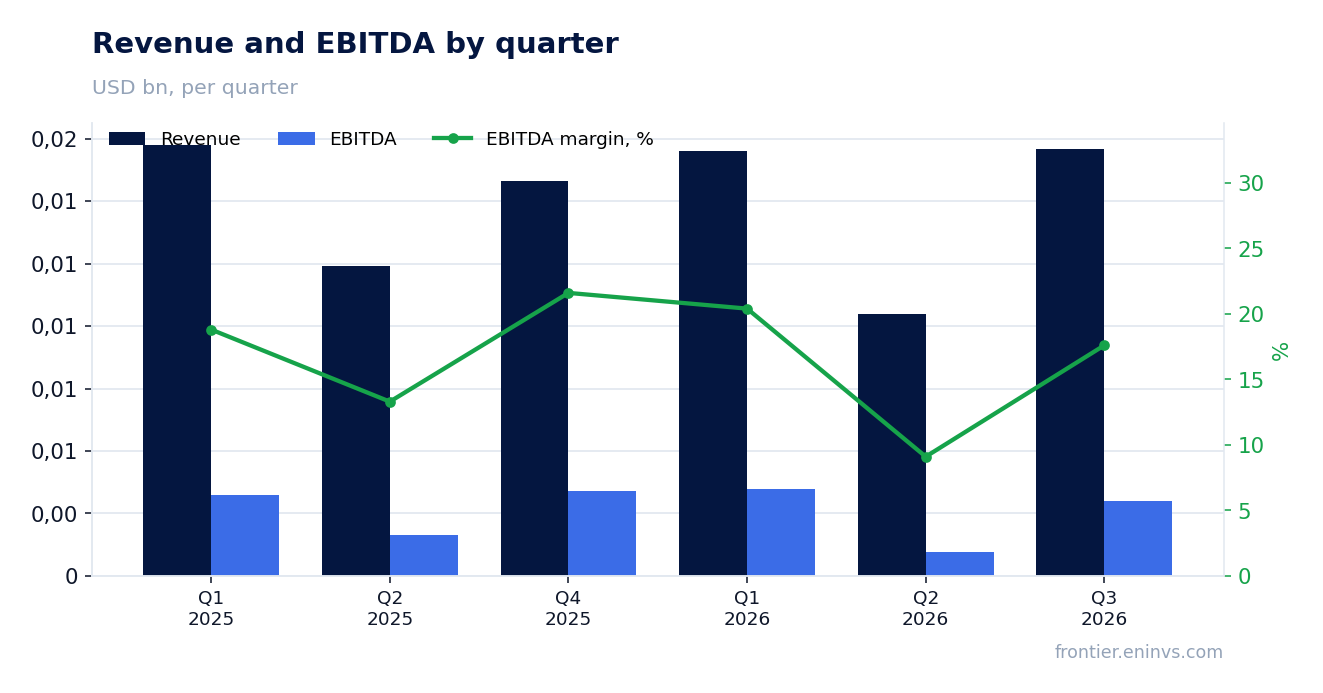
EBITDA margin of 32.3% and net margin of 18.3% – profitability holds but does not grow
EBITDA for the quarter was USD 5.526m on revenue of USD 17.1m, a margin of 32.3%. Net margin was 18.3%.
For a forestry asset this is a decent level, but it is not growing: revenue is stagnant and costs are not falling enough to expand the margin.
The margin is held up by lumber prices and shipment volumes rather than by internal efficiency. Without revenue growth the margin will stay in this range.
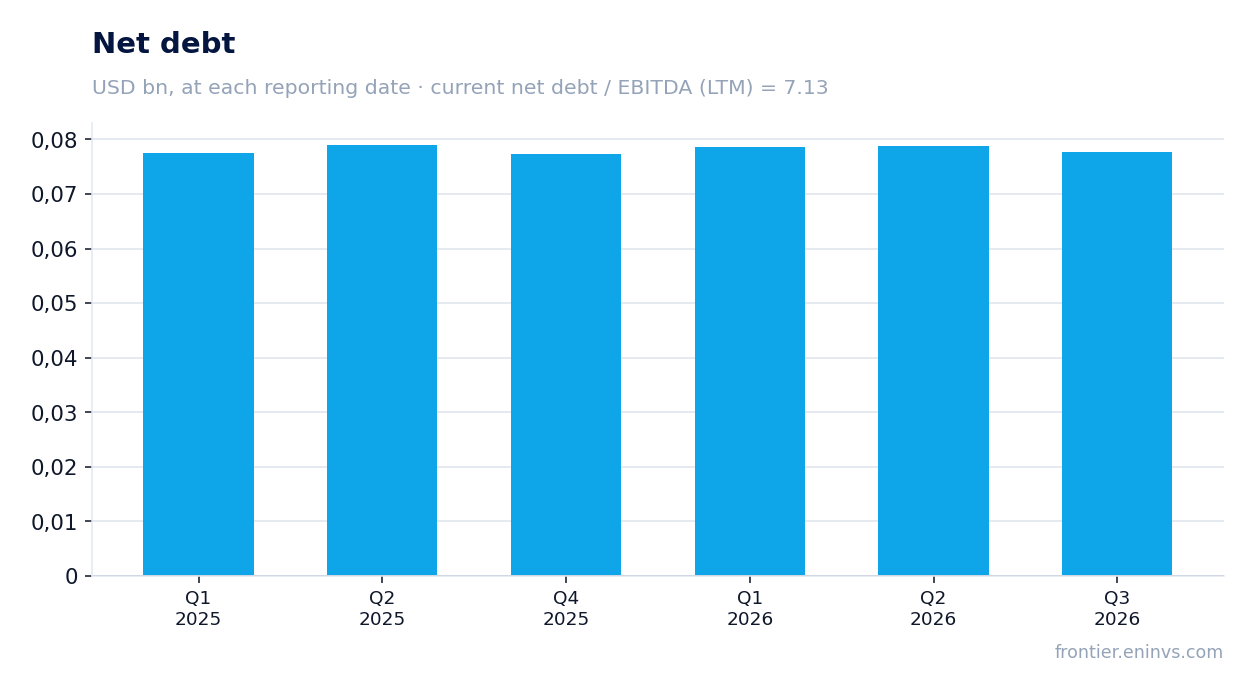
Leverage of 7.13x EBITDA is the main constraint on the dividend and the valuation
Net debt at 30 September 2026 was USD 77.764m, or USD 0.1bn. The ratio of net debt to trailing-twelve-month EBITDA is 7.13.
That is a high level for a company with trailing-twelve-month revenue of USD 62.2m. Debt service absorbs a significant part of operating cash flow.
Since 30 June 2026 net debt has barely changed – from USD 0.1bn to USD 0.1bn. Over twelve months the change is also zero, meaning the company is not reducing debt.
Operating cash flow of USD 2.239m covers only part of the interest burden
Operating cash flow for the third quarter of 2026 was USD 2.239m. That is less than EBITDA of USD 5.526m, meaning part of EBITDA goes to working capital and taxes.
With debt of USD 77.764m and trailing-twelve-month EBITDA of USD 10.9m, the interest burden remains significant. Operating cash flow of USD 2.239m does not fully cover it.
The company did not disclose capital expenditure for the quarter, so free cash flow cannot be assessed. But with such debt, even a small rise in rates could make debt service problematic.
A 6.8% dividend yield is attractive, but the payout is constrained by debt
The trailing-twelve-month dividend yield is 6.8%. That is above the yield on most debt instruments, but the payout is funded from profit, which over the last twelve months was USD 35.0m.
However, trailing-twelve-month profit includes one-off items, including a quarter with profit of USD 28.54m. Without them the dividend base is smaller.
With leverage of 7.13x EBITDA the company can maintain the payout, but growth in it is unlikely. A cut is possible if lumber prices fall or interest rates rise.
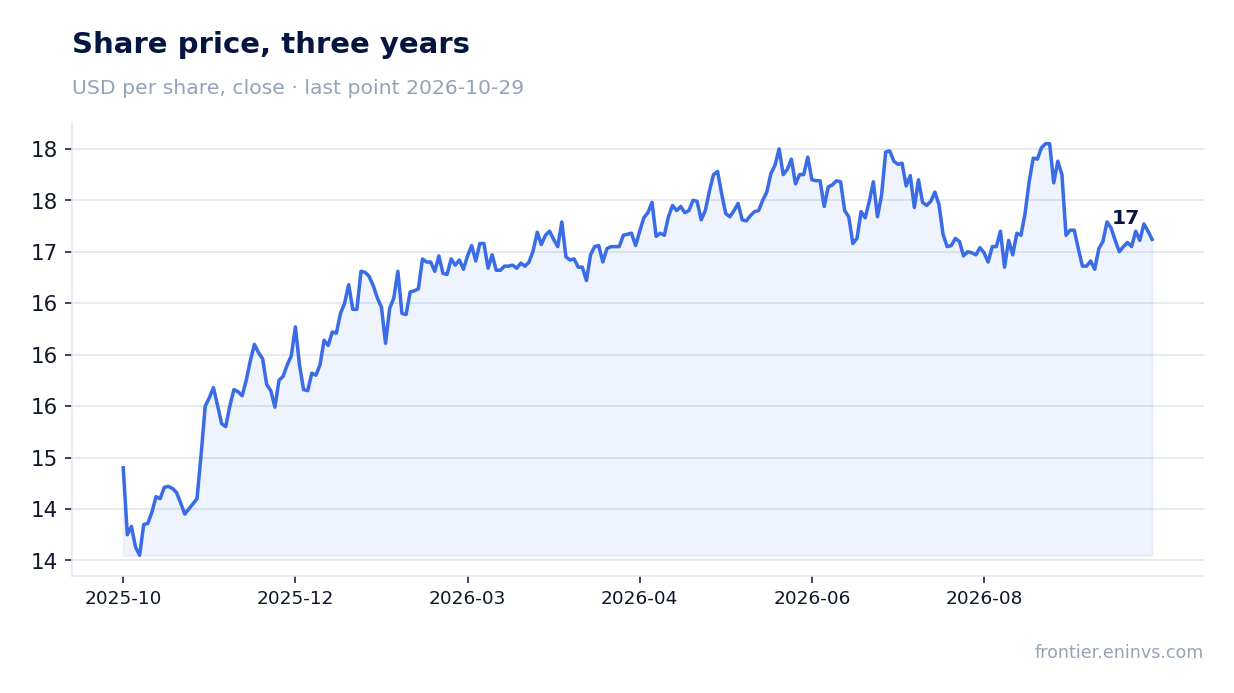
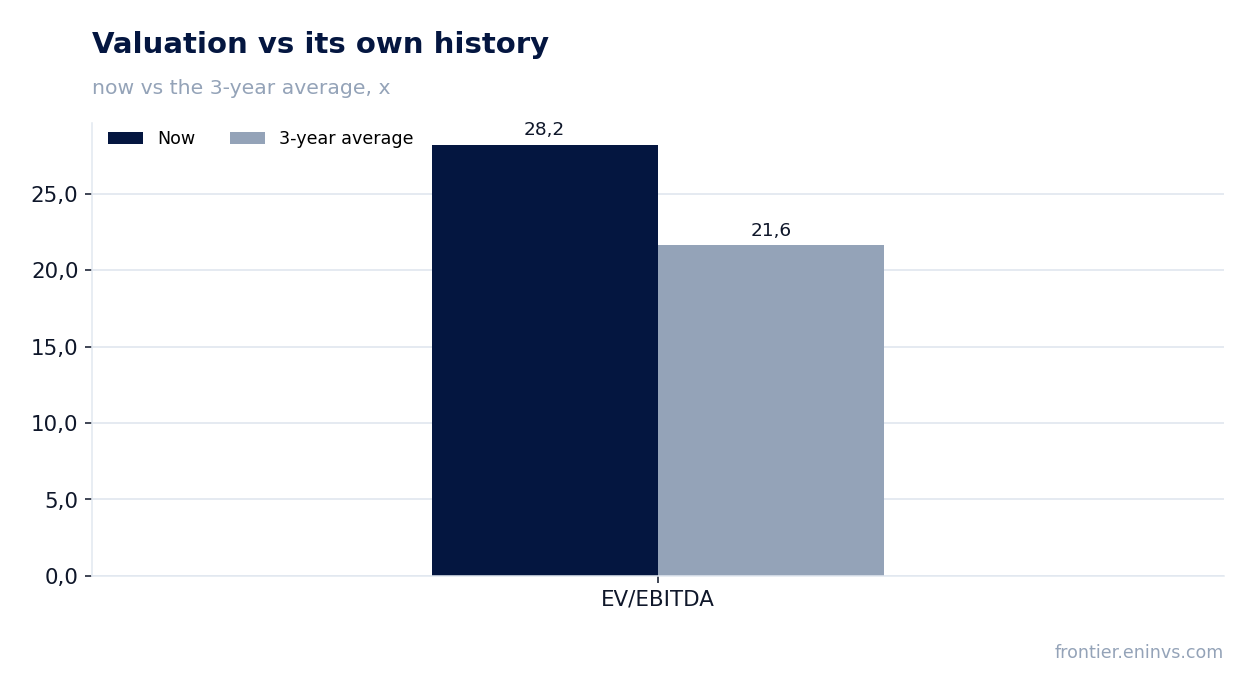
EV/EBITDA of 28.2 against its own three-year average of 21.6 – the share is more expensive than its history
Trailing-twelve-month EV/EBITDA is 28.2, 31% above its own three-year average of 21.6. The share trades more expensively than usual.
Trailing-twelve-month P/E is 6.5, which is lower, but that is a consequence of the one-off profit of USD 28.54m in the fourth quarter of 2025. Without it P/E would be significantly higher.
Market capitalisation is USD 228.8m. With EV/EBITDA above its historical average and leverage of 7.13x EBITDA, the valuation looks stretched.
Valuation on the latest reported figures
| Metric | Value |
|---|---|
| Market cap | 0.23 bn USD |
| P/E (LTM) | 6.5 |
| EV/EBITDA (LTM) | 28.2 |
| P/B | 0.87 |
| Net debt / EBITDA (LTM) | 7.13 |
| ROE | 4.9% |
| Dividend yield (12m) | 6.8% |
| EV/EBITDA, 3-year average | 21.6 |
Bottom line
The strong point of the report was net profit of USD 3.121m, up a quarter year on year, and an EBITDA margin of 32.3%. But the profit growth came from non-operating items rather than revenue, which stayed at USD 17.1m. Leverage of 7.13x EBITDA and operating cash flow of USD 2.239m constrain the dividend, while EV/EBITDA of 28.2 against its own three-year average of 21.6 makes the share expensive. The verdict is rather unattractive: a 6.8% dividend yield does not compensate for the debt burden and the valuation above its history.
Open the company's financial profile ADN →
See also: market overview · valuation map · stock screeners