Agnico Eagle Mines: Q2 2026 revenue up 35%, but growth rate halved

On August 25, Agnico Eagle Mines reported results for Q2 2026. Revenue grew 35.0% YoY, EBITDA 46.4%, net profit 49.8%. The shares look attractive: EV/EBITDA is below its own three-year average, the company generates strong cash flow and has negative net debt.
Key takeaways
— Q2 2026 revenue grew 35.0% YoY, but growth slowed from 66.1% in the previous quarter
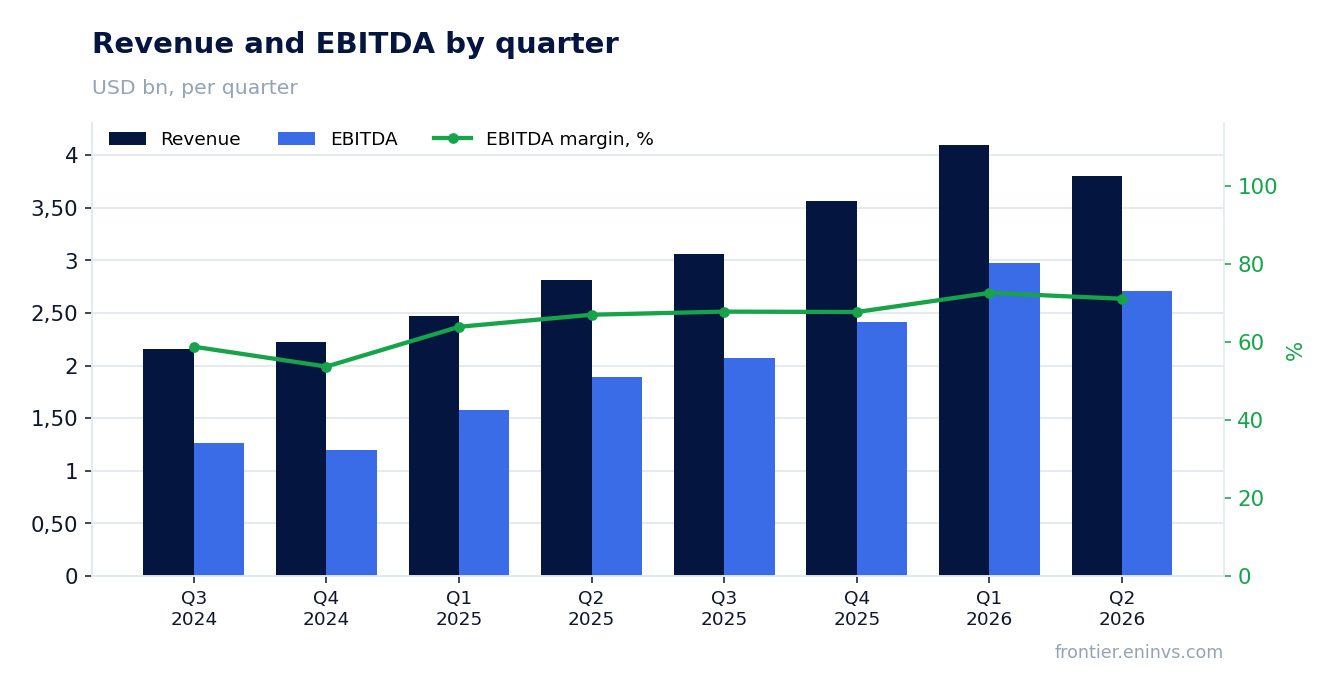
— EBITDA margin reached 72.6% in Q2 2026, up from 67.0% a year earlier
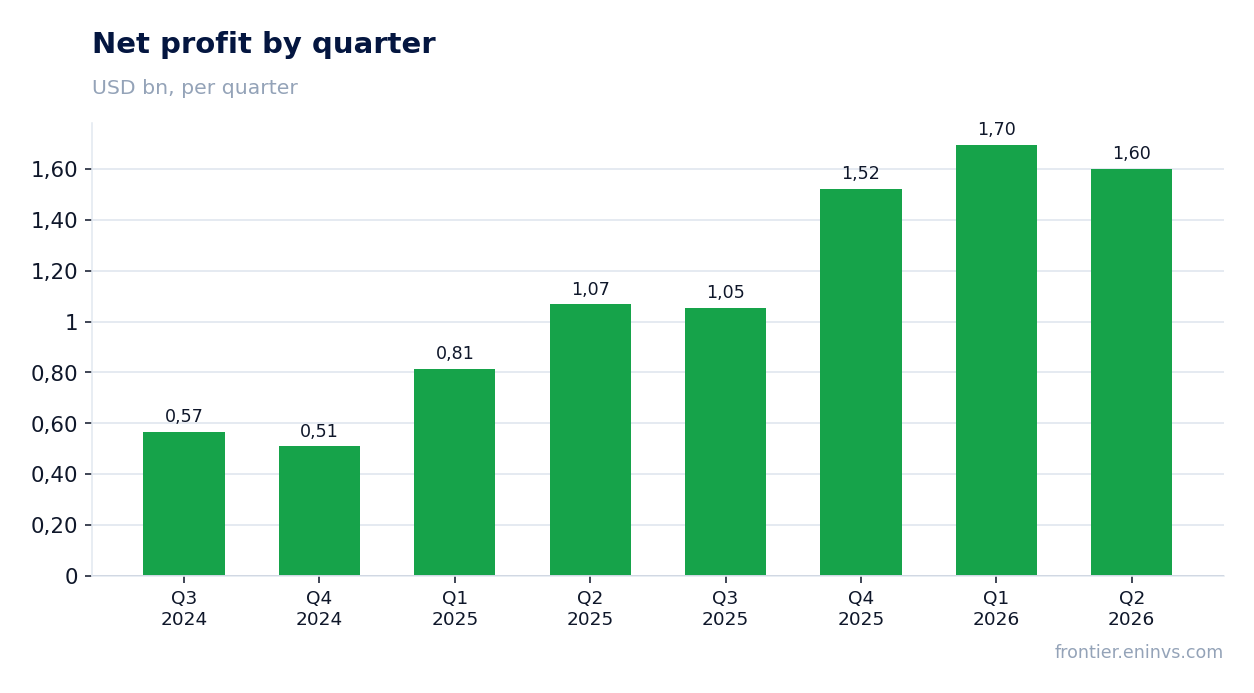
— Net profit for the quarter rose 49.8% YoY to $1,600.5 million
— Operating cash flow in Q2 2026 was $2,144.1 million, almost double capital expenditures
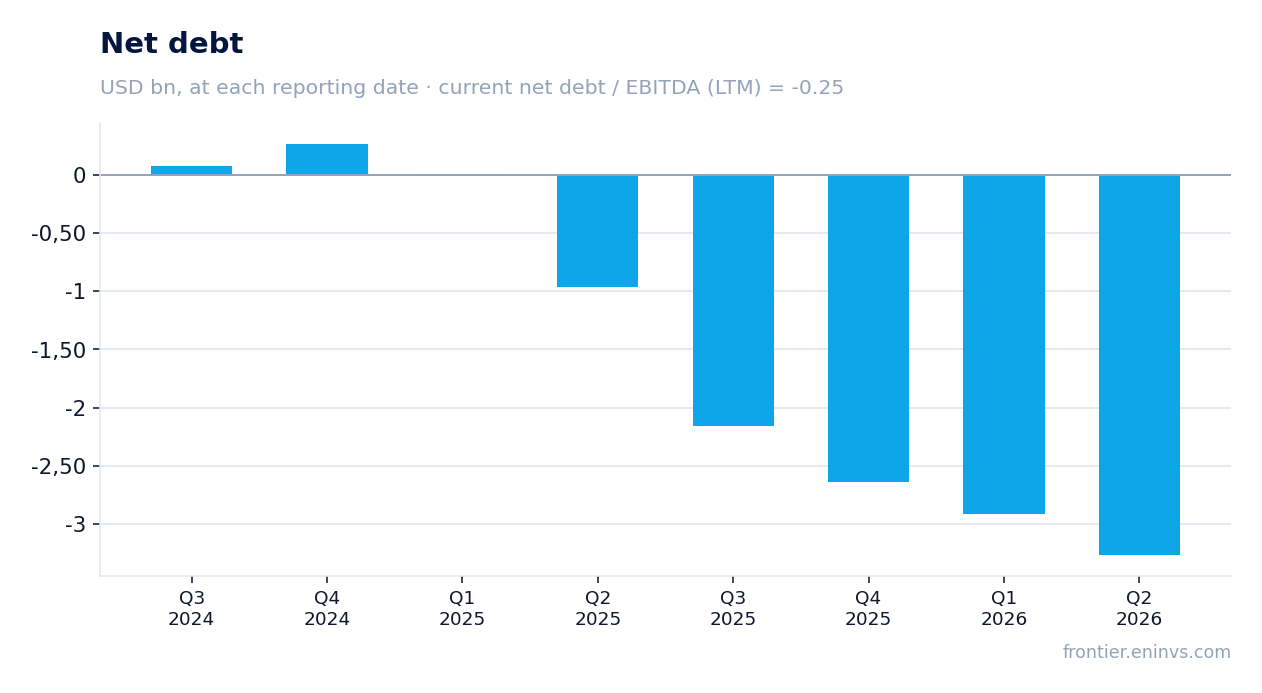
— Net debt is negative: minus $3,267.1 million at quarter-end
— Trailing twelve-month dividend yield is 0.86%, below historical average
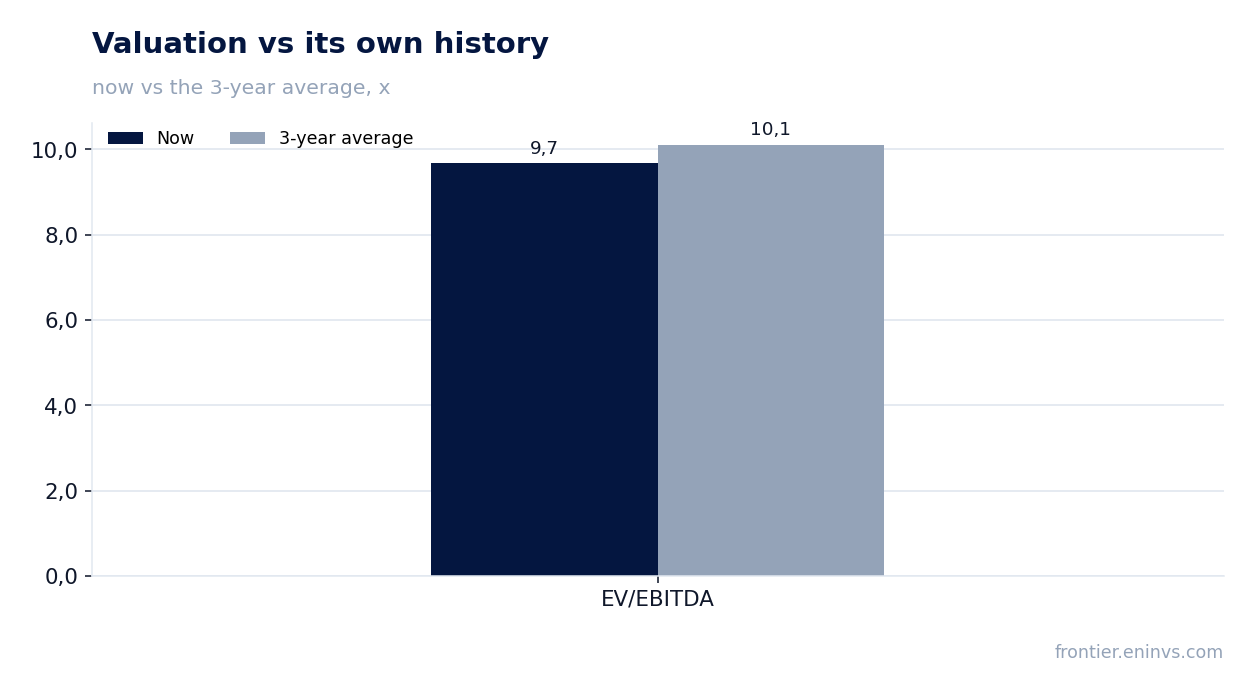
— LTM EV/EBITDA is 9.68, below the three-year average of 10.11
Attractiveness
Key figures, USD bn
| Metric | Q2 2025 | Q2 2026 | Change |
|---|---|---|---|
| Revenue | 2.82 | 3.80 | +35.0% |
| EBITDA | 1.89 | 2.76 | +46.4% |
| Operating profit | 1.51 | 2.28 | +51.1% |
| Net profit | 1.07 | 1.60 | +49.8% |
| Operating cash flow | 1.85 | 2.14 | +16.2% |
| Capex | 0.54 | 0.82 | +50.9% |
| EBITDA margin | 67.0% | 72.6% | +5.6 pp |
| Net margin | 38.0% | 42.1% | +4.1 pp |
Q2 2026 revenue grew 35.0% YoY, but growth slowed from 66.1% in the previous quarter
In Q2 2026, Agnico Eagle Mines' revenue reached $3,802.8 million, up 35.0% YoY. However, in Q1 2026 growth was 66.1%, meaning the pace nearly halved. This may reflect both a high base from the prior year and normalization of gold prices.
Quarterly dynamics show acceleration in 2025: from 34.9% in Q1 to 60.3% in Q4. In 2026, growth remains high but not as rapid. Nevertheless, trailing twelve-month revenue reached $14,500.0 million.
EBITDA margin reached 72.6% in Q2 2026, up from 67.0% a year earlier
EBITDA in Q2 2026 reached $2,705.2 million, up 46.4% YoY. Margin increased from 67.0% to 72.6%. The improvement is tied to higher gold prices and cost control.
Operating profit for the quarter reached $2,281.9 million, implying an operating margin of about 60%. Trailing twelve-month EBITDA was $10,244.8 million.
Net profit for the quarter rose 49.8% YoY to $1,600.5 million
Net profit in Q2 2026 was $1,600.5 million, up 49.8% YoY. Net margin increased from 38.0% to 42.1%. Profit growth outpaced revenue growth thanks to operating leverage.
Trailing twelve-month net profit reached $5,873.9 million, resulting in return on equity of 23.3%.
Operating cash flow in Q2 2026 was $2,144.1 million, almost double capital expenditures
In Q2 2026, operating cash flow was $2,144.1 million, while capital expenditures were $815.6 million. Free cash flow exceeds $1.3 billion for the quarter, allowing to fund dividends and reduce debt.
Trailing twelve-month operating cash flow reached $6,800.0 million, well above capital expenditures. This provides a solid base for shareholder distributions.
Net debt is negative: minus $3,267.1 million at quarter-end
At the end of Q2 2026, net debt was minus $3,267.1 million, meaning the company has a net cash position. Over the last 12 months, net debt improved by $2.9 billion.
Net debt to EBITDA for the trailing twelve months is minus 0.25. This indicates the company is financially independent and can fund investments from its own resources.
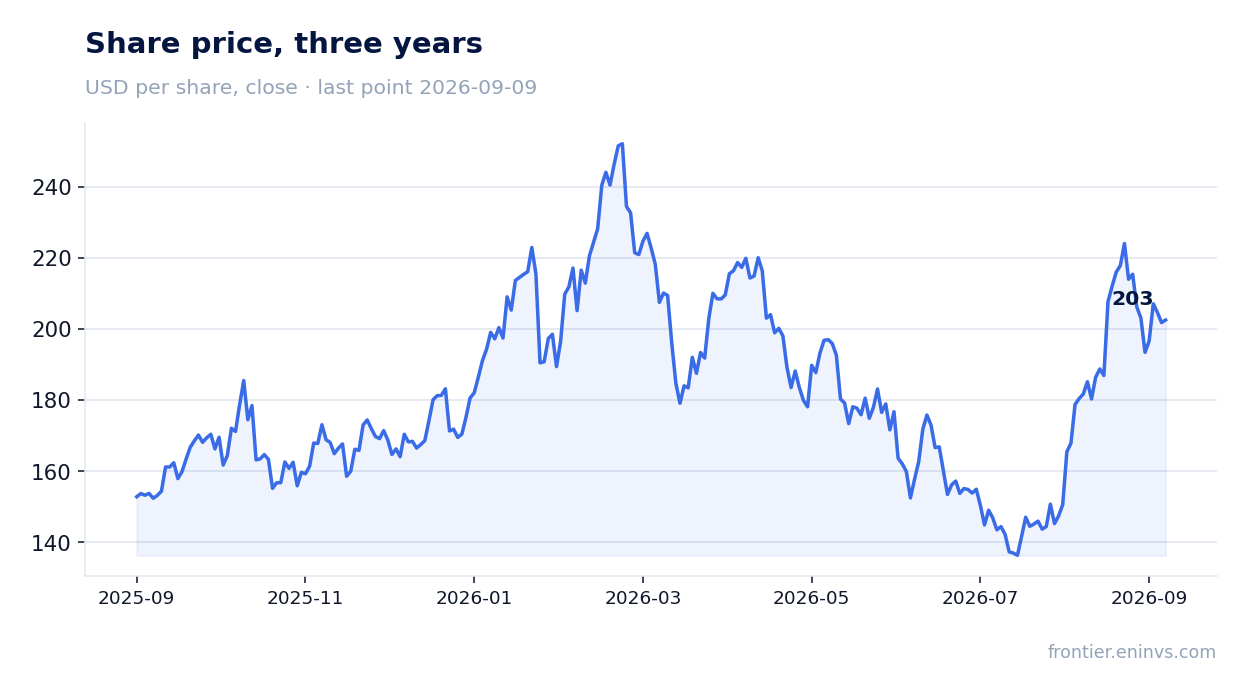
Trailing twelve-month dividend yield is 0.86%, below historical average
Over the last 12 months, Agnico Eagle Mines paid dividends of 0.86% of the current share price. This is below the average yield over the past three years, reflecting rising share prices. The company continues to pay dividends, but the yield is low.
With a current market cap of $101,688.7 million and LTM net profit of $5,873.9 million, the payout ratio appears moderate. However, the exact dividend for the current year will depend on the board's decision and gold prices.
LTM EV/EBITDA is 9.68, below the three-year average of 10.11
The current EV/EBITDA multiple is 9.68 based on trailing twelve-month data. This is below its own three-year average of 10.11. P/E LTM is 17.31, which also appears moderate for a company with growing earnings.
According to the portal's model, the fair value of the share, given current gold prices and target EV/EBITDA, is only 1% above the market price. This suggests the shares are fairly valued, with limited upside.
Valuation on the latest reported figures
| Metric | Value |
|---|---|
| Market cap | 102 bn USD |
| P/E (LTM) | 17.3 |
| EV/EBITDA (LTM) | 9.7 |
| P/B | 4.11 |
| Net debt / EBITDA (LTM) | -0.25 |
| Operating cash flow (LTM) | 6.80 bn |
| ROE | 23.3% |
| Dividend yield (12m) | 0.9% |
| EV/EBITDA, 3-year average | 10.1 |
Bottom line
Agnico Eagle Mines delivered a strong quarter: revenue and profit grew by double digits, margins expanded, and cash flow supports investments and dividends. However, growth slowed, and valuation is close to fair per the portal model. Shares trade below their own three-year average EV/EBITDA, providing some support. Verdict – attractive, but upside is limited.
Open the company's financial profile AEM →
See also: market overview · valuation map · stock screeners