Agnico Eagle Mines: revenue growth slowed to 17.1%, but margin and cash flow remain strong
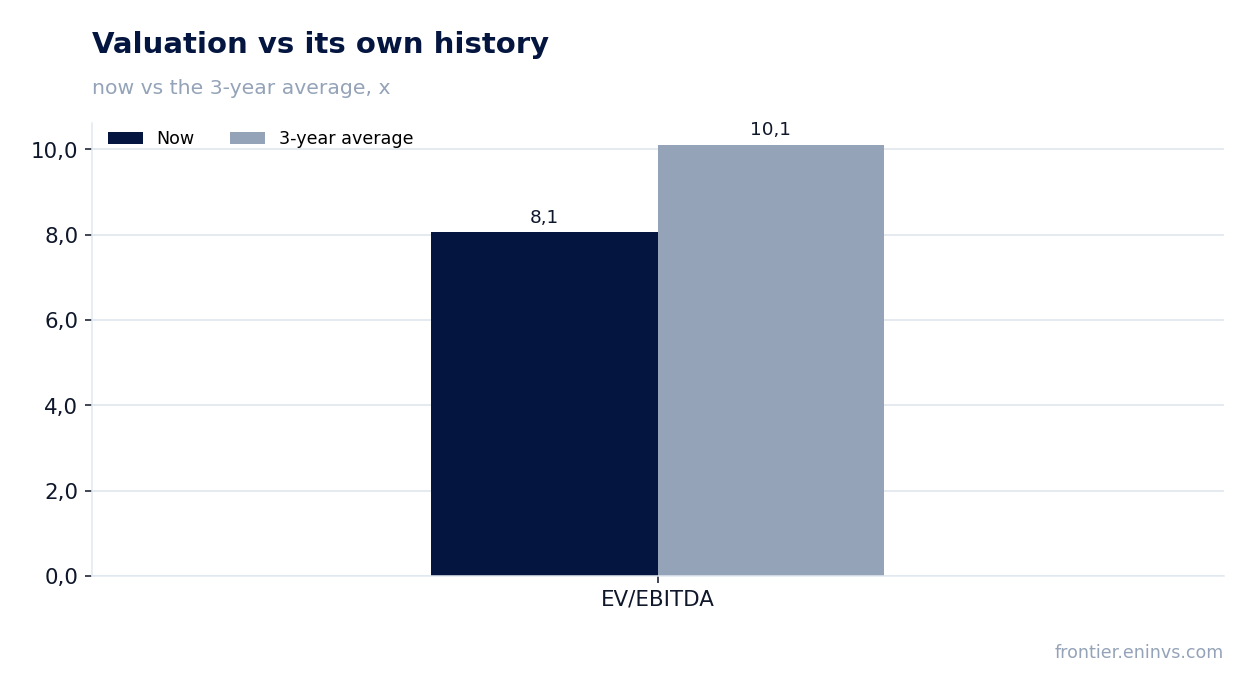
On 29 October, Agnico Eagle Mines reported results for the third quarter of 2026. Revenue rose 17.1% year on year to USD 3,583.6 mn, EBITDA – by 20.4% to USD 2,449.8 mn, net profit – by 28.2% to USD 1,352.9 mn. Revenue growth decelerated from 35.0% in the second quarter, but the EBITDA margin rose to 68.2%, and net debt remains negative (–USD 3.4 bn). At an EV/EBITDA of 8.1 versus its own three-year average of 10.1, the share looks cheaper than its history, which makes it attractive if current market conditions persist.
Key takeaways
— Revenue grew 17.1% year on year, but that is markedly slower than 35.0% in the second quarter
— EBITDA added 20.4%, and its margin rose to 68.2% from 66.3% a year earlier
— Net profit grew 28.2%, and its margin reached 37.8% versus 34.5% a year earlier
— Free cash flow remains solid: operating cash flow of USD 1,755.0 mn against capital expenditures of USD 908.2 mn
— Net debt is negative at USD 3.4 bn, giving a net debt/EBITDA ratio of minus 0.32
— The trailing twelve-month dividend yield is 1.0%, modest against strong cash generation
— EV/EBITDA of 8.1 is below its own three-year average of 10.1, meaning the share is cheaper than its history
Attractiveness
Key figures, USD bn
| Metric | Q3 2025 | Q3 2026 | Change |
|---|---|---|---|
| Revenue | 3.06 | 3.58 | +17.1% |
| EBITDA | 2.03 | 2.44 | +20.4% |
| Operating profit | 1.65 | 1.99 | +21.1% |
| Net profit | 1.05 | 1.35 | +28.2% |
| Operating cash flow | 1.82 | 1.76 | -3.4% |
| Capex | 0.63 | -0.91 | -245.0% |
| EBITDA margin | 66.3% | 68.2% | +1.9 pp |
| Net margin | 34.5% | 37.8% | +3.3 pp |
Revenue grew 17.1% year on year, but that is markedly slower than 35.0% in the second quarter
In the third quarter of 2026, Agnico Eagle Mines' revenue amounted to USD 3,583.6 mn, up 17.1% year on year. This is a continuation of growth, but the pace has slowed markedly: in the second quarter, revenue was growing at 35.0% year on year. The deceleration is due to the high base effect from last year, when gold prices began their sharp rise.
Gold sales remain the main contributor to revenue, but the specific revenue structure is not disclosed in the facts. One should rely on the fact that the company maintains a high level of production, and the price environment remains favourable. Revenue dynamics in the coming quarters will depend on metal prices and production volumes.
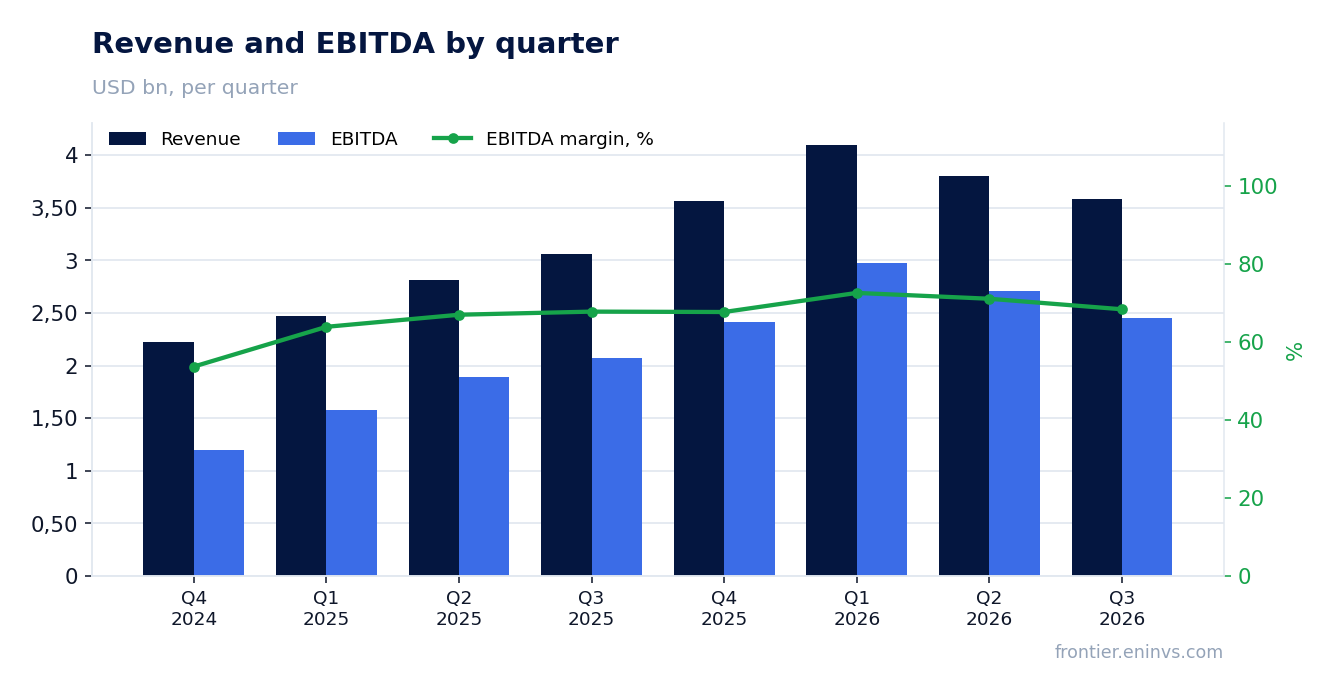
EBITDA added 20.4%, and its margin rose to 68.2% from 66.3% a year earlier
EBITDA in the third quarter of 2026 reached USD 2,449.8 mn, up 20.4% year on year. The EBITDA margin was 68.2% versus 66.3% a year earlier. Margin growth against decelerating revenue suggests the company is controlling costs or benefiting from the price factor.
Operating profit amounted to USD 1,992.3 mn, also above the prior-year level. Maintaining a high margin is important for cash flow generation and dividend support. Amid gold price volatility, margin resilience will be a key factor in the share's valuation.
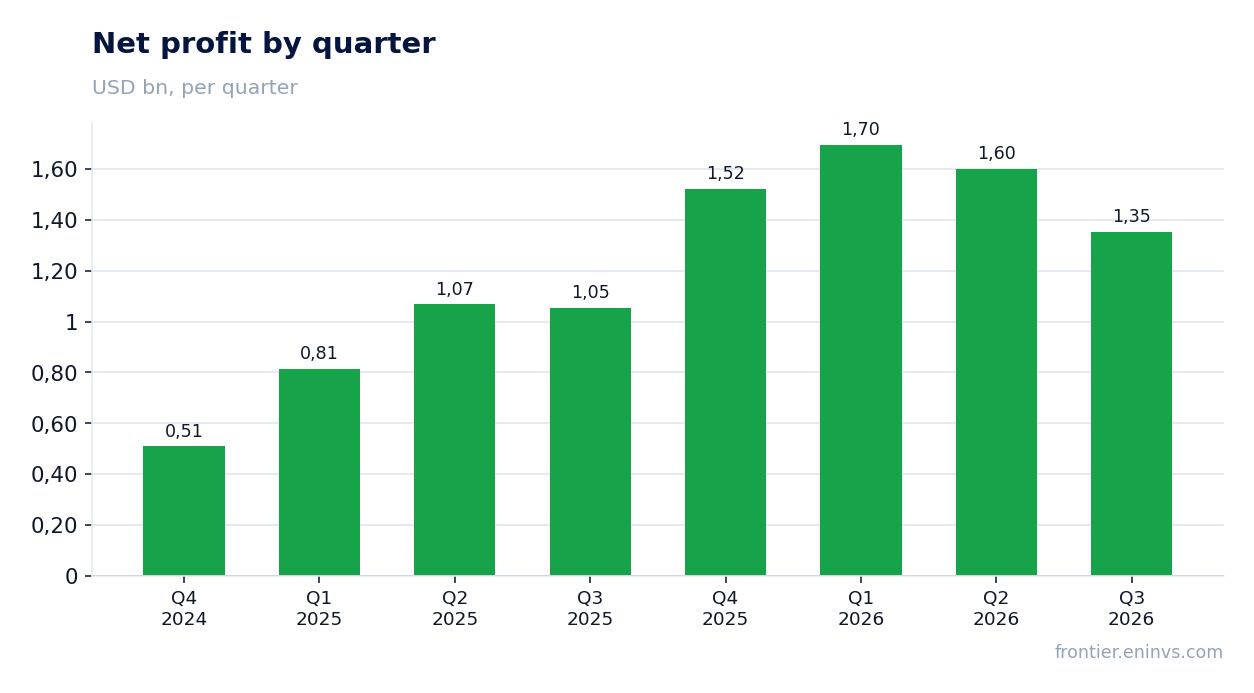
Net profit grew 28.2%, and its margin reached 37.8% versus 34.5% a year earlier
Net profit in the third quarter of 2026 was USD 1,352.9 mn, up 28.2% year on year. The net margin rose to 37.8% from 34.5%. Profit growth outpaces revenue growth, reflecting improved operating efficiency and possibly lower financial expenses.
Over the trailing twelve months, net profit amounted to USD 6,171.8 mn. This figure includes the results of four quarters and gives a sense of the business's scale. Importantly, profit is growing faster than revenue, which positively affects return on equity (ROE 18.6%).
Free cash flow remains solid: operating cash flow of USD 1,755.0 mn against capital expenditures of USD 908.2 mn
Operating cash flow in the third quarter of 2026 was USD 1,755.0 mn. Capital expenditures for the same period were USD 908.2 mn. Thus, free cash flow (the difference between operating cash flow and capex) remains positive and significant, allowing the company to fund dividends and maintain financial stability.
Over the trailing twelve months, operating cash flow reached USD 7,356.5 mn. The company maintains a high level of capital investment, which is typical for the mining sector. However, even including capex, the generated cash flow remains comfortable for servicing obligations and shareholder payouts.
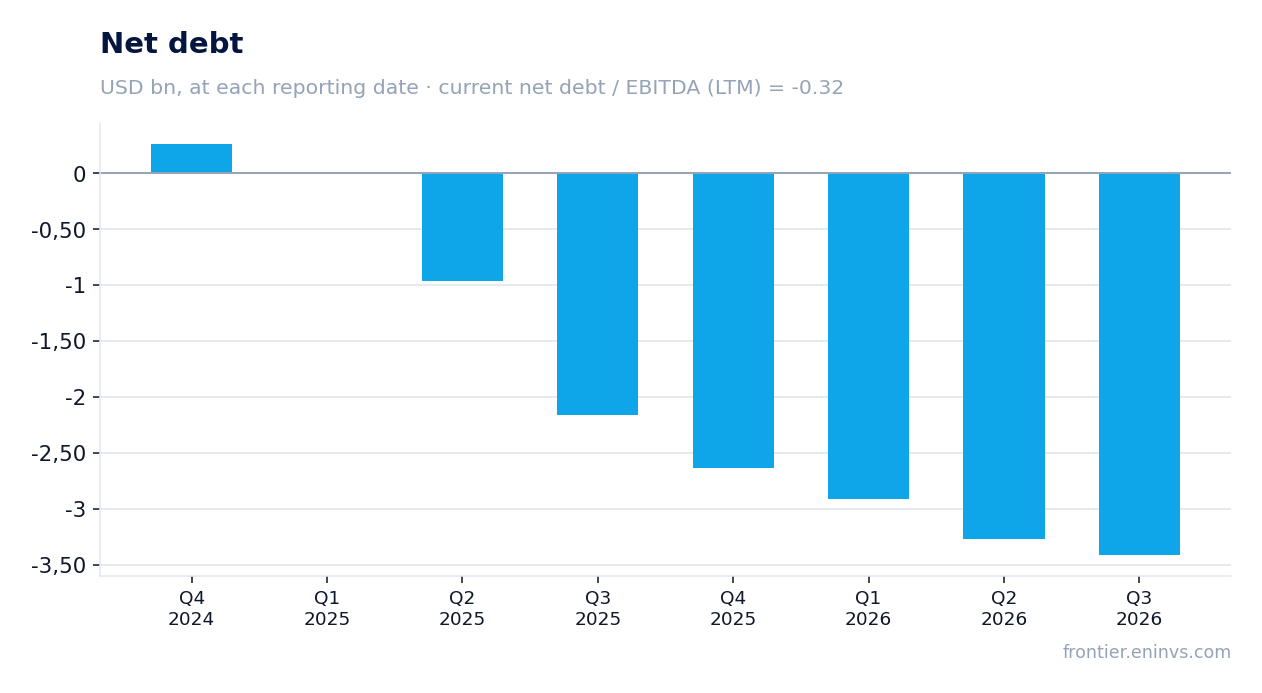
Net debt is negative at USD 3.4 bn, giving a net debt/EBITDA ratio of minus 0.32
As of 30 September 2026, Agnico Eagle Mines' net debt was minus USD 3,416.0 mn, meaning the company has a net cash position. The net debt/EBITDA ratio for the trailing twelve months is minus 0.32. This means cash and equivalents exceed debt obligations, providing high financial flexibility.
During the quarter, net debt changed from minus USD 3.3 bn on 30 June 2026 to minus USD 3.4 bn on 30 September 2026. Over 12 months, the figure improved from minus USD 2.2 bn on 30 September 2025 to minus USD 3.4 bn. Negative net debt and low leverage reduce risks in the event of a gold price decline.
The trailing twelve-month dividend yield is 1.0%, modest against strong cash generation
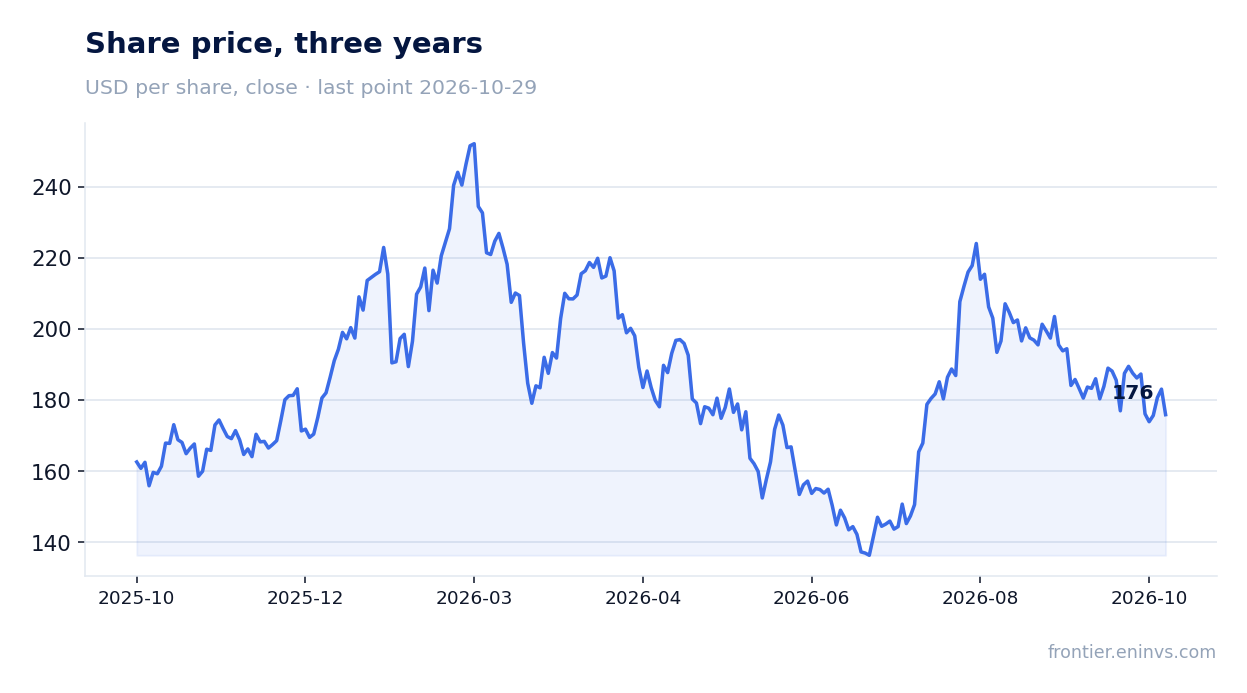
Agnico Eagle Mines' trailing twelve-month dividend yield is 1.0%. With a market capitalisation of USD 88.3 bn, this corresponds to payouts of about USD 883 mn. The company has the ability to increase dividends thanks to strong cash flow and negative net debt.
Our estimate: if current profit and the payout ratio are maintained, the dividend may remain around 1% or slightly higher. However, the company's policy may involve a more conservative approach. A yield of 1.0% is modest compared to the key rate, but for a mining company with growing profits it is acceptable given the potential for capital appreciation.
EV/EBITDA of 8.1 is below its own three-year average of 10.1, meaning the share is cheaper than its history
The trailing twelve-month EV/EBITDA multiple is 8.1. The three-year average for this multiple is 10.1. The current level is 20% below the historical average, indicating the share is undervalued relative to its own history. The trailing P/E is 14.3.
According to the portal's model, which re-prices EBITDA at current commodity prices at the target EV/EBITDA, the upside to fair value is estimated at minus 5%. This means the market has already largely priced in current conditions. Nevertheless, the share has historically traded at a higher multiple, which could support gains if conditions improve.
Valuation on the latest reported figures
| Metric | Value |
|---|---|
| Market cap | 88.3 bn USD |
| P/E (LTM) | 14.3 |
| EV/EBITDA (LTM) | 8.1 |
| P/B | 3.57 |
| Net debt / EBITDA (LTM) | -0.32 |
| Operating cash flow (LTM) | 7.36 bn |
| ROE | 18.6% |
| Dividend yield (12m) | 1.0% |
| EV/EBITDA, 3-year average | 10.1 |
Bottom line
The report's strengths are EBITDA growth of 20.4% and net profit growth of 28.2%, along with maintaining negative net debt. However, the deceleration in revenue to 17.1% and the modest 1.0% dividend yield limit the appeal. The EV/EBITDA of 8.1 versus the historical average of 10.1 suggests undervaluation, but the portal's model indicates a minus 5% upside. Overall, the share looks attractive for investors betting on sustained high gold prices and further profit growth.
Open the company's financial profile AEM →
See also: market overview · valuation map · stock screeners