First Majestic Silver: silver rose 57.6%, yet EBITDA came in 23.4% below what that price implied
Contents

On 11 November First Majestic Silver reported results for the third quarter of 2026. The average silver price in the period was 62.8 dollars against 39.9 a year earlier (+57.6%), gold rose 23.4% to 4268 dollars. Revenue grew 38.1% year on year to 395.9 million dollars, EBITDA by 54.0% to 206.5 million, net profit by 176.2% to 74.5 million. At the year-ago volumes and costs those prices would have produced revenue of 422.4 million and EBITDA of 269.7 million, so the company earned 26.5 million less on revenue and 63.2 million less on EBITDA. Our conclusion: rather unattractive – on the portal's model the share has minus 52% to fair value. Our view: the share is rather unattractive at the current price; upside on the portal model -52%.
Our view: is there upside
Our view in numbers
| Metric | Our read |
|---|---|
| Verdict | Rather unattractive |
| Upside on the portal model | -52% |
| How the model works | spot model: EBITDA re-priced to current commodity prices at the target EV/EBITDA, against market cap |
| Dividend yield, 12m | 0.3% |
| Net debt / EBITDA | -0.71 – net cash |
| Strongest case for | Net cash of 763.1 million dollars and net debt to EBITDA of minus 0.71 give the company a cushion most metal producers do not have. |
| Strongest case against | On the portal's model the share has minus 52% to fair value, and at today's prices EV/EBITDA is already 9.9 against 6.25 on the last twelve months' earnings. |
| What would change the view | A return of silver to 62.8 dollars and holding there would move the verdict one step up, to neutral. |
Key takeaways
— Silver averaged 62.8 dollars in the reported quarter – 57.6% above a year earlier, but already 14.1% below the previous quarter
— At the reported prices and year-ago volumes EBITDA would have been 269.7 million dollars – the company fell 63.2 million short
— Revenue grew 38.1% year on year but slowed from 56.5% a quarter earlier
— The EBITDA margin rose to 52.1% from 46.7%, and the net margin to 18.8% from 9.4%
— Operating cash flow of 101.8 million dollars was almost entirely absorbed by capital expenditure of 89.4 million
— Net cash of 763.1 million dollars with net debt to EBITDA at minus 0.71
— On the portal's spot model EBITDA at today's prices is 652.4 million dollars against 1031.4 million over the last twelve months
Key figures, USD bn
| Metric | Q3 2025 | Q3 2026 | Change |
|---|---|---|---|
| Revenue | 0.29 | 0.40 | +38.1% |
| EBITDA | 0.13 | 0.21 | +54.0% |
| Operating profit | 0.08 | 0.15 | +89.4% |
| Net profit | 0.03 | 0.07 | +176.2% |
| Operating cash flow | 0.11 | 0.10 | -9.6% |
| Capex | 0.06 | 0.09 | +55.9% |
| EBITDA margin | 46.7% | 52.1% | +5.4 pp |
| Net margin | 9.4% | 18.8% | +9.4 pp |
Silver averaged 62.8 dollars in the reported quarter – 57.6% above a year earlier, but already 14.1% below the previous quarter
Silver generates about 70% of revenue, so its price drives the result more than anything else. In the third quarter of 2026 the metal averaged 62.8 dollars an ounce against 39.9 a year earlier – a rise of 57.6%. Gold, which accounts for roughly 30% of revenue, gained 23.4% to 4268 dollars.
Against the second quarter silver has already fallen: 62.8 against 73.1 dollars, minus 14.1%. Gold lost 5.5%, slipping from 4514 to 4268 dollars. Year on year the base was exceptionally strong, but within the year the price has started to retreat.
On 11 November spot silver is 52.3 dollars, 16.8% below the reported-period average, and gold 4045 dollars, 5.2% below. If those levels hold, the next quarter will be earned on a noticeably weaker price base than the one just reported.
Commodity prices: period average and now
| Benchmark | Year ago | Q3 2026 | YoY | Spot 2026-11-11 |
|---|---|---|---|---|
| Silver, USD | 39,9 | 62,8 | +57,6% | 52,3 |
| Gold, USD | 3 459 | 4 268 | +23,4% | 4 045 |
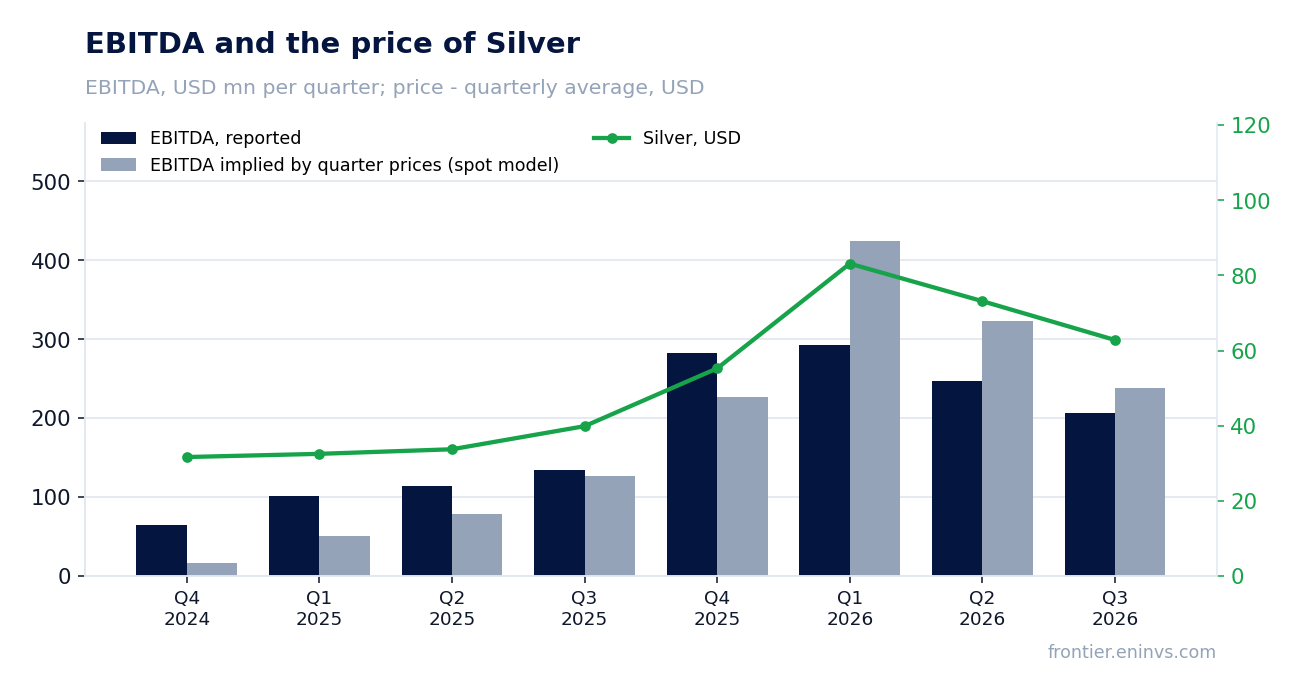
At the reported prices and year-ago volumes EBITDA would have been 269.7 million dollars – the company fell 63.2 million short
On our calculation, taking the volumes and non-commodity costs of the third quarter of 2025 and substituting only the reported-period prices, revenue would have been 422.4 million dollars and EBITDA 269.7 million. The price effect alone would have added 135.6 million to revenue, or 47.3%.
In fact the company booked revenue of 395.9 million and EBITDA of 206.5 million. The gap is minus 26.5 million on revenue (6.3%) and minus 63.2 million on EBITDA (23.4%). Operating profit in the period was 149.3 million and depreciation 57.1 million, and together they make up the EBITDA we compare.
Against the second quarter the picture reverses: at the previous quarter's volumes and costs the prices would have produced revenue of 366.5 million and EBITDA of 199.6 million, while the company booked 395.9 million and 206.5 million – plus 29.4 million and plus 6.9 million respectively. So versus the previous quarter the result is above the price-implied level, while versus a year ago it is well below. The portal's spot model, built from the average of the previous four quarters, expected EBITDA of 238.6 million and revenue of 415.6 million – the actual figures are 13.5% and 4.7% below.
What the prices implied and what the company earned
| Base (Q3 2025) | Implied at period prices | Reported | Reported vs implied | |
|---|---|---|---|---|
| Revenue, USD mn | 286,7 | 422,4 | 395,9 | -6,3% |
| EBITDA, USD mn | 134,0 | 269,7 | 206,5 | -23,4% |
| EBITDA, portal spot model, USD mn | — | 238,6 | 206,5 | -13,5% |
Revenue and EBITDA by quarter
| Period | Measure | bn USD |
|---|---|---|
| Q4 2024 | Revenue | 0.1719340000000001 |
| Q1 2025 | Revenue | 0.245992 |
| Q2 2025 | Revenue | 0.264726 |
| Q3 2025 | Revenue | 0.286723 |
| Q4 2025 | Revenue | 0.467716 |
| Q1 2026 | Revenue | 0.480938 |
| Q2 2026 | Revenue | 0.41423899999999997 |
| Q3 2026 | Revenue | 0.39588799999999996 |
| Q4 2024 | EBITDA | 0.065014 |
| Q1 2025 | EBITDA | 0.10064400000000001 |
| Q2 2025 | EBITDA | 0.11354 |
| Q3 2025 | EBITDA | 0.134042 |
| Q4 2025 | EBITDA | 0.28303100000000003 |
| Q1 2026 | EBITDA | 0.292401 |
| Q2 2026 | EBITDA | 0.247355 |
| Q3 2026 | EBITDA | 0.206452 |
EBITDA margin
| Period | Measure | % |
|---|---|---|
| Q4 2024 | EBITDA margin | 37.8 |
| Q1 2025 | EBITDA margin | 40.9 |
| Q2 2025 | EBITDA margin | 42.9 |
| Q3 2025 | EBITDA margin | 46.7 |
| Q4 2025 | EBITDA margin | 60.5 |
| Q1 2026 | EBITDA margin | 60.8 |
| Q2 2026 | EBITDA margin | 59.7 |
| Q3 2026 | EBITDA margin | 52.1 |
Revenue grew 38.1% year on year but slowed from 56.5% a quarter earlier
Revenue in the third quarter of 2026 was 395.9 million dollars, 38.1% above a year earlier. That is a marked slowdown: growth was 56.5% in the second quarter and 95.5% in the first. The deceleration runs along two lines at once – silver fell 14.1% against the previous quarter, and the year-ago base was low.
Against the second quarter revenue declined: 395.9 against 414.2 million. This is the first sequential fall after four quarters of growth, and it coincides with the retreat in silver and gold prices within the year.
For a company that sells metal, revenue growth is a derivative of price and volume. The price rose 57.6% year on year for silver and 23.4% for gold, while revenue rose only 38.1%, so part of the price gain was absorbed by volumes or by the realised price against the benchmark.
The EBITDA margin rose to 52.1% from 46.7%, and the net margin to 18.8% from 9.4%
The EBITDA margin in the reported quarter was 52.1% against 46.7% a year earlier. Margin growth with a more expensive metal is expected: revenue per ounce rose faster than the cost of producing it. But the margin could have been higher – at the reported prices and year-ago costs it would have produced EBITDA of 269.7 million, or 63.8% of revenue rather than 52.1%.
Net profit was 74.5 million dollars, 176.2% above a year earlier, and the net margin 18.8% against 9.4%. Profit grew faster than EBITDA because the company holds a net cash position and interest costs do not weigh on the result. Which items below operating profit affected it is not visible from our data, so we will not tie the acceleration in net profit to a specific line.
Operating profit was 149.3 million dollars, and together with depreciation of 57.1 million it gives EBITDA of 206.5 million. That is the base from which the margin is calculated.
Operating cash flow of 101.8 million dollars was almost entirely absorbed by capital expenditure of 89.4 million
Operating cash flow for the quarter was 101.8 million dollars and capital expenditure 89.4 million. That leaves about 12.4 million of free cash flow, so almost all the cash the company earns goes back into production. This is above previous quarters: capex was 59.5 million in the second quarter and 47.5 million in the first.
The rise in capital expenditure matters for a company with a short reserve life: at the current production rate reserves last 5.8 years. Sustaining output without constant investment in the mines is impossible, so the high capex share of cash flow is not a one-off but a condition of doing business.
Net cash at 30 September was 763.1 million dollars, and net debt to EBITDA over the last twelve months was minus 0.71. There is no debt burden and interest costs do not interfere, but free cash available for dividends or buybacks after capital expenditure is limited.
Net cash of 763.1 million dollars with net debt to EBITDA at minus 0.71
At 30 September 2026 the company held net cash of 763.1 million dollars – more cash than debt. Net debt to EBITDA over the last twelve months was minus 0.71. That is a level, not a trend: there is no prior-period comparison in our data, so we will not speak of leverage rising or falling.
For a metal producer such a cushion is insurance against a price fall. At today's prices EBITDA is estimated at 652.4 million dollars, and net debt to that is minus 1.17. Even in a weak market the balance sheet stays strong.
The flip side is that cash on the balance sheet does not work for the shareholder. With a market capitalisation of 7.2 billion dollars the net cash position is about 10.6% of it, and the market values it inside the company rather than separately.
Share price, three years
close, last point 2026-11-10
| Period | Measure | USD per share |
|---|---|---|
| 2025-11-10 | Closing price | 11.880000114440918 |
| 2025-11-11 | Closing price | 11.9399995803833 |
| 2025-11-12 | Closing price | 12.569999694824219 |
| 2025-11-13 | Closing price | 12.220000267028809 |
| 2025-11-14 | Closing price | 12.010000228881836 |
| 2025-11-17 | Closing price | 11.550000190734863 |
| 2025-11-18 | Closing price | 11.699999809265137 |
| 2025-11-19 | Closing price | 11.84000015258789 |
| 2025-11-20 | Closing price | 11.020000457763672 |
| 2025-11-21 | Closing price | 11.119999885559082 |
| 2025-11-24 | Closing price | 12.0600004196167 |
| 2025-11-25 | Closing price | 12.40999984741211 |
| 2025-11-26 | Closing price | 13.510000228881836 |
| 2025-11-28 | Closing price | 15.229999542236328 |
| 2025-12-01 | Closing price | 15.520000457763672 |
| 2025-12-02 | Closing price | 15.90999984741211 |
| 2025-12-03 | Closing price | 15.6899995803833 |
| 2025-12-04 | Closing price | 15.020000457763672 |
| 2025-12-05 | Closing price | 15.0600004196167 |
| 2025-12-08 | Closing price | 14.369999885559082 |
| 2025-12-09 | Closing price | 15.399999618530273 |
| 2025-12-10 | Closing price | 15.6899995803833 |
| 2025-12-11 | Closing price | 16.809999465942383 |
| 2025-12-12 | Closing price | 15.9399995803833 |
| 2025-12-15 | Closing price | 16.040000915527344 |
| 2025-12-16 | Closing price | 16.399999618530273 |
| 2025-12-17 | Closing price | 16.3799991607666 |
| 2025-12-18 | Closing price | 16.149999618530273 |
| 2025-12-19 | Closing price | 16.690000534057617 |
| 2025-12-22 | Closing price | 17.520000457763672 |
| 2025-12-23 | Closing price | 17.3799991607666 |
| 2025-12-24 | Closing price | 17.209999084472656 |
| 2025-12-26 | Closing price | 17.420000076293945 |
| 2025-12-29 | Closing price | 16.700000762939453 |
| 2025-12-30 | Closing price | 16.93000030517578 |
| 2025-12-31 | Closing price | 16.65999984741211 |
| 2026-01-02 | Closing price | 16.059999465942383 |
| 2026-01-05 | Closing price | 17.040000915527344 |
| 2026-01-06 | Closing price | 18.719999313354492 |
| 2026-01-07 | Closing price | 17.940000534057617 |
| 2026-01-08 | Closing price | 17.899999618530273 |
| 2026-01-09 | Closing price | 18.90999984741211 |
| 2026-01-12 | Closing price | 20.219999313354492 |
| 2026-01-13 | Closing price | 19.850000381469727 |
| 2026-01-14 | Closing price | 19.829999923706055 |
| 2026-01-15 | Closing price | 20.34000015258789 |
| 2026-01-16 | Closing price | 21.5 |
| 2026-01-20 | Closing price | 22.459999084472656 |
| 2026-01-21 | Closing price | 22.200000762939453 |
| 2026-01-22 | Closing price | 24.219999313354492 |
| 2026-01-23 | Closing price | 25.440000534057617 |
| 2026-01-26 | Closing price | 25.719999313354492 |
| 2026-01-27 | Closing price | 25.719999313354492 |
| 2026-01-28 | Closing price | 26.229999542236328 |
| 2026-01-29 | Closing price | 25.170000076293945 |
| 2026-01-30 | Closing price | 20.84000015258789 |
| 2026-02-02 | Closing price | 20.399999618530273 |
| 2026-02-03 | Closing price | 22.040000915527344 |
| 2026-02-04 | Closing price | 22.43000030517578 |
| 2026-02-05 | Closing price | 20.25 |
| 2026-02-06 | Closing price | 21.989999771118164 |
| 2026-02-09 | Closing price | 23.75 |
| 2026-02-10 | Closing price | 23.790000915527344 |
| 2026-02-11 | Closing price | 23.809999465942383 |
| 2026-02-12 | Closing price | 21.59000015258789 |
| 2026-02-13 | Closing price | 22.959999084472656 |
| 2026-02-17 | Closing price | 21.549999237060547 |
| 2026-02-18 | Closing price | 22.600000381469727 |
| 2026-02-19 | Closing price | 24.780000686645508 |
| 2026-02-20 | Closing price | 27.549999237060547 |
| 2026-02-23 | Closing price | 28.600000381469727 |
| 2026-02-24 | Closing price | 29.510000228881836 |
| 2026-02-25 | Closing price | 29.40999984741211 |
| 2026-02-26 | Closing price | 31.100000381469727 |
| 2026-02-27 | Closing price | 32.0099983215332 |
| 2026-03-02 | Closing price | 31.600000381469727 |
| 2026-03-03 | Closing price | 28.3700008392334 |
| 2026-03-04 | Closing price | 28.649999618530273 |
| 2026-03-05 | Closing price | 26.270000457763672 |
| 2026-03-06 | Closing price | 25.829999923706055 |
| 2026-03-09 | Closing price | 26.139999389648438 |
| 2026-03-10 | Closing price | 26.719999313354492 |
| 2026-03-11 | Closing price | 25.709999084472656 |
| 2026-03-12 | Closing price | 24.6299991607666 |
| 2026-03-13 | Closing price | 22.559999465942383 |
| 2026-03-16 | Closing price | 22.209999084472656 |
| 2026-03-17 | Closing price | 21.739999771118164 |
| 2026-03-18 | Closing price | 20.350000381469727 |
| 2026-03-19 | Closing price | 18.950000762939453 |
| 2026-03-20 | Closing price | 18.270000457763672 |
| 2026-03-23 | Closing price | 19.200000762939453 |
| 2026-03-24 | Closing price | 20.100000381469727 |
| 2026-03-25 | Closing price | 20.780000686645508 |
| 2026-03-26 | Closing price | 19.31999969482422 |
| 2026-03-27 | Closing price | 20.68000030517578 |
| 2026-03-30 | Closing price | 19.649999618530273 |
| 2026-03-31 | Closing price | 21.479999542236328 |
| 2026-04-01 | Closing price | 22.170000076293945 |
| 2026-04-02 | Closing price | 21.84000015258789 |
| 2026-04-06 | Closing price | 21.399999618530273 |
| 2026-04-07 | Closing price | 21.260000228881836 |
| 2026-04-08 | Closing price | 20.90999984741211 |
| 2026-04-09 | Closing price | 20.59000015258789 |
| 2026-04-10 | Closing price | 20.579999923706055 |
| 2026-04-13 | Closing price | 20.780000686645508 |
| 2026-04-14 | Closing price | 21.530000686645508 |
| 2026-04-15 | Closing price | 21.15999984741211 |
| 2026-04-16 | Closing price | 21.049999237060547 |
| 2026-04-17 | Closing price | 21.489999771118164 |
| 2026-04-20 | Closing price | 21.520000457763672 |
| 2026-04-21 | Closing price | 20.079999923706055 |
| 2026-04-22 | Closing price | 20.90999984741211 |
| 2026-04-23 | Closing price | 20.25 |
| 2026-04-24 | Closing price | 20.559999465942383 |
| 2026-04-27 | Closing price | 20.479999542236328 |
| 2026-04-28 | Closing price | 19.5 |
| 2026-04-29 | Closing price | 18.950000762939453 |
| 2026-04-30 | Closing price | 19.709999084472656 |
| 2026-05-01 | Closing price | 19.850000381469727 |
| 2026-05-04 | Closing price | 19.3799991607666 |
| 2026-05-05 | Closing price | 19.100000381469727 |
| 2026-05-06 | Closing price | 21.18000030517578 |
| 2026-05-07 | Closing price | 21.3700008392334 |
| 2026-05-08 | Closing price | 21.860000610351562 |
| 2026-05-11 | Closing price | 23.579999923706055 |
| 2026-05-12 | Closing price | 24.209999084472656 |
| 2026-05-13 | Closing price | 23.979999542236328 |
| 2026-05-14 | Closing price | 22.65999984741211 |
| 2026-05-15 | Closing price | 20.420000076293945 |
| 2026-05-18 | Closing price | 19.729999542236328 |
| 2026-05-19 | Closing price | 18.799999237060547 |
| 2026-05-20 | Closing price | 19.940000534057617 |
| 2026-05-21 | Closing price | 19.899999618530273 |
| 2026-05-22 | Closing price | 19.450000762939453 |
| 2026-05-26 | Closing price | 20.280000686645508 |
| 2026-05-27 | Closing price | 19.670000076293945 |
| 2026-05-28 | Closing price | 20.579999923706055 |
| 2026-05-29 | Closing price | 21.079999923706055 |
| 2026-06-01 | Closing price | 20.829999923706055 |
| 2026-06-02 | Closing price | 20.989999771118164 |
| 2026-06-03 | Closing price | 19.770000457763672 |
| 2026-06-04 | Closing price | 19.770000457763672 |
| 2026-06-05 | Closing price | 16.989999771118164 |
| 2026-06-08 | Closing price | 17.170000076293945 |
| 2026-06-09 | Closing price | 16.540000915527344 |
| 2026-06-10 | Closing price | 15.710000038146973 |
| 2026-06-11 | Closing price | 16.920000076293945 |
| 2026-06-12 | Closing price | 17.649999618530273 |
| 2026-06-15 | Closing price | 18.899999618530273 |
| 2026-06-16 | Closing price | 19.420000076293945 |
| 2026-06-17 | Closing price | 18.549999237060547 |
| 2026-06-18 | Closing price | 18.0 |
| 2026-06-22 | Closing price | 17.719999313354492 |
| 2026-06-23 | Closing price | 16.5 |
| 2026-06-24 | Closing price | 16.059999465942383 |
| 2026-06-25 | Closing price | 16.5 |
| 2026-06-26 | Closing price | 16.889999389648438 |
| 2026-06-29 | Closing price | 16.809999465942383 |
| 2026-06-30 | Closing price | 16.959999084472656 |
| 2026-07-01 | Closing price | 17.040000915527344 |
| 2026-07-02 | Closing price | 17.81999969482422 |
| 2026-07-06 | Closing price | 17.309999465942383 |
| 2026-07-07 | Closing price | 16.450000762939453 |
| 2026-07-08 | Closing price | 15.800000190734863 |
| 2026-07-09 | Closing price | 17.15999984741211 |
| 2026-07-10 | Closing price | 16.950000762939453 |
| 2026-07-13 | Closing price | 16.399999618530273 |
| 2026-07-14 | Closing price | 16.93000030517578 |
| 2026-07-15 | Closing price | 16.84000015258789 |
| 2026-07-16 | Closing price | 15.880000114440918 |
| 2026-07-17 | Closing price | 15.8100004196167 |
| 2026-07-20 | Closing price | 15.850000381469727 |
| 2026-07-21 | Closing price | 16.8700008392334 |
| 2026-07-22 | Closing price | 17.309999465942383 |
| 2026-07-23 | Closing price | 16.450000762939453 |
| 2026-07-24 | Closing price | 16.309999465942383 |
| 2026-07-27 | Closing price | 16.219999313354492 |
| 2026-07-28 | Closing price | 15.6899995803833 |
| 2026-07-29 | Closing price | 15.220000267028809 |
| 2026-07-30 | Closing price | 15.6899995803833 |
| 2026-07-31 | Closing price | 15.029999732971191 |
| 2026-08-03 | Closing price | 15.699999809265137 |
| 2026-08-04 | Closing price | 16.489999771118164 |
| 2026-08-05 | Closing price | 17.610000610351562 |
| 2026-08-06 | Closing price | 17.280000686645508 |
| 2026-08-07 | Closing price | 18.399999618530273 |
| 2026-08-10 | Closing price | 18.850000381469727 |
| 2026-08-11 | Closing price | 18.959999084472656 |
| 2026-08-12 | Closing price | 19.15999984741211 |
| 2026-08-13 | Closing price | 18.780000686645508 |
| 2026-08-14 | Closing price | 19.260000228881836 |
| 2026-08-17 | Closing price | 19.56999969482422 |
| 2026-08-18 | Closing price | 18.479999542236328 |
| 2026-08-19 | Closing price | 20.850000381469727 |
| 2026-08-20 | Closing price | 21.190000534057617 |
| 2026-08-21 | Closing price | 21.09000015258789 |
| 2026-08-24 | Closing price | 20.829999923706055 |
| 2026-08-25 | Closing price | 21.239999771118164 |
| 2026-08-26 | Closing price | 20.989999771118164 |
| 2026-08-27 | Closing price | 21.739999771118164 |
| 2026-08-28 | Closing price | 20.760000228881836 |
| 2026-08-31 | Closing price | 20.59000015258789 |
| 2026-09-01 | Closing price | 19.860000610351562 |
| 2026-09-02 | Closing price | 21.200000762939453 |
| 2026-09-03 | Closing price | 21.389999389648438 |
| 2026-09-04 | Closing price | 20.969999313354492 |
| 2026-09-08 | Closing price | 20.75 |
| 2026-09-09 | Closing price | 21.18000030517578 |
| 2026-09-10 | Closing price | 20.149999618530273 |
| 2026-09-11 | Closing price | 19.559999465942383 |
| 2026-09-14 | Closing price | 18.799999237060547 |
| 2026-09-15 | Closing price | 18.639999389648438 |
| 2026-09-16 | Closing price | 18.329999923706055 |
| 2026-09-17 | Closing price | 19.489999771118164 |
| 2026-09-18 | Closing price | 19.84000015258789 |
| 2026-09-21 | Closing price | 19.309999465942383 |
| 2026-09-22 | Closing price | 20.31999969482422 |
| 2026-09-23 | Closing price | 19.049999237060547 |
| 2026-09-24 | Closing price | 18.760000228881836 |
| 2026-09-25 | Closing price | 19.010000228881836 |
| 2026-09-28 | Closing price | 17.950000762939453 |
| 2026-09-29 | Closing price | 18.079999923706055 |
| 2026-09-30 | Closing price | 17.690000534057617 |
| 2026-10-01 | Closing price | 17.65999984741211 |
| 2026-10-02 | Closing price | 17.670000076293945 |
| 2026-10-05 | Closing price | 17.510000228881836 |
| 2026-10-06 | Closing price | 17.540000915527344 |
| 2026-10-07 | Closing price | 16.649999618530273 |
| 2026-10-08 | Closing price | 16.979999542236328 |
| 2026-10-09 | Closing price | 17.280000686645508 |
| 2026-10-12 | Closing price | 16.989999771118164 |
| 2026-10-13 | Closing price | 16.329999923706055 |
| 2026-10-14 | Closing price | 15.25 |
| 2026-10-15 | Closing price | 16.09000015258789 |
| 2026-10-16 | Closing price | 15.979999542236328 |
| 2026-10-19 | Closing price | 15.979999542236328 |
| 2026-10-20 | Closing price | 15.989999771118164 |
| 2026-10-21 | Closing price | 16.09000015258789 |
| 2026-10-22 | Closing price | 15.119999885559082 |
| 2026-10-23 | Closing price | 14.770000457763672 |
| 2026-10-26 | Closing price | 14.850000381469727 |
| 2026-10-27 | Closing price | 15.640000343322754 |
| 2026-10-28 | Closing price | 15.800000190734863 |
| 2026-10-29 | Closing price | 15.329999923706055 |
| 2026-10-30 | Closing price | 14.260000228881836 |
| 2026-11-02 | Closing price | 14.319999694824219 |
| 2026-11-03 | Closing price | 14.100000381469727 |
| 2026-11-04 | Closing price | 15.390000343322754 |
| 2026-11-05 | Closing price | 14.890000343322754 |
| 2026-11-06 | Closing price | 15.15999984741211 |
| 2026-11-09 | Closing price | 15.869999885559082 |
| 2026-11-10 | Closing price | 14.994999885559082 |
On the portal's spot model EBITDA at today's prices is 652.4 million dollars against 1031.4 million over the last twelve months
Over the last twelve months the company earned EBITDA of 1031.4 million dollars on revenue of 1800.0 million and net profit of 431.0 million. But that money was earned at the average prices of past quarters, when silver was well above today's spot. On the portal's spot model, at the prices of 11 November annual EBITDA is 652.4 million, 36.7% less.
Valuation changes accordingly. On the trailing-twelve-month multiple EV/EBITDA is 6.25 and P/E 16.7. At today's prices EV/EBITDA is 9.9. For a company whose revenue is 70% silver, the second figure should be the reference: the market pays for the profit the company can earn at the current metal price, not last year's.
On the portal's model, which re-prices EBITDA to current prices at the target EV/EBITDA, the share has minus 52% to fair value. That is our own estimate, not a market consensus and not a target price.
Valuation on the latest reported figures
| Metric | Value |
|---|---|
| Market cap | 7.19 bn USD |
| P/E (LTM) | 16.7 |
| EV/EBITDA (LTM) | 6.2 |
| P/B | 2.60 |
| Net debt / EBITDA (LTM) | -0.71 |
| Operating cash flow (LTM) | 0.82 bn |
| ROE | 9.9% |
| Dividend yield (12m) | 0.3% |
Net profit by quarter
| Period | Measure | bn USD |
|---|---|---|
| Q4 2024 | Net profit | −0.013539 |
| Q1 2025 | Net profit | 0.00624 |
| Q2 2025 | Net profit | 0.056579 |
| Q3 2025 | Net profit | 0.026978000000000002 |
| Q4 2025 | Net profit | 0.083133 |
| Q1 2026 | Net profit | 0.14748599999999998 |
| Q2 2026 | Net profit | 0.125893 |
| Q3 2026 | Net profit | 0.074526 |
Bottom line
The quarter's strength remains the balance sheet: net cash of 763.1 million dollars and net debt to EBITDA of minus 0.71 give the company a cushion at any metal price. But it earned less than prices allowed: on our calculation at year-ago volumes and costs EBITDA would have been 269.7 million against the actual 206.5 million. Revenue growth of 38.1% and a margin of 52.1% are the consequence of expensive silver, not of better mining, and the price base is already weaker for the next quarter: spot is 16.8% below the reported-period average. On the portal's spot model EBITDA at today's prices is 652.4 million against 1031.4 million over the last twelve months, and EV/EBITDA at current prices is 9.9 against 6.25 on past ones. Our conclusion: rather unattractive – on the portal's model the share has minus 52% to fair value. Our view: the share is rather unattractive at the current price; upside on the portal model -52%.