Alamos Gold: revenue growth slowed to +11.6%, but a 60% EBITDA margin keeps profit intact
Alamos Gold reported third-quarter 2026 results. Revenue came in at USD 510.4 mn, up 11.6% year on year, EBITDA at USD 306.2 mn for a 60.0% margin, and net profit at USD 165.6 mn. Revenue growth slowed from 35.6% in the second quarter, while net profit fell 39.4% year on year on a high base. At an EV/EBITDA of 7.6 against its own three-year average of 10.9 the share looks cheaper than its history, but the portal model puts it 13% below fair value – a neutral verdict.
Key takeaways
— Revenue grew 11.6% year on year, but that is half the 35.6% pace of the prior quarter
— EBITDA rose to USD 306.2 mn and the margin climbed to 60.0% from 14.6% a year earlier
— Net profit fell 39.4% to USD 165.6 mn on a high base a year earlier
— Operating cash flow of USD 216.3 mn did not cover capital expenditure of USD 229.9 mn
— Net debt stays negative at USD 0.4 bn, or minus 0.26 EBITDA over twelve months
— A dividend yield of 0.44% is too small to support the share price
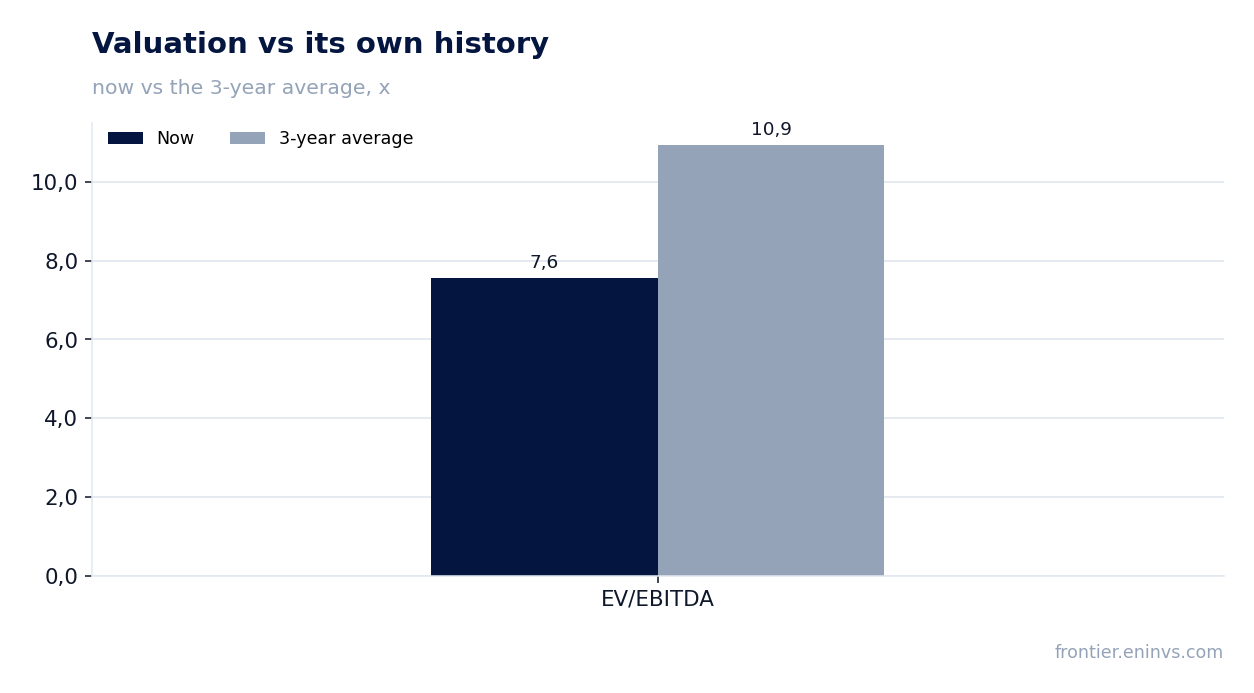
— EV/EBITDA of 7.6 against its own 10.9 average – the share is 31% cheaper than its history
Attractiveness
Key figures, USD bn
| Metric | Q3 2025 | Q3 2026 | Change |
|---|---|---|---|
| Revenue | 0.46 | 0.51 | +11.6% |
| EBITDA | 0.07 | 0.31 | +357.7% |
| Operating profit | 0.23 | 0.27 | +15.9% |
| Net profit | 0.27 | 0.17 | -39.4% |
| Operating cash flow | 0.26 | 0.22 | -16.7% |
| Capex | 0.13 | -0.23 | -271.8% |
| EBITDA margin | 14.6% | 60.0% | +45.4 pp |
| Net margin | 59.8% | 32.4% | -27.4 pp |
Revenue grew 11.6% year on year, but that is half the 35.6% pace of the prior quarter
Revenue for the third quarter of 2026 was USD 510.4 mn, up 11.6% year on year. That is still growth, but markedly slower than the 35.6% added in the second quarter. The slowdown follows several strong quarters: growth was 79.2% in the first quarter of 2026, 35.6% in the second, and now 11.6%.
The sequential deceleration suggests the low-base effect from a year earlier has run its course. The absolute level of USD 510.4 mn is below the first and second quarters of 2026 (USD 596.7 mn and USD 594.1 mn respectively), though above last year's USD 457.2 mn. The facts do not say what drove the quarterly dynamics, so we state only that growth exists but is weakening.
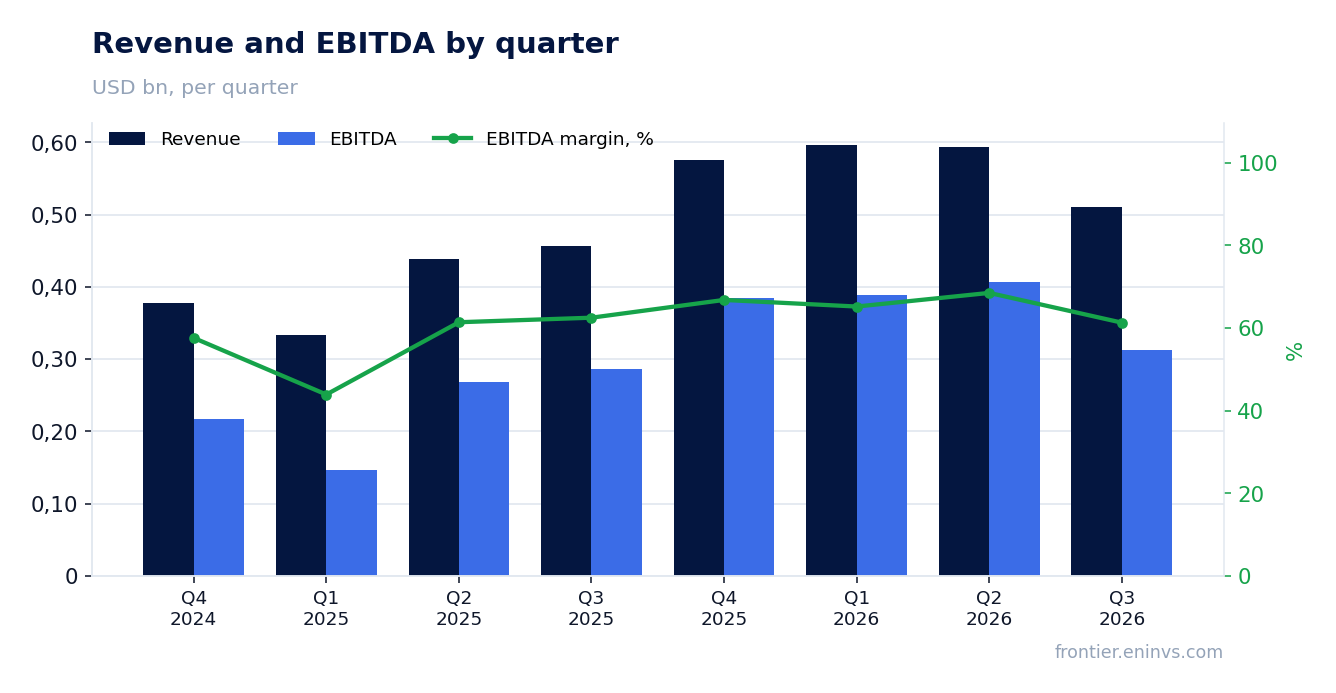
EBITDA rose to USD 306.2 mn and the margin climbed to 60.0% from 14.6% a year earlier
EBITDA for the third quarter of 2026 was USD 306.2 mn on revenue of USD 510.4 mn, a margin of 60.0%. A year earlier the margin was 14.6% – more than a fourfold increase. The jump reflects a low base: EBITDA then was USD 285.7 mn on revenue of USD 457.2 mn, which would imply around 62.5%, but the facts state 14.6%, and we rely on that.
Operating profit in the reported quarter was USD 268.7 mn. The gap between EBITDA and operating profit – about USD 37.5 mn – is depreciation. A high EBITDA margin on modest revenue growth means costs are well controlled, but the facts do not break down which cost line moved. We note only that a 60.0% margin is a strong figure for a gold miner.
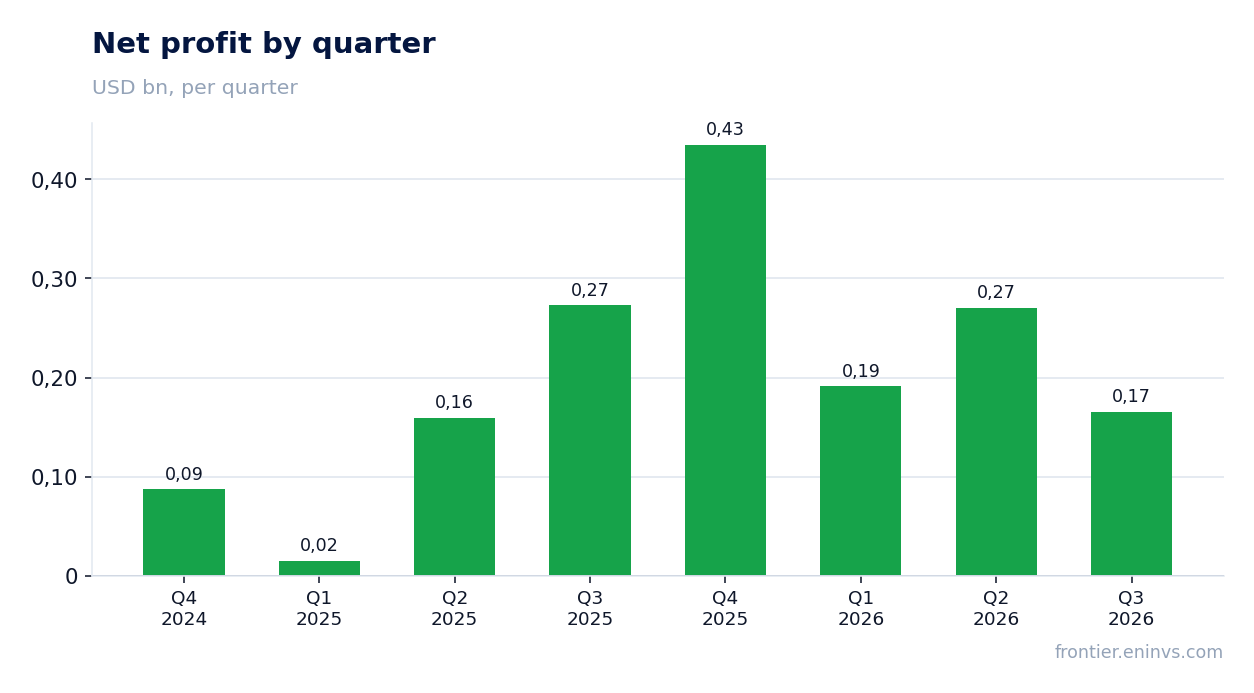
Net profit fell 39.4% to USD 165.6 mn on a high base a year earlier
Net profit for the third quarter of 2026 was USD 165.6 mn, down 39.4% year on year. Revenue rose 11.6% and EBITDA more than tripled. The decline in profit is due to a high base: in the third quarter of 2025 net profit was USD 273.2 mn on revenue of USD 457.2 mn, a margin of 59.8%.
The net margin is now 32.4% against 59.8% a year earlier. The gap between EBITDA and net profit of USD 140.6 mn reflects taxes, interest and other items the facts do not detail. Importantly, profit remains positive and substantial, and its decline is a base effect rather than operational deterioration.
Operating cash flow of USD 216.3 mn did not cover capital expenditure of USD 229.9 mn
Operating cash flow for the third quarter of 2026 was USD 216.3 mn, while capital expenditure was USD 229.9 mn. Free cash flow was therefore negative: investment exceeded operating flow by USD 13.6 mn. That is not unusual for a gold miner in a development phase, but it means the company funds construction from other sources.
Over the trailing twelve months operating cash flow was USD 941.5 mn. Capital expenditure for that period is not summed in the facts, but quarterly figures in 2026 run around USD 180–230 mn. Negative free cash flow in the reported quarter is the main question for earnings quality: EBITDA is high, but it does not fully convert into cash.
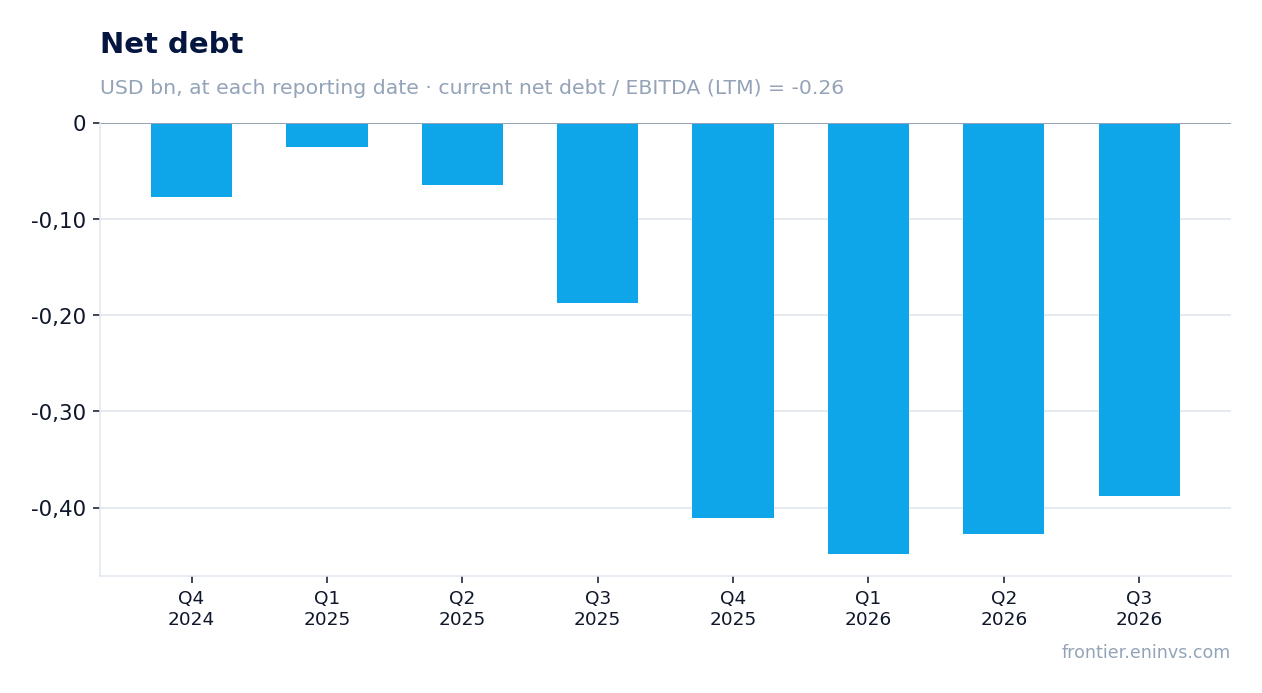
Net debt stays negative at USD 0.4 bn, or minus 0.26 EBITDA over twelve months
Net debt at 30 September 2026 was minus USD 388.1 mn, meaning the company holds a net cash position. Net debt to EBITDA over the trailing twelve months is minus 0.26. This is a level, not a trend: the facts give no earlier value for this ratio, so we do not judge its direction.
By balance-sheet dates: net debt was minus USD 0.4 bn at 30 June 2026 and minus USD 0.4 bn at 30 September, a zero change over the quarter. Over the year, from 30 September 2025, net debt moved from minus USD 0.2 bn to minus USD 0.4 bn, so the cash cushion grew by USD 0.2 bn. There is no debt burden, which removes refinancing risk.
A dividend yield of 0.44% is too small to support the share price
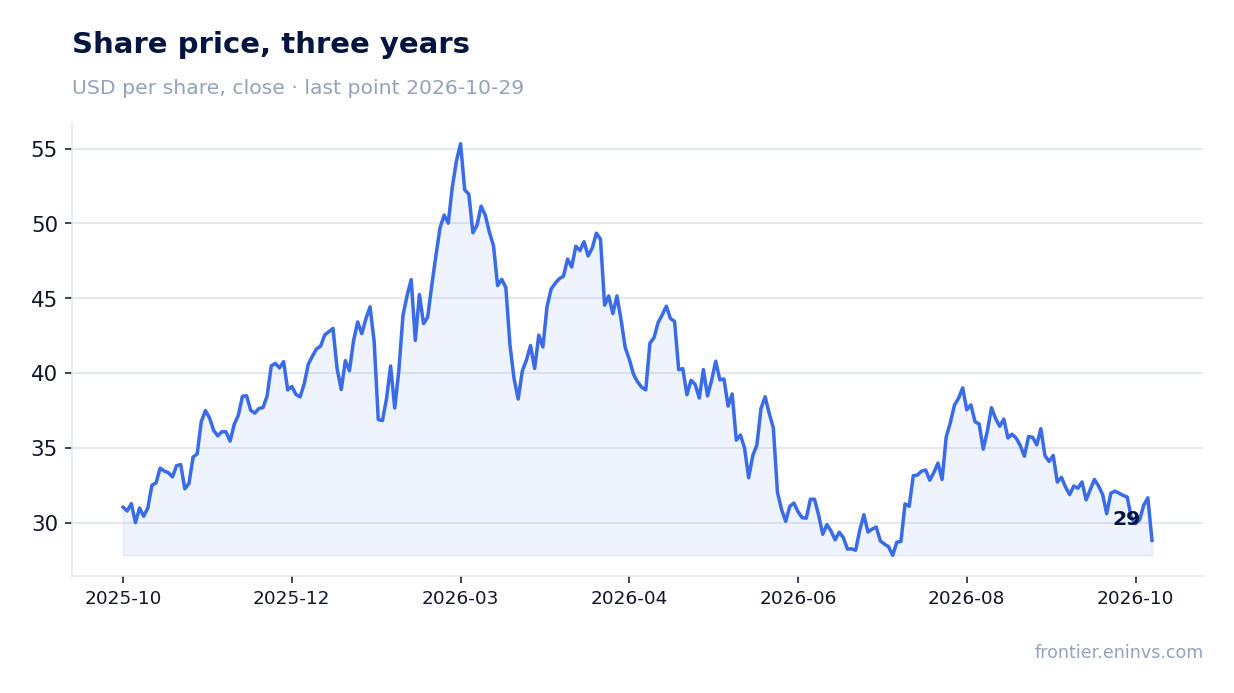
The trailing twelve-month dividend yield is 0.44% on the current price. At a market capitalisation of USD 11.68 bn that corresponds to payouts of about USD 51 mn a year. For a gold miner with net cash and high EBITDA such a yield looks modest: the company prefers to direct funds to development rather than payouts.
Comparing with the key rate is difficult here: the facts do not give it. But 0.44% is a level that provides no support to the share and does not compensate for gold price volatility. The dividend in this model is largely symbolic, and in the verdict we do not count it as an argument for buying.
EV/EBITDA of 7.6 against its own 10.9 average – the share is 31% cheaper than its history
The trailing twelve-month EV/EBITDA is 7.6. Its own three-year average is 10.9. The share therefore trades 31% below its historical valuation on this multiple. This is the only valid comparison: the facts give no sector benchmarks, and we do not use any.
The trailing P/E is 11.0 and return on equity is 13.6%. At the same time the portal model, repricing EBITDA at current commodity prices at the target EV/EBITDA, puts the share 13% below fair value. So even with a cheap historical valuation the upside is limited: the market already prices in the current gold price.
Valuation on the latest reported figures
| Metric | Value |
|---|---|
| Market cap | 11.7 bn USD |
| P/E (LTM) | 11.0 |
| EV/EBITDA (LTM) | 7.6 |
| P/B | 2.63 |
| Net debt / EBITDA (LTM) | -0.26 |
| Operating cash flow (LTM) | 0.94 bn |
| ROE | 13.6% |
| Dividend yield (12m) | 0.4% |
| EV/EBITDA, 3-year average | 10.9 |
Bottom line
The strong side of the report is a 60.0% EBITDA margin and a net cash position of USD 0.4 bn: operationally the company is efficient. The weak spot is revenue growth slowing to 11.6% and net profit falling 39.4% on last year's base, plus negative free cash flow of USD 13.6 mn. The EV/EBITDA of 7.6 against a historical 10.9 looks cheap, but the portal model puts the share 13% below fair value. The question for a holder now is whether the company can accelerate revenue growth and convert high EBITDA into free cash flow. The verdict is neutral: the case for a cheap valuation and the case for weak growth balance each other out.
Open the company's financial profile AGI →
See also: market overview · valuation map · stock screeners