Amplify Energy: oil price up 31.7%, yet EBITDA came in 36% below what that price implied
Contents
On November 9, Amplify Energy reported third-quarter 2026 results. Average WTI in the period was $85.4 versus $64.9 a year earlier (+31.7%), yet revenue fell 22.5% to $51.4 million while EBITDA rose 31.8% to $16.7 million. On our calculation, at year-ago volumes and costs and current prices, revenue should have been $79.9 million and EBITDA $26.2 million; actual results were $28.4 million and $9.5 million lower respectively. The gap is explained by lower production and a discount to the benchmark: the realised price was $75.2 per barrel, or 0.88 of average WTI, plus $9.7 million of realised hedge losses booked inside operating income. Our conclusion: rather unattractive – on the portal's model the upside to fair value is minus 53%. Our view: the share is rather unattractive at the current price; upside on the portal model -53%.
Our view: is there upside
Our view in numbers
| Metric | Our read |
|---|---|
| Verdict | Rather unattractive |
| Upside on the portal model | -53% |
| How the model works | spot model: EBITDA re-priced to current commodity prices at the target EV/EBITDA, against market cap |
| Net debt / EBITDA | -0.19 – net cash |
| Strongest case for | Production rose 10.5% quarter on quarter, Bairoil costs fell 30%, and net cash of $4.4 million gives the balance sheet room. |
| Strongest case against | EBITDA is 36.2% below what prices implied because of the discount to WTI and $9.7 million of hedge losses, and the portal's model shows minus 53% upside. |
| What would change the view | The verdict would improve if the realised price moved to WTI (the differential narrowed to zero) with production above 7.4 MBoe per day; it would worsen if WTI fell below $75 or the discount widened further. |
Key takeaways
— WTI rose 31.7% year on year, but revenue fell 22.5% – volumes and the discount outweighed the price
— On our calculation, at prior volumes and costs EBITDA should have been $26.2 million versus the actual $16.7 million
— Production rose 10.5% quarter on quarter but fell year on year – 682 MBoe versus roughly 790 MBoe a year earlier
— The realised price of $75.2 per barrel is 0.88 of average WTI; the discount eats a fifth of revenue
— Hedges cost $9.7 million of realised losses and $24.6 million of unrealised losses, and both sit inside operating income
— Net cash of $4.4 million with net debt/EBITDA of minus 0.19 – the balance sheet is strong, but that reflects a low base, not profit
— EV/EBITDA of 7.1 against minus 53% upside on the portal's model – the market has already priced in a recovery the report does not show
Key figures, USD bn
| Metric | Q3 2025 | Q3 2026 | Change |
|---|---|---|---|
| Revenue | 0.07 | 0.05 | -22.5% |
| EBITDA | 0.01 | 0.02 | +31.8% |
| Operating profit | -0.03 | 0.01 | to profit |
| Net profit | -0.02 | -0.02 | — |
| Operating cash flow | 0.01 | 0.00 | -77.3% |
| Capex | 0.03 | -0.01 | -131.5% |
| EBITDA margin | 19.1% | 32.4% | +13.3 pp |
| Net margin | -31.6% | -36.7% | -5.1 pp |
WTI rose 31.7% year on year, but revenue fell 22.5% – volumes and the discount outweighed the price
Average WTI in the third quarter of 2026 was $85.4 per barrel versus $64.9 a year earlier, up 31.7%. Against the previous quarter the price fell 7.9%, from $92.8. Spot on November 11 is $86.5, just 1.3% above the period average, so the quarter's price window has already closed.
Revenue nevertheless came in at $51.4 million, 22.5% below a year earlier, and the pace of decline barely changed from the second quarter (-22.9%). The price rose while revenue fell because the company does not sell at WTI: the average realised price before hedges was $75.2 per barrel, or 0.88 of the benchmark. A 12% discount to WTI at $85 is about $10 per barrel of forgone revenue.
The second factor is volume. Production in the quarter was 682 MBoe, or 7.4 MBoe per day, versus roughly 790 MBoe a year earlier. The company attributes the 10.5% quarter-on-quarter increase to development at Beta and lower costs at Bairoil, but the year-on-year volume is still lower.
Commodity prices: period average and now
| Benchmark | Year ago | Q3 2026 | YoY | Spot 2026-11-11 |
|---|---|---|---|---|
| WTI, USD | 64,9 | 85,4 | +31,7% | 86,5 |
| Henry Hub, USD | 3,08 | 2,89 | -6,2% | 3,30 |
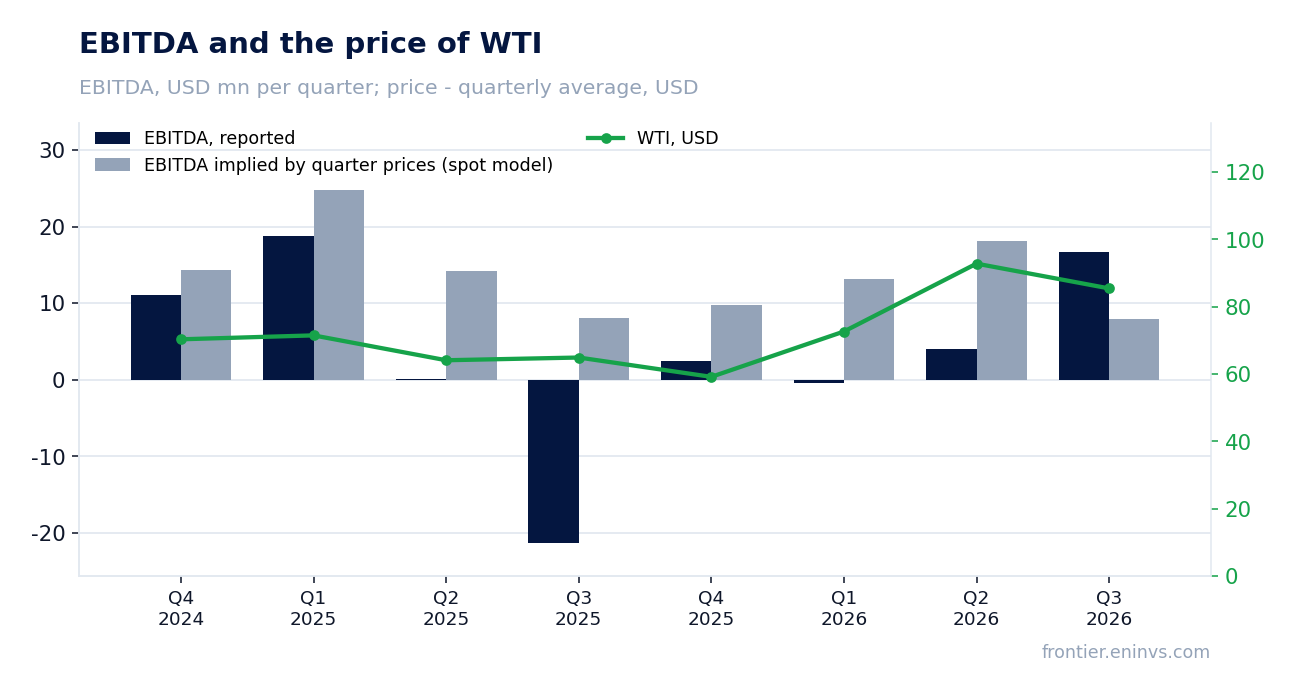
On our calculation, at prior volumes and costs EBITDA should have been $26.2 million versus the actual $16.7 million
Holding third-quarter 2025 volumes and non-commodity costs and moving only prices to the reported period, revenue would have been $79.9 million (a price effect of +$13.5 million, or +20.3%) and EBITDA $26.2 million. Actual results were $51.4 million and $16.7 million: $28.4 million and $9.5 million lower, meaning EBITDA missed the price-implied level by 36.2%.
The gap has three causes named in the facts and the release. First, volume: production is lower year on year, which subtracts directly from revenue. Second, the discount to the benchmark: a realised price of $75.2 against average WTI of $85.4. Third, hedges: realised losses on commodity derivatives were $9.7 million and, per the release, are presented within costs and expenses, i.e. they reduce operating income and our EBITDA.
The portal's spot model, re-priced from the average of the previous four quarters, expected EBITDA of $7.9 million and revenue of $57.9 million; actual EBITDA of $16.7 million is 110.8% above the model while revenue is 11.1% below. That model tracks the run-rate and here disagrees with the year-ago calculation, so it should not be used as the yardstick for what the company should have earned.
What the prices implied and what the company earned
| Base (Q3 2025) | Implied at period prices | Reported | Reported vs implied | |
|---|---|---|---|---|
| Revenue, USD mn | 66,4 | 79,9 | 51,4 | -35,6% |
| EBITDA, USD mn | 12,7 | 26,2 | 16,7 | -36,2% |
| EBITDA, portal spot model, USD mn | — | 7,90 | 16,7 | +110,8% |
Revenue and EBITDA by quarter
| Period | Measure | bn USD |
|---|---|---|
| Q4 2024 | Revenue | 0.069 |
| Q1 2025 | Revenue | 0.07205 |
| Q2 2025 | Revenue | 0.068361 |
| Q3 2025 | Revenue | 0.066396 |
| Q4 2025 | Revenue | 0.056554 |
| Q1 2026 | Revenue | 0.037464 |
| Q2 2026 | Revenue | 0.052686 |
| Q3 2026 | Revenue | 0.051438000000000005 |
| Q4 2024 | EBITDA | 0.011072999999999998 |
| Q1 2025 | EBITDA | 0.018817 |
| Q2 2025 | EBITDA | 0.00016200000000000082 |
| Q3 2025 | EBITDA | −0.021335 |
| Q4 2025 | EBITDA | 0.002509 |
| Q1 2026 | EBITDA | −0.0003659999999999997 |
| Q2 2026 | EBITDA | 0.0039640000000000005 |
| Q3 2026 | EBITDA | 0.016690999999999998 |
EBITDA margin
| Period | Measure | % |
|---|---|---|
| Q4 2024 | EBITDA margin | 16.0 |
| Q1 2025 | EBITDA margin | 26.1 |
| Q2 2025 | EBITDA margin | 0.2 |
| Q3 2025 | EBITDA margin | −32.1 |
| Q4 2025 | EBITDA margin | 4.4 |
| Q1 2026 | EBITDA margin | −1.0 |
| Q2 2026 | EBITDA margin | 7.5 |
| Q3 2026 | EBITDA margin | 32.4 |
Production rose 10.5% quarter on quarter but fell year on year – 682 MBoe versus roughly 790 MBoe a year earlier
Production in the reported quarter was 682 MBoe, or 7.4 MBoe per day, versus 617 MBoe and 6.8 MBoe per day a quarter earlier (+10.5% and +8.8%). The entire volume is oil: gas and NGL are absent from the sales mix. Both assets drove the quarter-on-quarter increase: Beta added 12.5% (414 MBoe versus 368) and Bairoil 8.5% (268 MBoe versus 247).
The company attributes the growth to development at Beta – the C29 and C16 wells completed in June and July produced about 380 and 360 barrels per day each – and to lower costs at Bairoil. Full-year 2026 production guidance was tightened at the top: 7.0–7.3 MBbls/d versus the previous 7.0–7.5. That implies the fourth quarter should not lift the year above the current run-rate.
Year on year, volume is still lower: 682 MBoe versus roughly 790 MBoe in the third quarter of 2025. That, not the price, explains the revenue decline against a rising oil price.
Production, realised price and unit cost (company release)
| Metric | Year ago | Reported period | YoY |
|---|---|---|---|
| Total production, MBoe | — | 682,00 | — |
| Total production per day, MBoe/d | — | 7,40 | — |
| Oil average sales price exclusive of realized derivatives (before hedges), $/Bbl | — | 75,19 | — |
| Oil average sales price inclusive of realized derivatives (after hedges), $/Bbl | — | 60,91 | — |
| Total average sales price excluding commodity derivatives (before hedges), $/Boe | — | 75,19 | — |
| Lease operating expense per Boe, $/Boe | — | 33,26 | — |
| Gathering, processing and transportation per Boe, $/Boe | — | 1,52 | — |
| Taxes other than income per Boe, $/Boe | — | 4,63 | — |
| General and administrative expense per Boe, $/Boe | — | 9,14 | — |
| Depletion, depreciation and amortization per Boe, $/Boe | — | 8,20 | — |
The realised price of $75.2 per barrel is 0.88 of average WTI; the discount eats a fifth of revenue
The average realised price before hedges was $75.2 per barrel; including realised hedges it was $60.9. Average Brent in the quarter was $91.22 and WTI $85.79 per the release, so the discount to WTI is about 12%.
The company attributes the pricing pressure to shrinking refining capacity in California, which has reduced outlets for local crude. The release says fourth-quarter differentials have improved and guidance for the oil differential was narrowed to minus $8–10 per barrel from minus $9–11. That is an improvement, but it recovers only part of what was lost.
The price before hedges is not the whole economics. Realised losses on commodity derivatives of $9.7 million are about $14.3 per barrel, and they turn $75.2 into $60.9. Hedges protect cash flow, but in the reported quarter they were expensive.
Hedges cost $9.7 million of realised losses and $24.6 million of unrealised losses, and both sit inside operating income
In the third quarter the company recorded $9.7 million of realised losses on commodity derivatives and $24.6 million of unrealised losses. Per the release, both lines are presented within costs and expenses, i.e. inside operating income. That means our EBITDA of $16.7 million is already reduced by the $9.7 million realised loss; without it, EBITDA would be about $26.4 million.
The $24.6 million unrealised loss is the main cause of the $18.9 million net loss. The company itself calls it non-cash and uses it to explain the swing from $17.3 million of net income in the previous quarter to a loss. Adjusted net income, per the release, was $0.7 million – what remains after excluding the unrealised loss and other one-off items.
The one-offs are comparable in size to the result itself: the $24.6 million unrealised loss exceeds the $18.9 million net loss, and the $9.7 million realised loss is 58% of EBITDA. Without the hedge losses the picture would look markedly better, but hedges are part of the business model, not an anomaly.
Net cash of $4.4 million with net debt/EBITDA of minus 0.19 – the balance sheet is strong, but that reflects a low base, not profit
As of September 30, 2026, the company had no outstanding debt under its revolving credit facility and liquidity of $25.0 million – $10.0 million of cash and about $15.0 million of available borrowing capacity. Net cash was $4.4 million and net debt/EBITDA for the trailing twelve months was minus 0.19. The company expects to exit 2026 with a strengthened balance sheet and a net cash position.
Operating cash flow in the quarter was $3.1 million and capital investment $8.0 million per the release (the facts show minus $8.6 million on a different basis). Free cash flow per the release was $2.0 million. That covers debt service but not growth: capital went mainly to Beta ($7.3 million of the $8.0 million).
A net debt/EBITDA of minus 0.19 looks like an absence of debt, but it is arithmetic on a low base: trailing-twelve-month EBITDA is $23.0 million and has been compressed by weak quarters. The facts do not disclose the direction of this ratio, so one cannot speak of leverage rising or falling – only of its current level.
Share price, three years
close, last point 2026-11-10
| Period | Measure | USD per share |
|---|---|---|
| 2025-11-10 | Closing price | 5.690000057220459 |
| 2025-11-11 | Closing price | 5.860000133514404 |
| 2025-11-12 | Closing price | 5.78000020980835 |
| 2025-11-13 | Closing price | 5.630000114440918 |
| 2025-11-14 | Closing price | 5.769999980926514 |
| 2025-11-17 | Closing price | 5.289999961853027 |
| 2025-11-18 | Closing price | 5.5 |
| 2025-11-19 | Closing price | 5.300000190734863 |
| 2025-11-20 | Closing price | 5.289999961853027 |
| 2025-11-21 | Closing price | 5.320000171661377 |
| 2025-11-24 | Closing price | 5.429999828338623 |
| 2025-11-25 | Closing price | 5.239999771118164 |
| 2025-11-26 | Closing price | 5.300000190734863 |
| 2025-11-28 | Closing price | 5.5 |
| 2025-12-01 | Closing price | 5.789999961853027 |
| 2025-12-02 | Closing price | 5.639999866485596 |
| 2025-12-03 | Closing price | 5.789999961853027 |
| 2025-12-04 | Closing price | 5.670000076293945 |
| 2025-12-05 | Closing price | 5.559999942779541 |
| 2025-12-08 | Closing price | 5.21999979019165 |
| 2025-12-09 | Closing price | 5.360000133514404 |
| 2025-12-10 | Closing price | 5.199999809265137 |
| 2025-12-11 | Closing price | 5.03000020980835 |
| 2025-12-12 | Closing price | 4.849999904632568 |
| 2025-12-15 | Closing price | 4.710000038146973 |
| 2025-12-16 | Closing price | 4.590000152587891 |
| 2025-12-17 | Closing price | 4.690000057220459 |
| 2025-12-18 | Closing price | 4.590000152587891 |
| 2025-12-19 | Closing price | 4.75 |
| 2025-12-22 | Closing price | 4.789999961853027 |
| 2025-12-23 | Closing price | 4.809999942779541 |
| 2025-12-24 | Closing price | 4.710000038146973 |
| 2025-12-26 | Closing price | 4.559999942779541 |
| 2025-12-29 | Closing price | 4.639999866485596 |
| 2025-12-30 | Closing price | 4.630000114440918 |
| 2025-12-31 | Closing price | 4.570000171661377 |
| 2026-01-02 | Closing price | 4.630000114440918 |
| 2026-01-05 | Closing price | 4.5 |
| 2026-01-06 | Closing price | 4.550000190734863 |
| 2026-01-07 | Closing price | 4.380000114440918 |
| 2026-01-08 | Closing price | 4.579999923706055 |
| 2026-01-09 | Closing price | 4.590000152587891 |
| 2026-01-12 | Closing price | 4.659999847412109 |
| 2026-01-13 | Closing price | 4.829999923706055 |
| 2026-01-14 | Closing price | 4.96999979019165 |
| 2026-01-15 | Closing price | 4.800000190734863 |
| 2026-01-16 | Closing price | 4.78000020980835 |
| 2026-01-20 | Closing price | 4.650000095367432 |
| 2026-01-21 | Closing price | 4.769999980926514 |
| 2026-01-22 | Closing price | 4.619999885559082 |
| 2026-01-23 | Closing price | 4.710000038146973 |
| 2026-01-26 | Closing price | 4.659999847412109 |
| 2026-01-27 | Closing price | 4.78000020980835 |
| 2026-01-28 | Closing price | 4.829999923706055 |
| 2026-01-29 | Closing price | 5.03000020980835 |
| 2026-01-30 | Closing price | 5.019999980926514 |
| 2026-02-02 | Closing price | 4.78000020980835 |
| 2026-02-03 | Closing price | 4.96999979019165 |
| 2026-02-04 | Closing price | 5.010000228881836 |
| 2026-02-05 | Closing price | 4.849999904632568 |
| 2026-02-06 | Closing price | 5.179999828338623 |
| 2026-02-09 | Closing price | 5.300000190734863 |
| 2026-02-10 | Closing price | 5.389999866485596 |
| 2026-02-11 | Closing price | 5.630000114440918 |
| 2026-02-12 | Closing price | 5.300000190734863 |
| 2026-02-13 | Closing price | 5.420000076293945 |
| 2026-02-17 | Closing price | 5.170000076293945 |
| 2026-02-18 | Closing price | 5.369999885559082 |
| 2026-02-19 | Closing price | 5.630000114440918 |
| 2026-02-20 | Closing price | 5.710000038146973 |
| 2026-02-23 | Closing price | 5.539999961853027 |
| 2026-02-24 | Closing price | 5.460000038146973 |
| 2026-02-25 | Closing price | 5.489999771118164 |
| 2026-02-26 | Closing price | 5.5 |
| 2026-02-27 | Closing price | 5.739999771118164 |
| 2026-03-02 | Closing price | 5.909999847412109 |
| 2026-03-03 | Closing price | 5.829999923706055 |
| 2026-03-04 | Closing price | 6.039999961853027 |
| 2026-03-05 | Closing price | 6.0 |
| 2026-03-06 | Closing price | 6.099999904632568 |
| 2026-03-09 | Closing price | 5.900000095367432 |
| 2026-03-10 | Closing price | 5.110000133514404 |
| 2026-03-11 | Closing price | 5.570000171661377 |
| 2026-03-12 | Closing price | 6.059999942779541 |
| 2026-03-13 | Closing price | 6.539999961853027 |
| 2026-03-16 | Closing price | 6.28000020980835 |
| 2026-03-17 | Closing price | 6.179999828338623 |
| 2026-03-18 | Closing price | 6.300000190734863 |
| 2026-03-19 | Closing price | 6.320000171661377 |
| 2026-03-20 | Closing price | 6.519999980926514 |
| 2026-03-23 | Closing price | 6.289999961853027 |
| 2026-03-24 | Closing price | 6.590000152587891 |
| 2026-03-25 | Closing price | 6.519999980926514 |
| 2026-03-26 | Closing price | 6.630000114440918 |
| 2026-03-27 | Closing price | 6.559999942779541 |
| 2026-03-30 | Closing price | 6.409999847412109 |
| 2026-03-31 | Closing price | 6.239999771118164 |
| 2026-04-01 | Closing price | 5.869999885559082 |
| 2026-04-02 | Closing price | 5.980000019073486 |
| 2026-04-06 | Closing price | 6.190000057220459 |
| 2026-04-07 | Closing price | 6.21999979019165 |
| 2026-04-08 | Closing price | 5.880000114440918 |
| 2026-04-09 | Closing price | 5.809999942779541 |
| 2026-04-10 | Closing price | 6.090000152587891 |
| 2026-04-13 | Closing price | 5.880000114440918 |
| 2026-04-14 | Closing price | 5.5 |
| 2026-04-15 | Closing price | 5.5 |
| 2026-04-16 | Closing price | 5.489999771118164 |
| 2026-04-17 | Closing price | 5.289999961853027 |
| 2026-04-20 | Closing price | 5.349999904632568 |
| 2026-04-21 | Closing price | 5.53000020980835 |
| 2026-04-22 | Closing price | 5.710000038146973 |
| 2026-04-23 | Closing price | 5.889999866485596 |
| 2026-04-24 | Closing price | 5.840000152587891 |
| 2026-04-27 | Closing price | 6.0 |
| 2026-04-28 | Closing price | 6.159999847412109 |
| 2026-04-29 | Closing price | 6.400000095367432 |
| 2026-04-30 | Closing price | 6.400000095367432 |
| 2026-05-01 | Closing price | 6.210000038146973 |
| 2026-05-04 | Closing price | 6.320000171661377 |
| 2026-05-05 | Closing price | 6.260000228881836 |
| 2026-05-06 | Closing price | 5.539999961853027 |
| 2026-05-07 | Closing price | 5.440000057220459 |
| 2026-05-08 | Closing price | 5.289999961853027 |
| 2026-05-11 | Closing price | 5.480000019073486 |
| 2026-05-12 | Closing price | 5.269999980926514 |
| 2026-05-13 | Closing price | 5.099999904632568 |
| 2026-05-14 | Closing price | 5.099999904632568 |
| 2026-05-15 | Closing price | 5.230000019073486 |
| 2026-05-18 | Closing price | 5.25 |
| 2026-05-19 | Closing price | 5.190000057220459 |
| 2026-05-20 | Closing price | 5.179999828338623 |
| 2026-05-21 | Closing price | 5.050000190734863 |
| 2026-05-22 | Closing price | 5.010000228881836 |
| 2026-05-26 | Closing price | 4.75 |
| 2026-05-27 | Closing price | 4.550000190734863 |
| 2026-05-28 | Closing price | 4.679999828338623 |
| 2026-05-29 | Closing price | 4.630000114440918 |
| 2026-06-01 | Closing price | 4.769999980926514 |
| 2026-06-02 | Closing price | 4.760000228881836 |
| 2026-06-03 | Closing price | 4.690000057220459 |
| 2026-06-04 | Closing price | 4.639999866485596 |
| 2026-06-05 | Closing price | 4.369999885559082 |
| 2026-06-08 | Closing price | 4.550000190734863 |
| 2026-06-09 | Closing price | 4.420000076293945 |
| 2026-06-10 | Closing price | 4.570000171661377 |
| 2026-06-11 | Closing price | 4.380000114440918 |
| 2026-06-12 | Closing price | 4.340000152587891 |
| 2026-06-15 | Closing price | 4.119999885559082 |
| 2026-06-16 | Closing price | 4.079999923706055 |
| 2026-06-17 | Closing price | 4.070000171661377 |
| 2026-06-18 | Closing price | 4.130000114440918 |
| 2026-06-22 | Closing price | 4.039999961853027 |
| 2026-06-23 | Closing price | 3.930000066757202 |
| 2026-06-24 | Closing price | 3.9700000286102295 |
| 2026-06-25 | Closing price | 3.9800000190734863 |
| 2026-06-26 | Closing price | 3.940000057220459 |
| 2026-06-29 | Closing price | 4.03000020980835 |
| 2026-06-30 | Closing price | 3.9800000190734863 |
| 2026-07-01 | Closing price | 3.9600000381469727 |
| 2026-07-02 | Closing price | 4.0 |
| 2026-07-06 | Closing price | 3.859999895095825 |
| 2026-07-07 | Closing price | 3.9800000190734863 |
| 2026-07-08 | Closing price | 4.050000190734863 |
| 2026-07-09 | Closing price | 4.070000171661377 |
| 2026-07-10 | Closing price | 3.940000057220459 |
| 2026-07-13 | Closing price | 4.130000114440918 |
| 2026-07-14 | Closing price | 4.130000114440918 |
| 2026-07-15 | Closing price | 4.0 |
| 2026-07-16 | Closing price | 3.9700000286102295 |
| 2026-07-17 | Closing price | 3.940000057220459 |
| 2026-07-20 | Closing price | 3.930000066757202 |
| 2026-07-21 | Closing price | 4.03000020980835 |
| 2026-07-22 | Closing price | 4.099999904632568 |
| 2026-07-23 | Closing price | 4.130000114440918 |
| 2026-07-24 | Closing price | 3.940000057220459 |
| 2026-07-27 | Closing price | 3.75 |
| 2026-07-28 | Closing price | 3.6700000762939453 |
| 2026-07-29 | Closing price | 3.819999933242798 |
| 2026-07-30 | Closing price | 3.75 |
| 2026-07-31 | Closing price | 3.9100000858306885 |
| 2026-08-03 | Closing price | 4.010000228881836 |
| 2026-08-04 | Closing price | 3.9800000190734863 |
| 2026-08-05 | Closing price | 3.880000114440918 |
| 2026-08-06 | Closing price | 4.079999923706055 |
| 2026-08-07 | Closing price | 4.03000020980835 |
| 2026-08-10 | Closing price | 4.159999847412109 |
| 2026-08-11 | Closing price | 4.510000228881836 |
| 2026-08-12 | Closing price | 4.389999866485596 |
| 2026-08-13 | Closing price | 4.829999923706055 |
| 2026-08-14 | Closing price | 4.78000020980835 |
| 2026-08-17 | Closing price | 4.820000171661377 |
| 2026-08-18 | Closing price | 4.820000171661377 |
| 2026-08-19 | Closing price | 4.789999961853027 |
| 2026-08-20 | Closing price | 4.909999847412109 |
| 2026-08-21 | Closing price | 4.820000171661377 |
| 2026-08-24 | Closing price | 4.78000020980835 |
| 2026-08-25 | Closing price | 4.670000076293945 |
| 2026-08-26 | Closing price | 4.579999923706055 |
| 2026-08-27 | Closing price | 4.710000038146973 |
| 2026-08-28 | Closing price | 4.760000228881836 |
| 2026-08-31 | Closing price | 4.920000076293945 |
| 2026-09-01 | Closing price | 4.989999771118164 |
| 2026-09-02 | Closing price | 5.0 |
| 2026-09-03 | Closing price | 4.900000095367432 |
| 2026-09-04 | Closing price | 4.900000095367432 |
| 2026-09-08 | Closing price | 4.940000057220459 |
| 2026-09-09 | Closing price | 4.920000076293945 |
| 2026-09-10 | Closing price | 4.960000038146973 |
| 2026-09-11 | Closing price | 4.929999828338623 |
| 2026-09-14 | Closing price | 4.809999942779541 |
| 2026-09-15 | Closing price | 4.929999828338623 |
| 2026-09-16 | Closing price | 4.559999942779541 |
| 2026-09-17 | Closing price | 4.559999942779541 |
| 2026-09-18 | Closing price | 4.5 |
| 2026-09-21 | Closing price | 4.309999942779541 |
| 2026-09-22 | Closing price | 4.230000019073486 |
| 2026-09-23 | Closing price | 4.230000019073486 |
| 2026-09-24 | Closing price | 4.340000152587891 |
| 2026-09-25 | Closing price | 4.28000020980835 |
| 2026-09-28 | Closing price | 4.190000057220459 |
| 2026-09-29 | Closing price | 4.150000095367432 |
| 2026-09-30 | Closing price | 4.210000038146973 |
| 2026-10-01 | Closing price | 4.380000114440918 |
| 2026-10-02 | Closing price | 4.360000133514404 |
| 2026-10-05 | Closing price | 4.429999828338623 |
| 2026-10-06 | Closing price | 4.480000019073486 |
| 2026-10-07 | Closing price | 4.460000038146973 |
| 2026-10-08 | Closing price | 4.579999923706055 |
| 2026-10-09 | Closing price | 4.460000038146973 |
| 2026-10-12 | Closing price | 4.510000228881836 |
| 2026-10-13 | Closing price | 4.610000133514404 |
| 2026-10-14 | Closing price | 4.340000152587891 |
| 2026-10-15 | Closing price | 4.349999904632568 |
| 2026-10-16 | Closing price | 4.429999828338623 |
| 2026-10-19 | Closing price | 4.53000020980835 |
| 2026-10-20 | Closing price | 4.510000228881836 |
| 2026-10-21 | Closing price | 4.489999771118164 |
| 2026-10-22 | Closing price | 4.429999828338623 |
| 2026-10-23 | Closing price | 4.590000152587891 |
| 2026-10-26 | Closing price | 4.449999809265137 |
| 2026-10-27 | Closing price | 4.320000171661377 |
| 2026-10-28 | Closing price | 4.389999866485596 |
| 2026-10-29 | Closing price | 4.329999923706055 |
| 2026-10-30 | Closing price | 4.269999980926514 |
| 2026-11-02 | Closing price | 3.8399999141693115 |
| 2026-11-03 | Closing price | 3.759999990463257 |
| 2026-11-04 | Closing price | 3.4800000190734863 |
| 2026-11-05 | Closing price | 3.180000066757202 |
| 2026-11-06 | Closing price | 3.3299999237060547 |
| 2026-11-09 | Closing price | 3.200000047683716 |
| 2026-11-10 | Closing price | 3.505000114440918 |
EV/EBITDA of 7.1 against minus 53% upside on the portal's model – the market has already priced in a recovery the report does not show
Market capitalisation on November 10 was $140.2 million, EV/EBITDA for the trailing twelve months 7.1 and P/E 5.7. The latter is misleading: trailing-twelve-month profit of $24.7 million includes quarters with one-off items, notably $64.4 million of net income in the fourth quarter of 2025, so P/E understates what the business can earn at current prices.
The portal's spot model re-prices EBITDA to current commodity prices at the target EV/EBITDA; against market capitalisation it gives minus 53% upside to fair value. This is our own estimate, not a consensus. Spot WTI on November 11 is $86.5 and Henry Hub $3.3; at such prices EBITDA is unlikely to exceed the trailing-twelve-month level materially.
The share closed at $3.33 before the release, fell 3.9% on the release day and has risen 5.3% from the release to November 10. The market reacted to the one-off nature of the loss but has not re-rated the discount to WTI or the cost of hedges. At EV/EBITDA of 7.1 and negative model upside there is no margin of safety.
Valuation on the latest reported figures
| Metric | Value |
|---|---|
| Market cap | 0.14 bn USD |
| P/E (LTM) | 5.7 |
| EV/EBITDA (LTM) | 7.1 |
| P/B | 0.34 |
| Net debt / EBITDA (LTM) | -0.19 |
| ROE | -17.6% |
Net profit by quarter
| Period | Measure | bn USD |
|---|---|---|
| Q4 2024 | Net profit | −0.007429 |
| Q1 2025 | Net profit | −0.005861 |
| Q2 2025 | Net profit | 0.006384 |
| Q3 2025 | Net profit | −0.020966000000000002 |
| Q4 2025 | Net profit | 0.064411 |
| Q1 2026 | Net profit | −0.038116 |
| Q2 2026 | Net profit | 0.017299 |
| Q3 2026 | Net profit | −0.018859 |
Bottom line
The strong point of the report was production: +10.5% quarter on quarter, growth at both assets and lower costs at Bairoil. But year-on-year volume is lower, the discount to WTI eats about 12% of the price, and hedges cost $9.7 million of realised losses – together that left EBITDA 36.2% below what prices implied. The $18.9 million net loss is almost entirely explained by the $24.6 million unrealised loss on derivatives, a one-off, non-cash item. The question for a holder now is not the balance sheet – net cash of $4.4 million – but whether the company can sell oil closer to WTI and hold production. Our conclusion: rather unattractive – on the portal's model the upside to fair value is minus 53%. Our view: the share is rather unattractive at the current price; upside on the portal model -53%.