Alpha Metallurgical Resources: revenue accelerated to +6.4% but EBITDA fell 28.9% – higher volumes did not offset weaker pricing
On October 23 Alpha Metallurgical Resources released preliminary third-quarter 2026 results. Revenue came in at $560.6 million, up 6.4% year on year after a 10.7% decline in the prior quarter, adjusted EBITDA was $29.4 million (–28.9% year on year) and the net loss was $9.3 million. Higher volumes of 3.9 million tons did not offset weaker realizations, and at an EV/EBITDA of about 4.6 against its own three-year average the share looks neutral: the discount to history is balanced by margin compression and a net loss.
Key takeaways
— Revenue accelerated to +6.4% year on year, and it is held up by 3.9 million tons of volume, not by price
— EBITDA fell 28.9% despite higher revenue because a realization of $121.09 per ton does not cover costs
— The $9.3 million net loss comes from weak gross margin, not from one-off write-downs
— There is almost no debt: $10.6 million of borrowings against $334.1 million of cash
— $1.2 billion of buybacks out of a $1.5 billion programme supported the equity, not the earnings
— At 4.6 EV/EBITDA the stock is below its own three-year average, but the portal model shows –52% to fair value
Attractiveness
Key figures, USD bn
| Metric | Q3 2025 | Q3 2026 | Change |
|---|---|---|---|
| Revenue | 0.53 | 0.56 | +6.4% |
| EBITDA | 0.04 | 0.03 | -28.9% |
| Operating profit | -0.00 | — | — |
| Net profit | -0.01 | -0.01 | — |
| Operating cash flow | 0.05 | — | — |
| Capex | 0.03 | — | — |
| EBITDA margin | 7.9% | 5.2% | -2.7 pp |
| Net margin | -1.0% | -1.7% | -0.7 pp |
Revenue accelerated to +6.4% year on year, and it is held up by 3.9 million tons of volume, not by price
In the third quarter of 2026 revenue was $560.6 million, 6.4% more than a year earlier. This is a reversal after a 10.7% decline in the second quarter: growth accelerated, and it is the first positive year-on-year quarter since early 2025.
The increase came from volume: met-segment sales reached 3.9 million tons, of which 3.6 million tons were metallurgical coal and 0.3 million tons thermal coal. Average realization was $121.09 per ton, and that, not volume, remains the weak spot: revenue excluding freight and handling was $474.1 million.
The sales mix shows that 51% of met coal went through other pricing mechanisms at an average of $107.03 per ton, while Australian-indexed exports fetched $150.46 and domestic sales $136.17. The higher the share of other contracts, the more revenue depends on spot prices, which were low in the reported quarter.
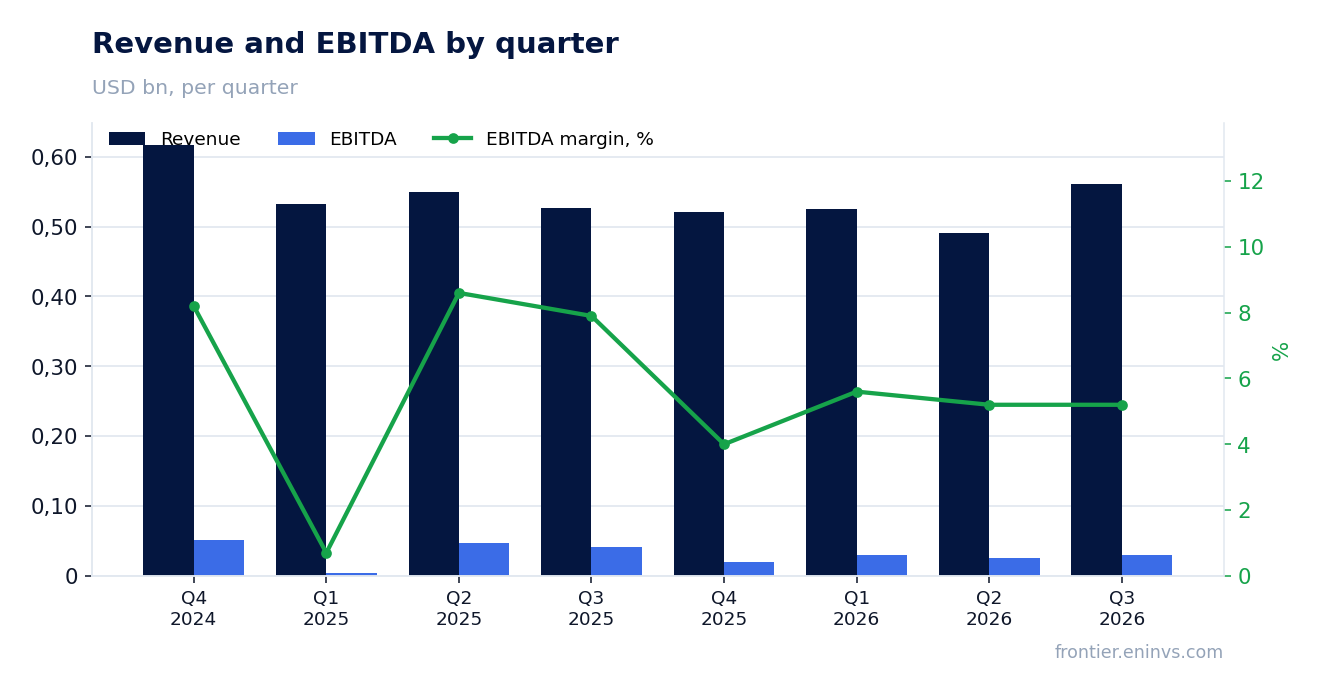
EBITDA fell 28.9% despite higher revenue because a realization of $121.09 per ton does not cover costs
Adjusted EBITDA in the third quarter of 2026 was $29.4 million against $41.4 million a year earlier – a 28.9% decline. The EBITDA margin compressed to 5.2% from 7.9% a year earlier: revenue grew, but each dollar of sales brings less operating profit.
The reason is costs. Met-segment cost of coal sales excluding freight and idle costs was $418.6 million, or $106.93 per ton, against a realization of $121.09. The $14.16 per ton gap is the entire negative margin, which after depreciation, accretion and amortization of intangibles turns into a loss.
GAAP coal margin was only $9.6 million, or $2.45 per ton. Management explicitly points to continued cost pressure: "stronger volumes than in the first half but continued cost pressure." This is not a one-off but a structural problem at the current level of met coal prices.
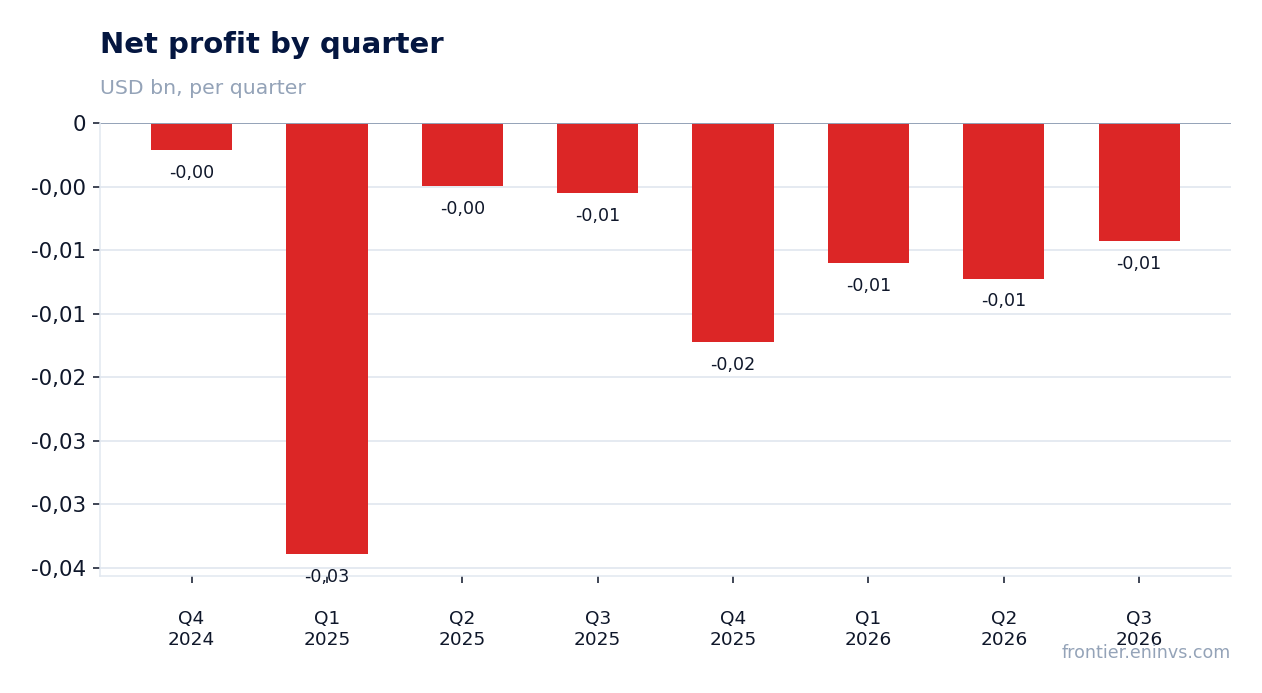
The $9.3 million net loss comes from weak gross margin, not from one-off write-downs
The net loss in the third quarter of 2026 was $9.3 million, or $0.73 per diluted share. A year earlier the loss was $5.5 million: a deterioration of $3.8 million despite 6.4% revenue growth.
The EBITDA reconciliation shows the loss is operational: interest expense was only $1.0 million, interest income $2.6 million and the tax benefit $5.7 million. Without the tax benefit the loss would have been almost twice as large. Depreciation of $35.5 million and accretion of $5.2 million are non-cash items, but they reflect the capital intensity of mining.
The net margin was –1.7% against –1.0% a year earlier. The loss is not tied to one-off write-downs or impairments: it is a direct consequence of realization barely covering cost. A return to profit requires either higher met coal prices or lower unit costs.
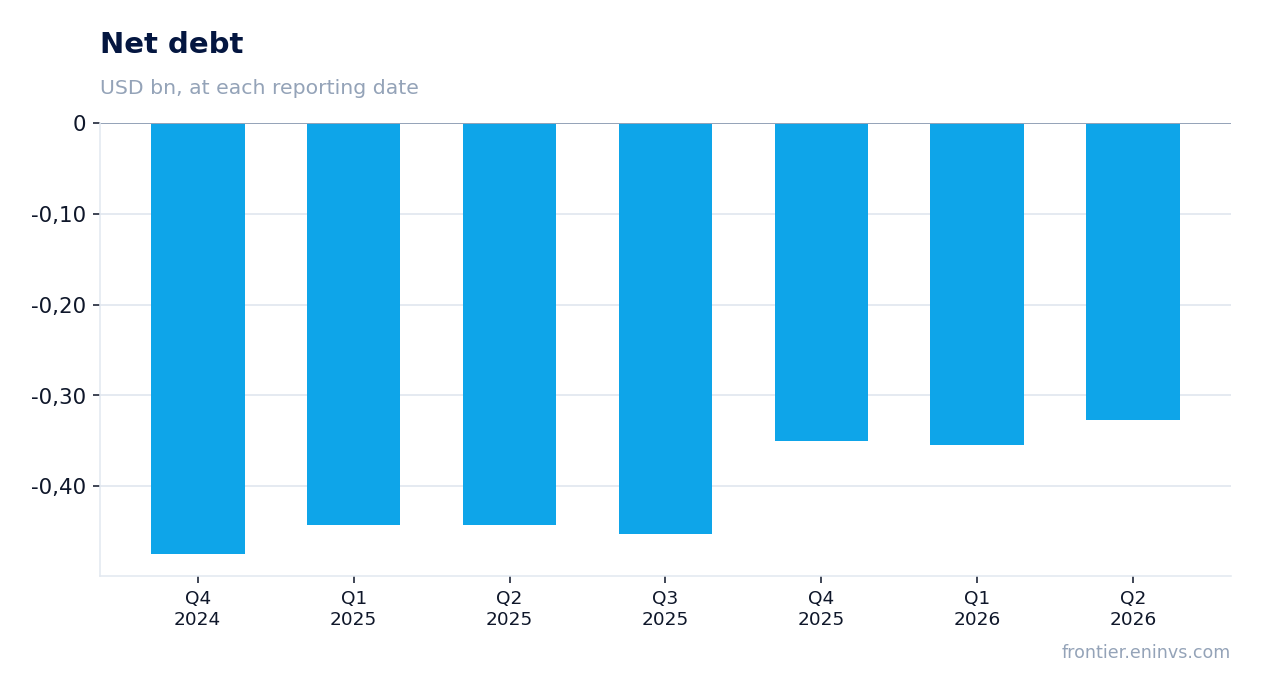
There is almost no debt: $10.6 million of borrowings against $334.1 million of cash
As of September 30, 2026 total liquidity was $443.4 million, including $334.1 million of cash and $184.3 million of unused availability under the ABL facility, partly offset by a $75.0 million minimum liquidity requirement. Total long-term debt including the current portion was only $10.6 million, there were no ABL borrowings and $40.7 million of letters of credit outstanding.
Net debt on the latest annual balance sheet was –$350.8 million, meaning the company has a net cash position. This matters for valuation: with a market cap of $30.7 million and negative net debt, an EV/EBITDA of about 4.6 reflects a low EBITDA base rather than leverage.
Operating cash flow for the third quarter is not disclosed in the release, but in the second quarter of 2026 it was $39.9 million against $45.1 million of capex. Negative free cash flow at these prices is the main risk to further buybacks.
$1.2 billion of buybacks out of a $1.5 billion programme supported the equity, not the earnings
Since the start of the buyback programme the company has repurchased about 7.1 million shares for about $1.2 billion out of the authorised $1.5 billion. In the third quarter of 2026 buybacks were minimal: $3.0 million for roughly 18,000 shares. Shares outstanding as of September 30, 2026 were 12,667,855.
Buybacks reduced the share count and supported the market cap but did not change the operating picture: a loss of $0.73 per share on 12.7 million shares means there is no profit even after shrinking the base. At the current free cash flow the programme may slow.
For a shareholder this means the main return of capital comes through buybacks rather than dividends. There is no dividend line in the facts, and the release does not mention dividends.
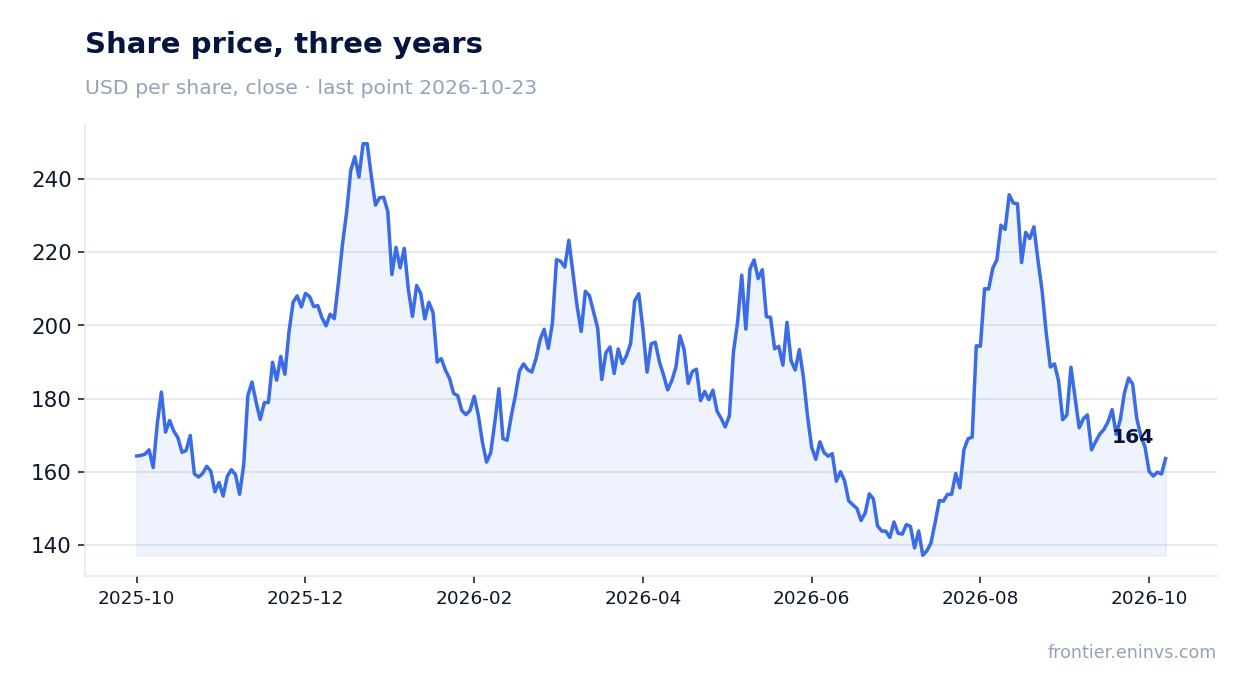
At 4.6 EV/EBITDA the stock is below its own three-year average, but the portal model shows –52% to fair value
The current EV/EBITDA of about 4.6 matches its own three-year average of 4.63, meaning the stock trades roughly at its historical level rather than at a discount. With a market cap of $30.7 million and negative net debt, the multiple reflects a low EBITDA base rather than a cheap valuation.
The portal model, which re-prices EBITDA at current commodity prices at the target EV/EBITDA, shows –52% upside to fair value. This means that even accounting for the low base, the market values the share above what the model implies at current met coal prices.
The share price before the release was $159.39, rose 2.6% on the release day and has held that level since. The market reaction to the loss was muted, but there is no sustained growth. A re-rating requires either a reversal in met coal prices or confirmed cost reduction.
Valuation on the latest reported figures
| Metric | Value |
|---|---|
| Market cap | 0.03 bn USD |
| ROE | -3.3% |
Bottom line
What was strong in the report was volume growth and revenue acceleration to +6.4% year on year, plus the near-absence of debt with $334.1 million of cash. What was weak was the operating economics: EBITDA fell 28.9%, the margin compressed to 5.2%, and the $9.3 million net loss contains no one-off write-downs and reflects a fundamental mismatch between prices and costs. $1.2 billion of buybacks supported the equity but not the earnings. The question for a holder now is when met coal prices will turn: until then, a 4.6 EV/EBITDA multiple with the portal model at –52% does not offer enough cushion. Verdict – neutral.
Open the company's financial profile AMR →
See also: market overview · valuation map · stock screeners