Aemetis: a $24.7m tax credit made the quarter profitable, but without it EBITDA would be a third as large
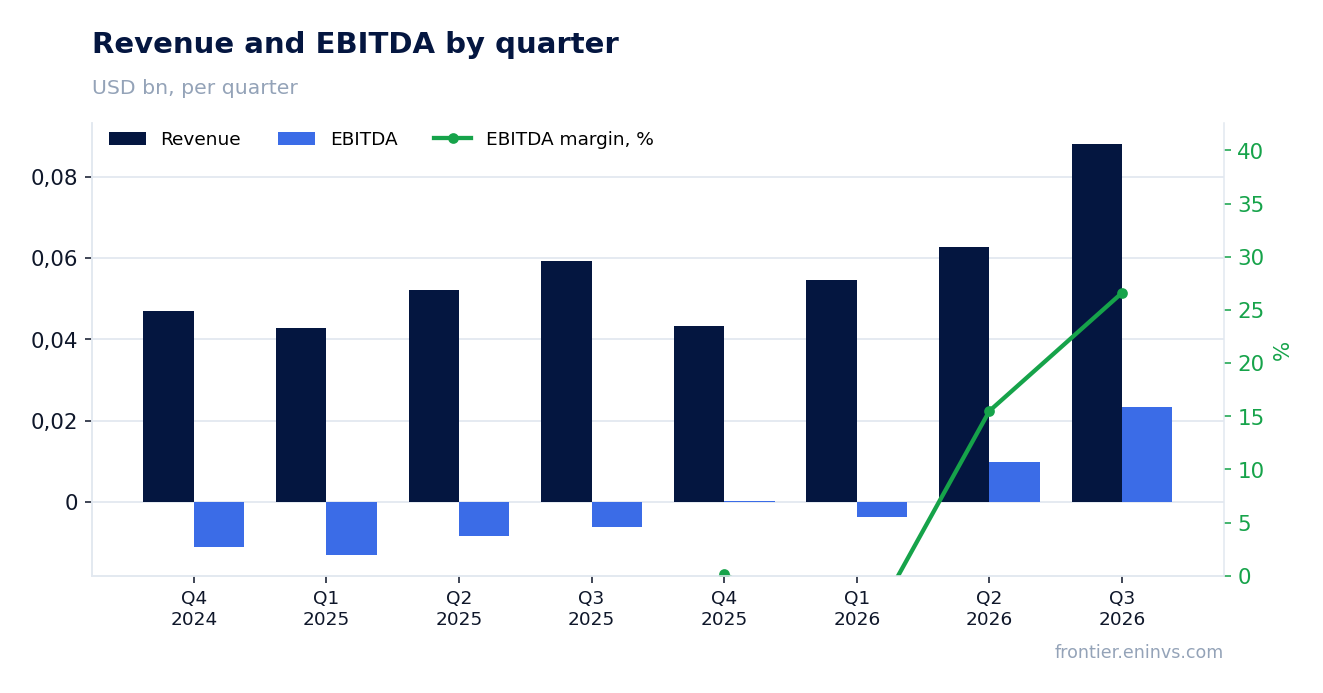
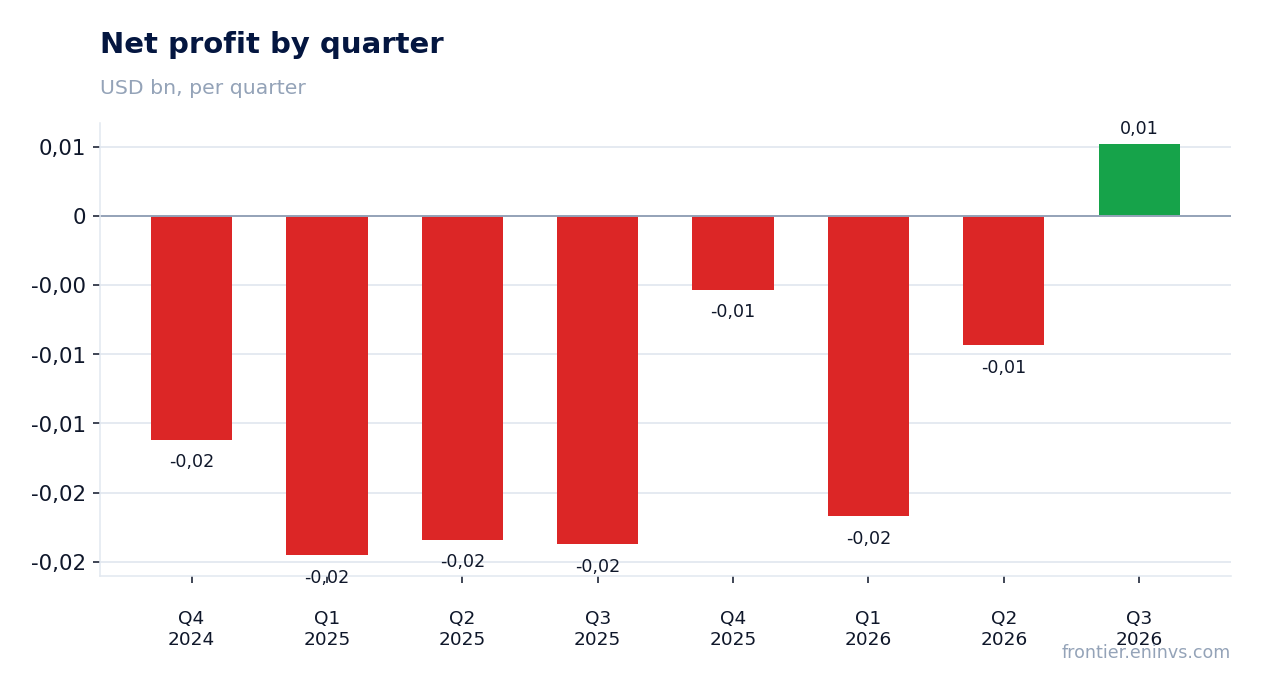
On 5 November Aemetis reported third-quarter 2026 results. Revenue was $88.2m, up 48.9% from $59.2m a year earlier, EBITDA was $23.4m against minus $6.2m, and net profit was $5.2m. Brent averaged $91.3 in the quarter versus $68 a year earlier, and at the year-ago volumes and costs our calculation implies EBITDA of $6.0m; the actual $23.4m is explained not by the oil price but by $24.7m of Section 45Z income, of which about $11.0m is a one-off true-up for the first half. At 19.1x LTM EV/EBITDA and 16.6x net debt to LTM EBITDA the share looks expensive, hence the verdict of rather_unattractive.
Key takeaways
— Brent rose 34.2% year on year, but our calculation says that alone would have produced only $6.0m of EBITDA
— The gap between the implied $6.0m and the actual $23.4m came from $24.7m of Section 45Z income, of which about $11.0m is a one-off true-up
— Volumes grew across every line, most strongly RNG by 38.8% and RINs by 34.4%
— Corn rose 5.7% to $6.29 per bushel, eating into ethanol margin
— Interest of $15.8m absorbed almost all of the $20.9m operating result
— Operating cash flow of $22.0m went almost entirely into $20.2m of capex
— At today's prices EBITDA is estimated at $50.4m, which brings EV/EBITDA down to 11.2x
Attractiveness
Key figures, USD bn
| Metric | Q3 2025 | Q3 2026 | Change |
|---|---|---|---|
| Revenue | 0.06 | 0.09 | +48.9% |
| EBITDA | -0.01 | 0.02 | to profit |
| Operating profit | -0.01 | 0.02 | to profit |
| Net profit | -0.02 | 0.01 | to profit |
| Operating cash flow | 0.00 | 0.02 | +615.5% |
| Capex | 0.00 | 0.02 | +394.4% |
| EBITDA margin | -10.4% | 26.6% | +37.0 pp |
| Net margin | -40.1% | 5.9% | +46.0 pp |
Brent rose 34.2% year on year, but our calculation says that alone would have produced only $6.0m of EBITDA
Brent averaged $91.3 per barrel in the third quarter of 2026 against $68 a year earlier, a rise of 34.2%. Against the previous quarter the price fell 5.6% from $96.8. Spot now stands at $99.5, 8.9% above the reported-period average.
At the year-ago volumes and unchanged non-commodity costs, our calculation says that price move alone would have produced revenue of $71.3m and EBITDA of $6.0m. The company actually reported revenue of $88.2m and EBITDA of $23.4m, $17.5m above the implied figure. The oil price explains only a small part of the result.
Commodity prices: period average and now
| Benchmark | Year ago | Q3 2026 | YoY | Spot 2026-11-06 |
|---|---|---|---|---|
| Brent, USD | 68,0 | 91,3 | +34,2% | 99,5 |
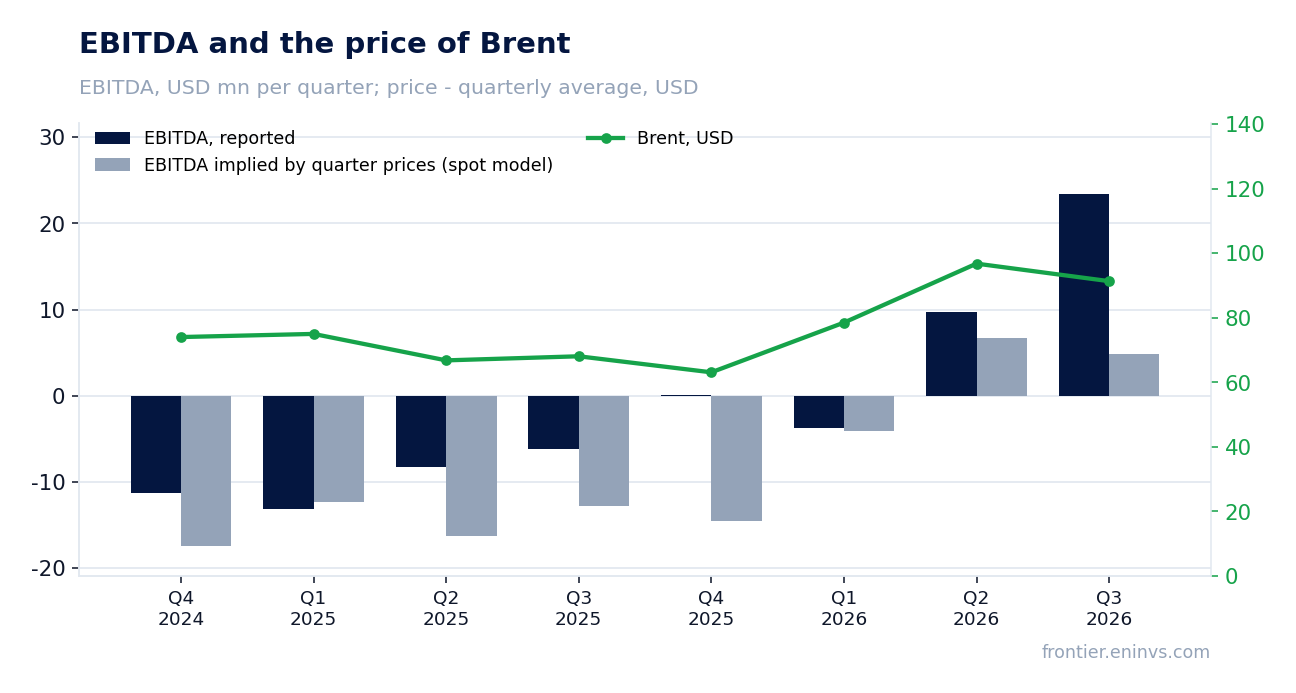
The gap between the implied $6.0m and the actual $23.4m came from $24.7m of Section 45Z income, of which about $11.0m is a one-off true-up
Revenue includes $24.7m of Section 45Z income recognised as revenue: $20.1m in the Dairy RNG segment and $4.6m in California Ethanol. Within that sum about $11.0m is a cumulative true-up for RNG dispensed in the first and second quarters of 2026, following the 8 September update to the 45ZCF-GREET model. Excluding the true-up, Section 45Z income on RNG dispensed in the third quarter itself was about $9.1m.
These receipts, not the oil price, explain the jump in EBITDA to $23.4m and the 26.6% margin against minus 10.4% a year earlier. Operating profit was $20.9m and depreciation $2.581m, which gives the EBITDA. Interest and other items below the operating line are not in EBITDA and explain only net profit.
The portal's spot model, re-priced from the average of the previous four quarters, expected EBITDA of $4.9m and revenue of $61.3m; the actual $23.4m is 379.3% above the model. The deviation from the model in the four preceding periods was +44.5%, so the current gap is an order of magnitude larger than usual.
What the prices implied and what the company earned
| Base (Q3 2025) | Implied at period prices | Reported | Reported vs implied | |
|---|---|---|---|---|
| Revenue, USD mn | 59,2 | 71,3 | 88,2 | +23,6% |
| EBITDA, USD mn | -6,20 | 6,00 | 23,4 | +292,1% |
| EBITDA, portal spot model, USD mn | — | 4,90 | 23,4 | +379,3% |
Volumes grew across every line, most strongly RNG by 38.8% and RINs by 34.4%
RNG sales rose to 158.2 thousand MMBtu from 114.0 thousand a year earlier, up 38.8%. RIN sales increased to 1,371 thousand from 1,020 thousand, up 34.4%, and LCFS credits to 27.8 thousand from 22.2 thousand, up 25.2%. Ethanol gallons sold were 15.6m against 14.7m, up 6.1%, WDG 102 thousand tons against 96 thousand, up 6.2%, and corn ground 5.4m bushels against 5.0m, up 8.0%.
The realised ethanol price rose 9.9% to $2.34 per gallon, WDG 17.1% to $89 per ton, and LCFS 35.2% to $73 per credit. The RNG price fell 8.4% to $3.16 per MMBtu and the RIN price rose only 3.4%. Volume times price for ethanol gives growth of 16.6% before hedges.
In October 2026 two more dairy digesters began operating, bringing the Aemetis Biogas network to 14 digesters receiving waste from 17 dairies. That sets the base for further RNG volume growth next quarter.
Production, realised price and unit cost (company release)
| Metric | Year ago | Reported period | YoY |
|---|---|---|---|
| Ethanol gallons sold, million gallons | 14,70 | 15,60 | +6,1% |
| WDG tons sold, thousand tons | 96,00 | 102,00 | +6,2% |
| Average ethanol sales price, $ per gallon | 2,13 | 2,34 | +9,9% |
| Average WDG sales price, $ per ton | 76,00 | 89,00 | +17,1% |
| Average RNG price, $ per MMBtu | 3,45 | 3,16 | -8,4% |
| Average delivered cost of corn, $ per bushel | 5,95 | 6,29 | +5,7% |
Corn rose 5.7% to $6.29 per bushel, eating into ethanol margin
The average delivered cost of corn in the reported quarter was $6.29 per bushel against $5.95 a year earlier, up 5.7%. For the nine months of 2026 it was $6.10 against $6.33 a year earlier, so on the year the feedstock is cheaper, while in the single quarter it rose.
The 9.9% rise in the ethanol price outpaced the 5.7% rise in corn, so California Ethanol's gross profit grew on both price and volume. Company gross profit was $29.5m against a loss of $58 thousand a year earlier, but that swing was created largely by recognising tax credits in revenue, not by feedstock conditions alone.
Interest of $15.8m absorbed almost all of the $20.9m operating result
Interest expense rose $0.8m to $15.8m, of which $14.2m was interest and $1.216m accretion on the Series A preferred units. Operating profit was $20.9m, and after interest only $5.2m of net profit remained. The net margin was 5.9% against minus 40.1% a year earlier.
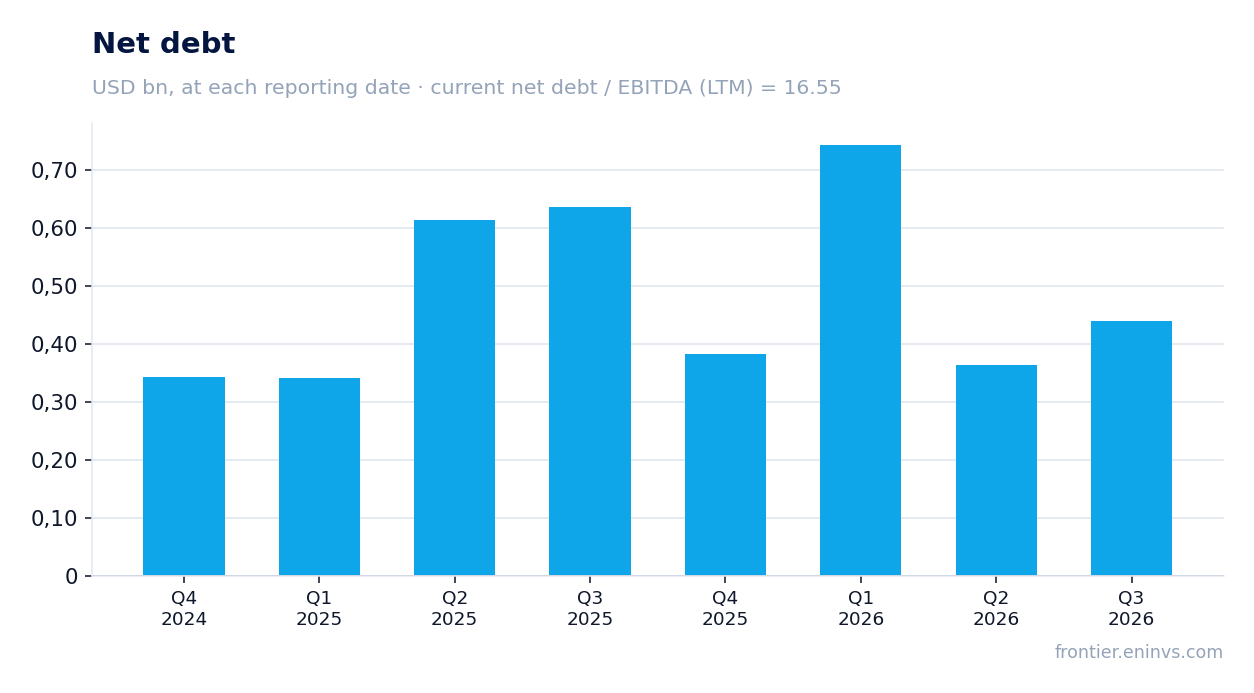
Net debt at 30 September 2026 was $0.4bn: from $0.4bn at 30 June 2026 it rose by $0.1bn, and from $0.6bn at 30 September 2025 it fell by $0.2bn. Net debt to LTM EBITDA is 16.55, stated as a level without comparison to a prior value.
In September 2026 the company received $22.4m from the sale of Section 45Z credits. It is preparing long-term financing for the Keyes plant, financing for the Dairy RNG digester buildout, and a potential IPO of its Indian subsidiary Universal Biofuels, for which legal and financial advisers have been retained.
Operating cash flow of $22.0m went almost entirely into $20.2m of capex
Operating cash flow in the third quarter was $21.953m and capital expenditure $20.224m. The $1.7m difference is all that remained after investment. For the nine months of 2026 operating cash flow was $9.5m and capex $35.3m, of which $17.1m went to California Ethanol and $17.4m to Aemetis Biogas.
Cash at the end of the quarter was $3.4m against $4.9m at the end of 2025. With that cash balance and $316.4m of current portion of long-term debt plus $60.5m of short-term borrowings, financing remains the central question. The mechanical vapour recompression project at Keyes, which will replace about 80% of the fossil natural gas with electricity, has all its equipment and is under construction.
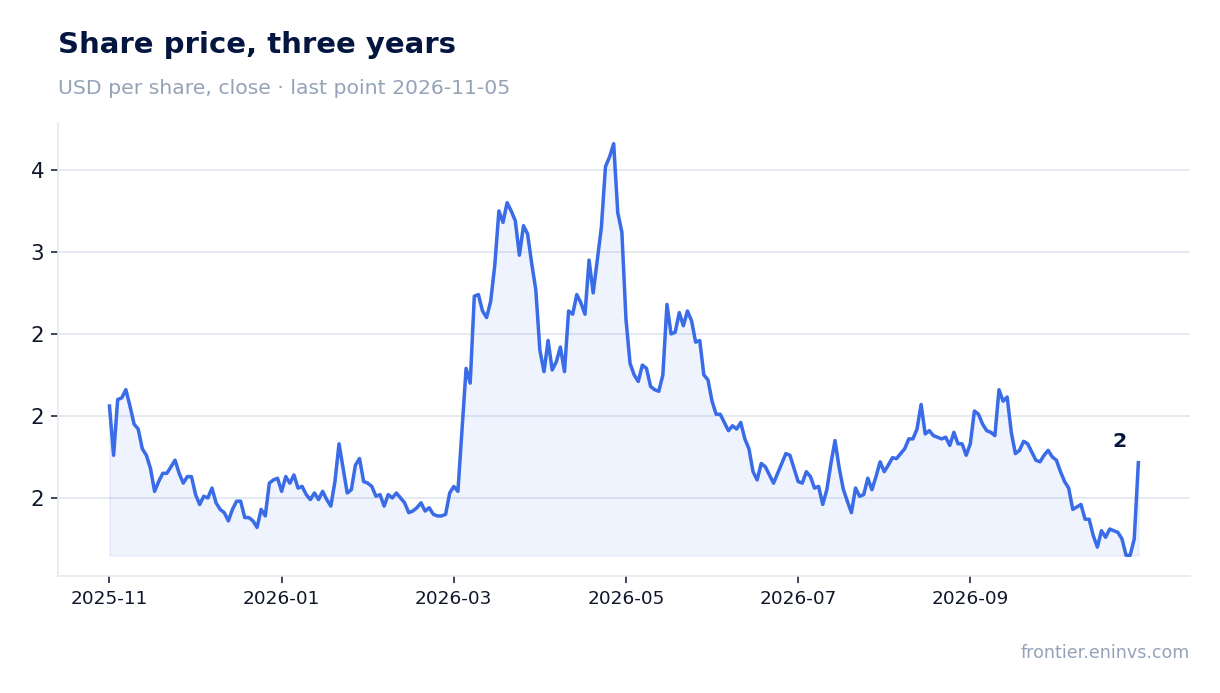
At today's prices EBITDA is estimated at $50.4m, which brings EV/EBITDA down to 11.2x
At today's commodity prices the portal's spot model estimates annual EBITDA at $50.4m against $29.4m on the LTM model, up 71.5%. EV/EBITDA falls to 11.2x and net debt to EBITDA to 8.7x. That is the base valuation should start from, since LTM reflects past prices.
On actual LTM figures EV/EBITDA is 19.1x and net debt to EBITDA is 16.55x. Return on equity is negative at minus 6.6%. Market capitalisation is $123.8m. The share rose 37.2% on the release day and held that level through 5 November 2026.
Even at today's prices 11.2x EV/EBITDA does not look cheap for a producer with debt at 8.7x EBITDA and negative equity of minus $314.2m. The valuation rests on Section 45Z income continuing, which contributed $24.7m of revenue in the third quarter.
Valuation on the latest reported figures
| Metric | Value |
|---|---|
| Market cap | 0.12 bn USD |
| EV/EBITDA (LTM) | 19.1 |
| Net debt / EBITDA (LTM) | 16.55 |
| Operating cash flow (LTM) | 0.02 bn |
| ROE | -6.6% |
Bottom line
The quarter's strength was volume growth across every line, higher ethanol and LCFS prices, and $22.0m of operating cash flow that almost covered capex. But profit and EBITDA were created mainly by recognising $24.7m of Section 45Z income, of which about $11.0m is a one-off true-up, not by commodity conditions: our calculation says the Brent price alone would have produced only $6.0m of EBITDA. The question for a holder now is whether the 45Z income stream persists and is enough to service debt at 16.55x LTM EBITDA. The verdict is rather_unattractive: even at today's prices 11.2x EV/EBITDA and 8.7x debt to EBITDA leave no cushion, and the share has already risen 37.2% on the release.
Open the company's financial profile AMTX →
See also: market overview · valuation map · stock screeners