COMM_AU: profit nearly doubled, but the whole gain rests on one fat margin
Q2 2026 results showed revenue of $3.10bn (+27.0% YoY), EBITDA of $1.70bn (+55.8%) and net profit of $1.19bn (+47.9%). The EBITDA margin rose to 54.7% from 44.6% a year earlier, and the net margin to 38.4% from 33.0%. With a P/E LTM of 9.8 and net debt of minus $1.2bn, the share looks rather attractive, but the key question is whether this margin holds.
Key takeaways
— Revenue added 27.0% YoY to $3.10bn, and the whole gain landed in the second quarter
— EBITDA rose 55.8% because the margin climbed to 54.7% from 44.6%
— Net profit added 47.9% to $1.19bn on a 38.4% net margin
— Operating cash flow of $1.43bn covers profit rather than lagging it
— Net debt flipped sign: from $0.1bn on 30 June 2025 to minus $1.2bn on 30 June 2026
— A P/E LTM of 9.8 and EV/EBITDA LTM of 6.7 leave room, and the portal model shows +15% upside
— A 54.5% return on equity with almost no debt load is the main argument for the share
Attractiveness
Key figures, USD bn
| Metric | Q2 2025 | Q2 2026 | Change |
|---|---|---|---|
| Revenue | 2.44 | 3.10 | +27.0% |
| EBITDA | 1.09 | 1.70 | +55.8% |
| Operating profit | 1.00 | 1.58 | +58.5% |
| Net profit | 0.81 | 1.19 | +47.9% |
| Operating cash flow | 1.02 | 1.43 | +40.7% |
| EBITDA margin | 44.6% | 54.7% | +10.1 pp |
| Net margin | 33.0% | 38.4% | +5.4 pp |
Revenue added 27.0% YoY to $3.10bn, and the whole gain landed in the second quarter
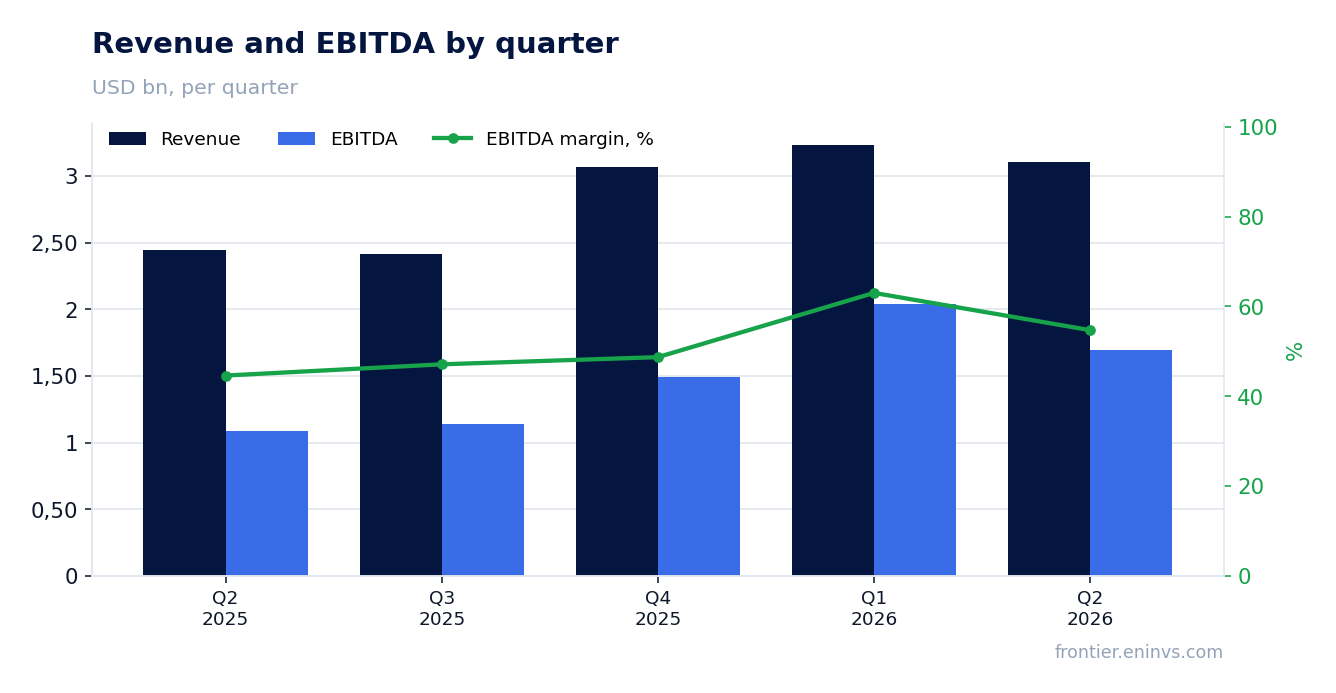
In Q2 2026 revenue was $3.10bn against $2.45bn a year earlier – growth of 27.0%. This is the only stretch in the available history where revenue topped $3bn twice in a row: Q1 had $3.24bn.
The quarterly sequence shows the growth is not a one-off: $2.45bn in Q2 2025, $2.42bn in Q3, $3.07bn in Q4, $3.24bn in Q1 2026 and $3.10bn in Q2. The level above $3bn has held for three quarters running.
For a holder this means the top line is no longer the weak spot. The question is now how much of the profit survives when the margin returns to normal.
EBITDA rose 55.8% because the margin climbed to 54.7% from 44.6%
EBITDA in Q2 2026 was $1.70bn against $1.09bn a year earlier, growth of 55.8%. With revenue up 27.0%, a jump like that can only come from margin: it rose to 54.7% from 44.6%.
Operating profit rose to $1.58bn from $999m, or 58.5%. The gap between EBITDA and operating profit is small; depreciation takes about $115m a quarter – little for a company of this size.
A margin above 50% is rare in most industries, and the durability of that level is the main risk in the report. If half the EBITDA gain came from a one-off, the next report will show the pullback.
Net profit added 47.9% to $1.19bn on a 38.4% net margin
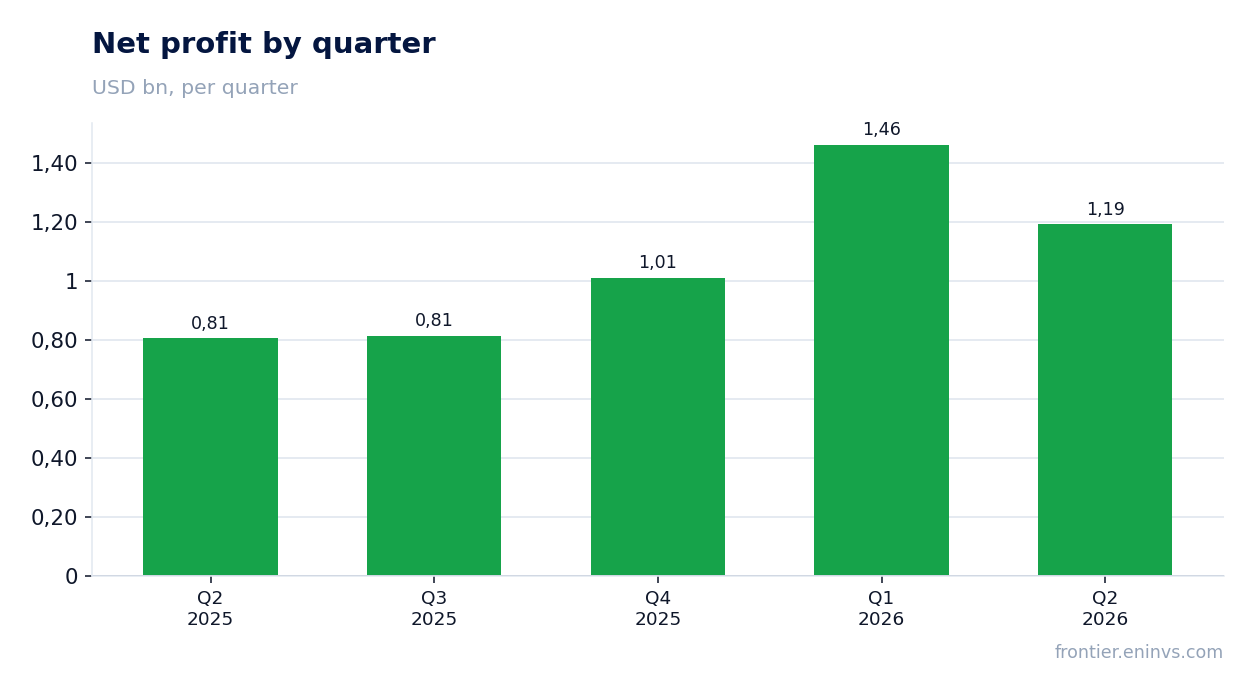
Net profit in Q2 2026 was $1.19bn against $806m a year earlier, growth of 47.9%. The net margin rose to 38.4% from 33.0%.
Profit grows slower than EBITDA (47.9% versus 55.8%) because below the operating line costs rose faster than revenue. The gap between operating profit of $1.58bn and net profit of $1.19bn is about $390m for interest, taxes and other items.
For valuation the level of profit matters less than the fact that it was earned on $3.10bn of revenue. Earnings against a market cap of $43.8bn give a P/E LTM of 9.8 – below most companies with such profitability.
Operating cash flow of $1.43bn covers profit rather than lagging it
Operating cash flow in Q2 2026 was $1.43bn against $1.02bn a year earlier. It exceeds net profit of $1.19bn, so profit is backed by cash rather than receivables.
Over the last twelve months operating flow reached $6.18bn against LTM net profit of $4.48bn and LTM EBITDA of $6.43bn. The flow is almost equal to EBITDA – a rare quality for a company with such a margin.
Capex is not in the report, so free cash flow cannot be calculated. But with flow above profit and a growing cash pile, the company funds itself, which removes the question of debt burden.
Net debt flipped sign: from $0.1bn on 30 June 2025 to minus $1.2bn on 30 June 2026
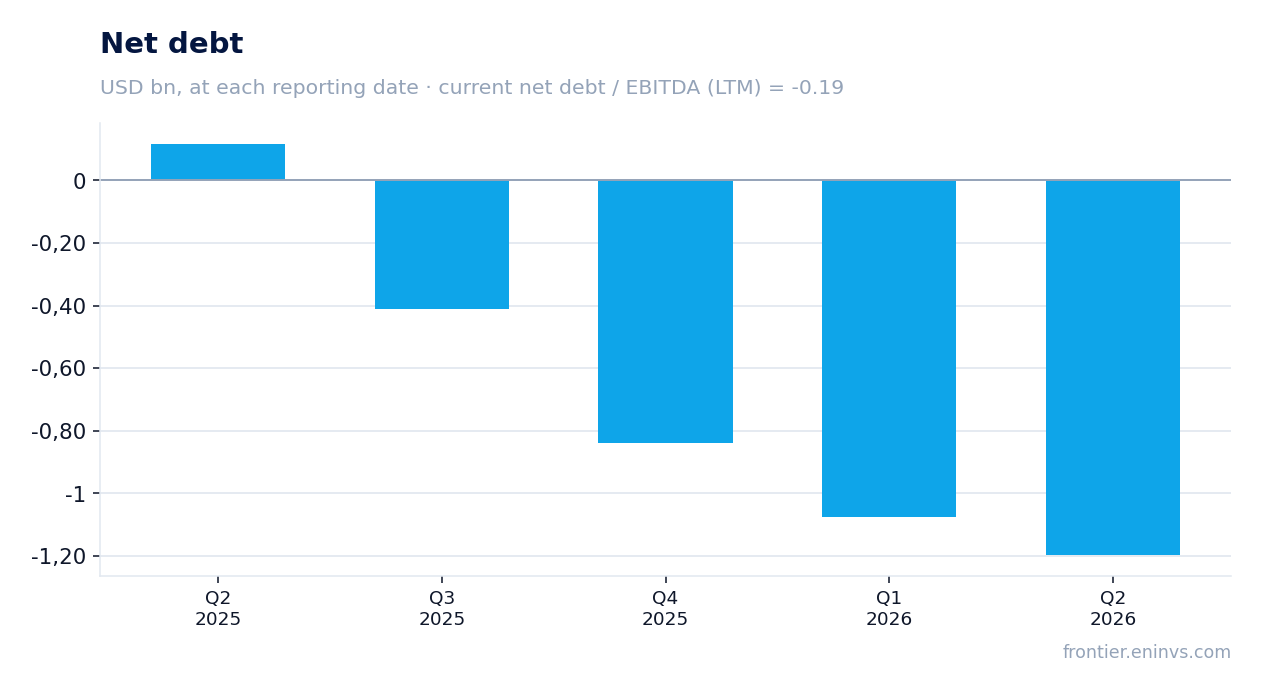
On 30 June 2026 net debt was minus $1.2bn, meaning cash exceeds debt. A year earlier, on 30 June 2025, it was $0.1bn – a change over 12 months of minus $1.3bn.
Within the year the move is steady: from minus $1.1bn on 31 March 2026 to minus $1.2bn on 30 June, a change of minus $0.1bn for the quarter. Debt was not repaid in one go – cash grew with profit.
The ratio of net debt to LTM EBITDA is minus 0.19. A negative value means net cash, not leverage. For a holder this is a buffer: the company can ride out a weak quarter without going to the market.
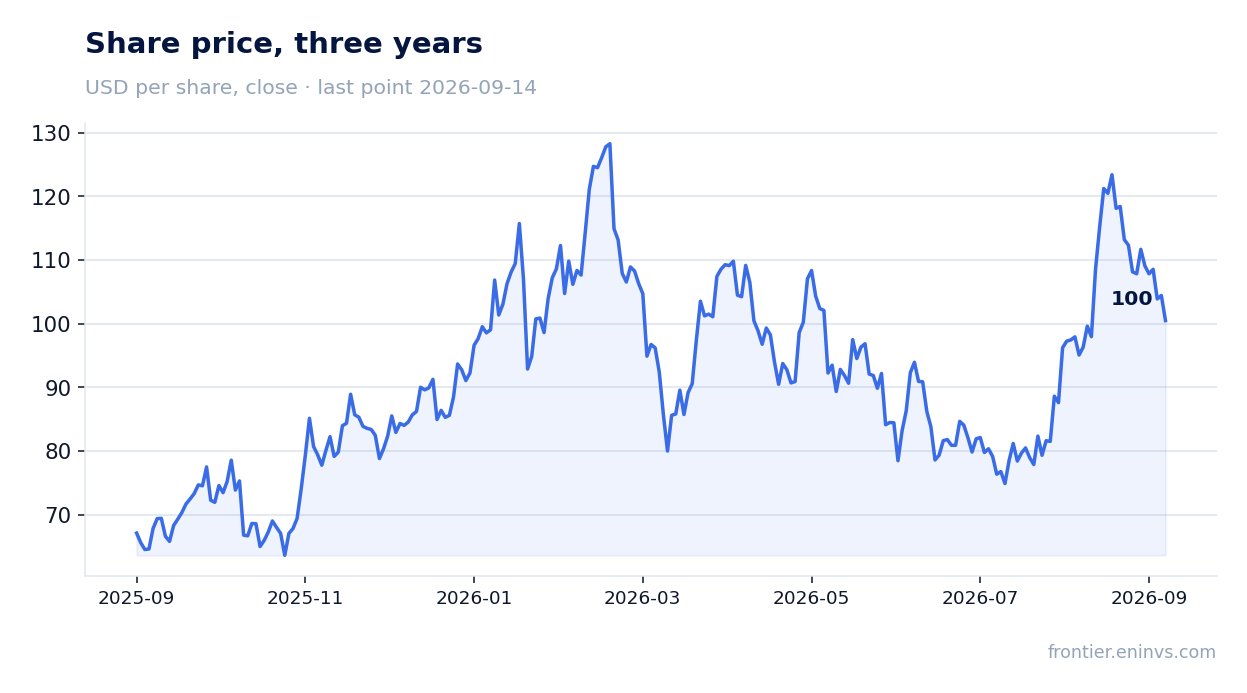
A P/E LTM of 9.8 and EV/EBITDA LTM of 6.7 leave room, and the portal model shows +15% upside
With a market cap of $43.8bn and LTM profit of $4.48bn, the P/E LTM is 9.8. EV/EBITDA LTM is 6.7. For a company with a 54.5% return on equity and net cash, that is not expensive.
On the portal's model, where EBITDA is repriced at current commodity prices at the target EV/EBITDA, the upside of the share to fair value is +15%. This is our own estimate, not a market consensus.
The room comes from the gap between profit and price: the market does not pay full value for a margin above 50% because it doubts its durability. If the margin holds for two more quarters, the multiple will be re-rated.
A 54.5% return on equity with almost no debt load is the main argument for the share
Return on equity is 54.5%. That level is not achieved through debt: net debt is negative, at minus 0.19 of LTM EBITDA. Profit is earned on equity, not on borrowings.
The combination of high profitability and net cash is rare. Usually a company either grows on debt or sits on cash without a return. Here both conditions hold at once.
That is what makes the share interesting at a P/E of 9.8. If profit falls by a quarter, the multiple rises to 13 – still acceptable. There is a margin of safety in the valuation.
Valuation on the latest reported figures
| Metric | Value |
|---|---|
| Market cap | 43.8 bn USD |
| P/E (LTM) | 9.8 |
| EV/EBITDA (LTM) | 6.7 |
| P/B | 11.80 |
| Net debt / EBITDA (LTM) | -0.19 |
| Operating cash flow (LTM) | 6.18 bn |
| ROE | 54.5% |
Bottom line
The strong side of the report is not the 27.0% revenue growth but the fact that profit is backed by cash: operating flow of $1.43bn exceeds net profit of $1.19bn. Net cash of $1.2bn and a 54.5% return on equity make the company resilient to a weak quarter. The weak spot is the 54.7% margin: the market does not pay full value for it, and the P/E of 9.8 reflects that doubt. The question for a holder now is whether the margin holds for two more quarters – if it does, the multiple will be re-rated and the portal model's +15% upside will prove conservative.
Open the company's financial profile AU →
See also: market overview · valuation map · stock screeners