Gold rose 23.4% but revenue only 8.4%: the company sold less metal, and EBITDA fell 14.7% short of what the price implied
Contents
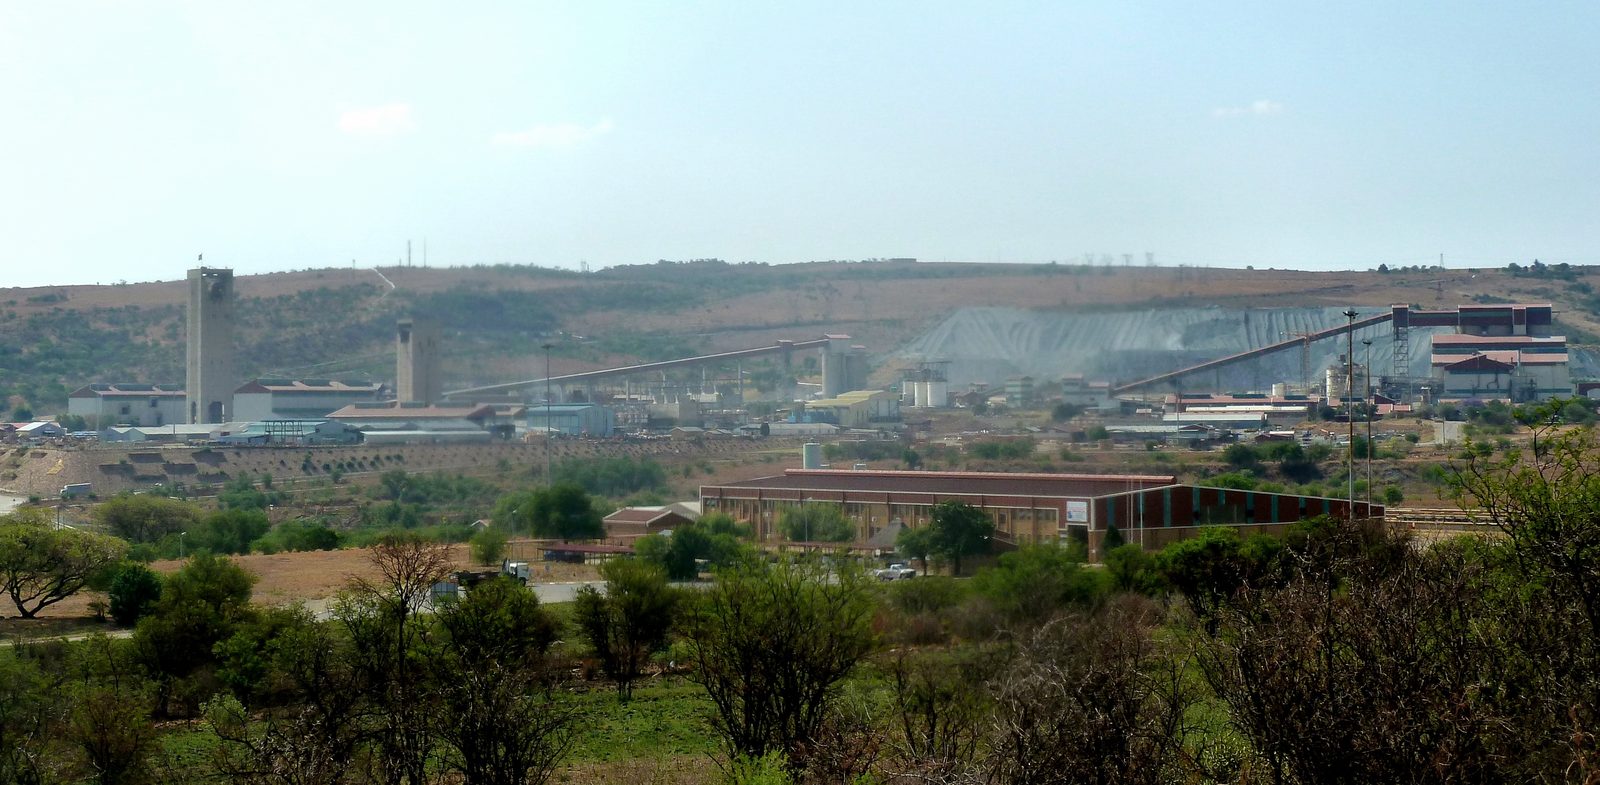
On 11 November the company released its third-quarter 2026 results. The average gold price in the period was 4268 USD/oz, 23.4% above a year earlier, but 5.5% below the previous quarter, and spot now stands at 4045 USD. Revenue came in at 2619 million USD (+8.4% year on year) and EBITDA at 1313 million USD, which is 226.2 million USD, or 14.7%, below what the year-ago volumes and costs would have earned at today's prices. Our conclusion: rather unattractive – on the portal's model the share's fair value is 29% below the current price. Our view: the share is rather unattractive at the current price; upside on the portal model -29%.
Our view: is there upside
Our view in numbers
| Metric | Our read |
|---|---|
| Verdict | Rather unattractive |
| Upside on the portal model | -29% |
| How the model works | spot model: EBITDA re-priced to current commodity prices at the target EV/EBITDA, against market cap |
| Net debt / EBITDA | -0.23 – net cash |
| Strongest case for | The company holds net cash of 1475 million USD and operating cash flow of 1380 million USD covers capital expenditure of 497 million USD almost threefold, providing a cushion if prices fall. |
| Strongest case against | On the portal's spot model the share's fair value is 29% below the current price, and at today's prices EV/EBITDA is 10.4 against 7.59 on LTM. |
| What would change the view | A return of gold to the reported-period average of 4268 USD/oz would lift the verdict one step to neutral, while spot falling below 4045 USD with expensive diesel would push it to unattractive. |
Key takeaways
— Gold averaged 4268 USD/oz in the quarter, 23.4% above a year earlier but 5.5% below the previous quarter, and spot had fallen to 4045 USD by 11 November
— At the period's prices and the year-ago volumes revenue should have been 2982.5 million USD; the actual figure was 363.5 million USD, or 12.2%, lower
— EBITDA fell 226.2 million USD, or 14.7%, short of the price-implied level, even as the margin rose to 50.1% from 47.1% a year earlier
— Diesel rose 45.3% year on year to 5.454 USD and, at 15% of revenue, cost the company an extra 164.2 million USD
— Net profit fell 3.4% year on year to 787 million USD and the net margin dropped to 30.0% from 33.7%
— The company holds net cash of 1475 million USD, equal to minus 0.23 of LTM EBITDA, and operating cash flow of 1380 million USD covered capital expenditure of 497 million USD almost threefold
— On the portal's spot model EBITDA at current prices is 4681.2 million USD, 28.5% below LTM, and EV/EBITDA at current prices is 10.4
Key figures, USD bn
| Metric | Q3 2025 | Q3 2026 | Change |
|---|---|---|---|
| Revenue | 2.42 | 2.62 | +8.4% |
| EBITDA | 1.14 | 1.31 | +15.4% |
| Operating profit | 1.03 | 1.19 | +15.7% |
| Net profit | 0.81 | 0.79 | -3.4% |
| Operating cash flow | 1.42 | 1.38 | -2.7% |
| Capex | 0.34 | 0.50 | +45.3% |
| EBITDA margin | 47.1% | 50.1% | +3.0 pp |
| Net margin | 33.7% | 30.0% | -3.7 pp |
Gold averaged 4268 USD/oz in the quarter, 23.4% above a year earlier but 5.5% below the previous quarter, and spot had fallen to 4045 USD by 11 November
The selling price is the main input for a miner's report, and in the third quarter of 2026 it was high: gold averaged 4268 USD/oz against 3459 USD a year earlier, up 23.4%. That is the strongest year-on-year level in recent quarters, and it sets the bar against which revenue and EBITDA must be measured.
Within the year, however, the price has already turned: it fell 5.5% quarter on quarter to 4514 USD, and by 11 November spot stood at 4045 USD, a further 5.2% below the reported-period average. For the company this means the quarter still reflected high prices, while the next report will be set against a weaker market.
Commodity prices: period average and now
| Benchmark | Year ago | Q3 2026 | YoY | Spot 2026-11-11 |
|---|---|---|---|---|
| Gold, USD | 3 459 | 4 268 | +23,4% | 4 045 |
| US Diesel Index (EIA) (input cost), USD | 3,75 | 5,45 | +45,3% | 6,13 |
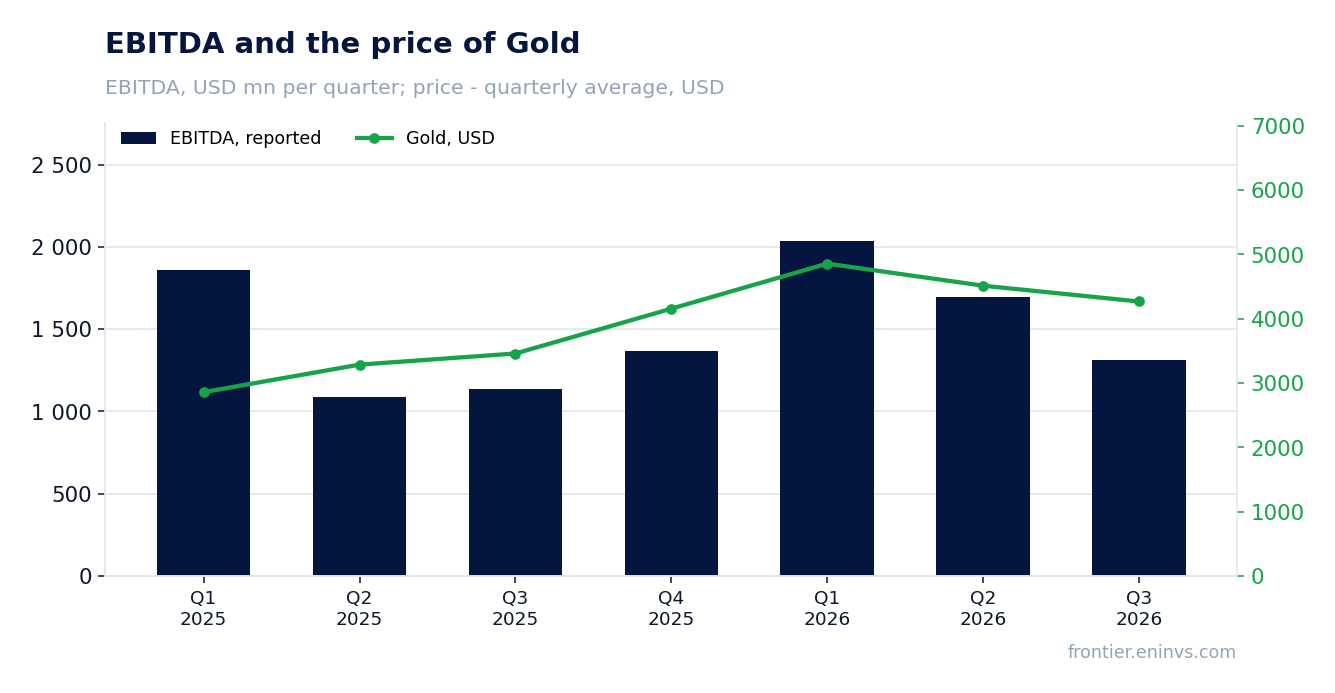
At the period's prices and the year-ago volumes revenue should have been 2982.5 million USD; the actual figure was 363.5 million USD, or 12.2%, lower
On our calculation, had sales volumes and non-price costs stayed at the third-quarter 2025 level while prices moved as they did, revenue would have been 2982.5 million USD. The price effect would have added 565.5 million USD, or 23.4%, while more expensive fuel would have taken 164.2 million USD of costs.
Actual revenue was 2619 million USD, 363.5 million USD, or 12.2%, below the price-implied figure. That means the company sold less metal than a year earlier: with the price 23.4% higher, revenue grew only 8.4%. The gap between those two numbers is the volume shortfall, which the FACTS do not spell out but the arithmetic points to.
The same calculation against the previous quarter gives revenue of 2934.6 million USD at a price 5.5% lower; the actual figure is 315.6 million USD, or 10.8%, below it. The picture is the same: the price decline explains only part of the drop, and the rest came from volumes.
What the prices implied and what the company earned
| Base (Q3 2025) | Implied at period prices | Reported | Reported vs implied | |
|---|---|---|---|---|
| Revenue, USD mn | 2 417 | 2 982 | 2 619 | -12,2% |
| EBITDA, USD mn | 1 138 | 1 539 | 1 313 | -14,7% |
Revenue and EBITDA by quarter
| Period | Measure | bn USD |
|---|---|---|
| Q1 2025 | Revenue | 1.963 |
| Q2 2025 | Revenue | 2.445 |
| Q3 2025 | Revenue | 2.417 |
| Q4 2025 | Revenue | 3.068 |
| Q1 2026 | Revenue | 3.236 |
| Q2 2026 | Revenue | 3.104 |
| Q3 2026 | Revenue | 2.619 |
| Q1 2025 | EBITDA | 1.857 |
| Q2 2025 | EBITDA | 1.09 |
| Q3 2025 | EBITDA | 1.138 |
| Q4 2025 | EBITDA | 1.37 |
| Q1 2026 | EBITDA | 2.039 |
| Q2 2026 | EBITDA | 1.698 |
| Q3 2026 | EBITDA | 1.313 |
EBITDA margin
| Period | Measure | % |
|---|---|---|
| Q1 2025 | EBITDA margin | 94.6 |
| Q2 2025 | EBITDA margin | 44.6 |
| Q3 2025 | EBITDA margin | 47.1 |
| Q4 2025 | EBITDA margin | 44.7 |
| Q1 2026 | EBITDA margin | 63.0 |
| Q2 2026 | EBITDA margin | 54.7 |
| Q3 2026 | EBITDA margin | 50.1 |
EBITDA fell 226.2 million USD, or 14.7%, short of the price-implied level, even as the margin rose to 50.1% from 47.1% a year earlier
On our calculation, at the year-ago volumes and non-price costs and at current prices, EBITDA should have been 1539.2 million USD. The actual figure was 1313 million USD, 226.2 million USD, or 14.7%, lower. The shortfall almost mirrors the revenue miss, meaning the company under-earned mainly on volumes rather than on unit costs.
Yet the EBITDA margin rose to 50.1% from 47.1% a year earlier. That is not a contradiction: revenue fell faster than costs because some inputs – diesel above all – rose more slowly than the gold price, while the price itself stayed high. The margin measures EBITDA as a share of revenue, and with lower revenue it was held up by slower cost growth.
Against the previous quarter the price-implied EBITDA was 1523.7 million USD; the actual figure is 210.7 million USD, or 13.8%, below it. Here too the shortfall is explained by volumes rather than price: the price fell only 5.5%, while EBITDA fell 22.7%.
Diesel rose 45.3% year on year to 5.454 USD and, at 15% of revenue, cost the company an extra 164.2 million USD
Fuel is the main purchased input in the portal's model, and it rose faster than gold: the EIA diesel index averaged 5.454 USD against 3.754 USD a year earlier, up 45.3%. At 15% of revenue that added 164.2 million USD to costs, and the amount is already included in the price-implied EBITDA.
Quarter on quarter diesel rose 1.1% to 5.397 USD, and by 11 November spot had climbed to 6.127 USD, a further 12.3% above the reported-period average. That is a headwind for unit costs: at today's fuel and gold prices the pressure on unit costs persists, and it is what caps future EBITDA.
Fuel accounts for 15% of revenue, so even at a high gold price diesel inflation eats into the margin. In the reported quarter that did not happen only because gold rose even more – 23.4% against 45.3% for diesel in absolute terms, but from a smaller base.
Net profit fell 3.4% year on year to 787 million USD and the net margin dropped to 30.0% from 33.7%
EBITDA rose 15.4% year on year, while net profit fell 3.4% to 787 million USD. The gap is explained by items below operating profit that are not part of EBITDA: their movement pulled profit down even as the operating result grew. The FACTS do not disclose those items, so the specific cause cannot be named – all that is visible is that profit lagged EBITDA.
The net margin fell to 30.0% from 33.7%. With revenue of 2619 million USD and profit of 787 million USD, the company earns less per dollar of sales than a year earlier, even though the operating margin rose. For a shareholder that gap matters: operationally the company is doing better, but less of it reaches net profit.
Over the last twelve months net profit was 4452 million USD, putting P/E at 11.27. That is a low multiple in itself, but it is calculated on profit earned at high gold prices that have already begun to fall.
The company holds net cash of 1475 million USD, equal to minus 0.23 of LTM EBITDA, and operating cash flow of 1380 million USD covered capital expenditure of 497 million USD almost threefold
As of 30 September 2026 the company holds net cash of 1475 million USD – its debt is smaller than its cash. The ratio of net debt to LTM EBITDA is minus 0.23, meaning there is no debt burden. That is a strength of the balance sheet: if gold prices fall, the company faces no pressure from creditors.
Operating cash flow in the reported quarter was 1380 million USD and capital expenditure 497 million USD. Free cash flow therefore remains solidly positive, with capex covered almost threefold by operating cash flow. This is the part of the report that does not depend on price swings and shows the business generates cash.
Over the last twelve months operating cash flow was 6143 million USD. With capex of around 500 million USD a quarter, the company funds sustaining production from its own resources and still leaves a sizeable buffer. That buffer is what allows it to hold net cash and pay dividends.
Share price, three years
close, last point 2026-09-14
| Period | Measure | USD per share |
|---|---|---|
| 2025-09-15 | Closing price | 67.0999984741211 |
| 2025-09-16 | Closing price | 65.5999984741211 |
| 2025-09-17 | Closing price | 64.5199966430664 |
| 2025-09-18 | Closing price | 64.5999984741211 |
| 2025-09-19 | Closing price | 67.81999969482422 |
| 2025-09-22 | Closing price | 69.37000274658203 |
| 2025-09-23 | Closing price | 69.41999816894531 |
| 2025-09-24 | Closing price | 66.5999984741211 |
| 2025-09-25 | Closing price | 65.80000305175781 |
| 2025-09-26 | Closing price | 68.30000305175781 |
| 2025-09-29 | Closing price | 69.29000091552734 |
| 2025-09-30 | Closing price | 70.33000183105469 |
| 2025-10-01 | Closing price | 71.66999816894531 |
| 2025-10-02 | Closing price | 72.45999908447266 |
| 2025-10-03 | Closing price | 73.31999969482422 |
| 2025-10-06 | Closing price | 74.66999816894531 |
| 2025-10-07 | Closing price | 74.52999877929688 |
| 2025-10-08 | Closing price | 77.48999786376953 |
| 2025-10-09 | Closing price | 72.26000213623047 |
| 2025-10-10 | Closing price | 71.93000030517578 |
| 2025-10-13 | Closing price | 74.56999969482422 |
| 2025-10-14 | Closing price | 73.44999694824219 |
| 2025-10-15 | Closing price | 75.22000122070312 |
| 2025-10-16 | Closing price | 78.55000305175781 |
| 2025-10-17 | Closing price | 73.86000061035156 |
| 2025-10-20 | Closing price | 75.29000091552734 |
| 2025-10-21 | Closing price | 66.77999877929688 |
| 2025-10-22 | Closing price | 66.66999816894531 |
| 2025-10-23 | Closing price | 68.61000061035156 |
| 2025-10-24 | Closing price | 68.56999969482422 |
| 2025-10-27 | Closing price | 64.98999786376953 |
| 2025-10-28 | Closing price | 65.94999694824219 |
| 2025-10-29 | Closing price | 67.29000091552734 |
| 2025-10-30 | Closing price | 69.0 |
| 2025-10-31 | Closing price | 68.0 |
| 2025-11-03 | Closing price | 67.04000091552734 |
| 2025-11-04 | Closing price | 63.61000061035156 |
| 2025-11-05 | Closing price | 67.04000091552734 |
| 2025-11-06 | Closing price | 67.81999969482422 |
| 2025-11-07 | Closing price | 69.41000366210938 |
| 2025-11-10 | Closing price | 74.0999984741211 |
| 2025-11-11 | Closing price | 79.3499984741211 |
| 2025-11-12 | Closing price | 85.12999725341797 |
| 2025-11-13 | Closing price | 80.69999694824219 |
| 2025-11-14 | Closing price | 79.38999938964844 |
| 2025-11-17 | Closing price | 77.76000213623047 |
| 2025-11-18 | Closing price | 80.0999984741211 |
| 2025-11-19 | Closing price | 82.23999786376953 |
| 2025-11-20 | Closing price | 79.13999938964844 |
| 2025-11-21 | Closing price | 79.80999755859375 |
| 2025-11-24 | Closing price | 83.94999694824219 |
| 2025-11-25 | Closing price | 84.36000061035156 |
| 2025-11-26 | Closing price | 88.91000366210938 |
| 2025-11-28 | Closing price | 85.68000030517578 |
| 2025-12-01 | Closing price | 85.30000305175781 |
| 2025-12-02 | Closing price | 83.86000061035156 |
| 2025-12-03 | Closing price | 83.55000305175781 |
| 2025-12-04 | Closing price | 83.37999725341797 |
| 2025-12-05 | Closing price | 82.44999694824219 |
| 2025-12-08 | Closing price | 78.80999755859375 |
| 2025-12-09 | Closing price | 80.33999633789062 |
| 2025-12-10 | Closing price | 82.33000183105469 |
| 2025-12-11 | Closing price | 85.5 |
| 2025-12-12 | Closing price | 82.91999816894531 |
| 2025-12-15 | Closing price | 84.30999755859375 |
| 2025-12-16 | Closing price | 84.0199966430664 |
| 2025-12-17 | Closing price | 84.54000091552734 |
| 2025-12-18 | Closing price | 85.68000030517578 |
| 2025-12-19 | Closing price | 86.19999694824219 |
| 2025-12-22 | Closing price | 90.0 |
| 2025-12-23 | Closing price | 89.5999984741211 |
| 2025-12-24 | Closing price | 89.91000366210938 |
| 2025-12-26 | Closing price | 91.25 |
| 2025-12-29 | Closing price | 84.94000244140625 |
| 2025-12-30 | Closing price | 86.37999725341797 |
| 2025-12-31 | Closing price | 85.27999877929688 |
| 2026-01-02 | Closing price | 85.5999984741211 |
| 2026-01-05 | Closing price | 88.47000122070312 |
| 2026-01-06 | Closing price | 93.66000366210938 |
| 2026-01-07 | Closing price | 92.73999786376953 |
| 2026-01-08 | Closing price | 91.05999755859375 |
| 2026-01-09 | Closing price | 92.25 |
| 2026-01-12 | Closing price | 96.58999633789062 |
| 2026-01-13 | Closing price | 97.66000366210938 |
| 2026-01-14 | Closing price | 99.51000213623047 |
| 2026-01-15 | Closing price | 98.55000305175781 |
| 2026-01-16 | Closing price | 99.02999877929688 |
| 2026-01-20 | Closing price | 106.83999633789062 |
| 2026-01-21 | Closing price | 101.36000061035156 |
| 2026-01-22 | Closing price | 103.05000305175781 |
| 2026-01-23 | Closing price | 106.26000213623047 |
| 2026-01-26 | Closing price | 108.08999633789062 |
| 2026-01-27 | Closing price | 109.44000244140625 |
| 2026-01-28 | Closing price | 115.72000122070312 |
| 2026-01-29 | Closing price | 107.0199966430664 |
| 2026-01-30 | Closing price | 92.87000274658203 |
| 2026-02-02 | Closing price | 94.8499984741211 |
| 2026-02-03 | Closing price | 100.73999786376953 |
| 2026-02-04 | Closing price | 100.87000274658203 |
| 2026-02-05 | Closing price | 98.58999633789062 |
| 2026-02-06 | Closing price | 103.94999694824219 |
| 2026-02-09 | Closing price | 107.19000244140625 |
| 2026-02-10 | Closing price | 108.61000061035156 |
| 2026-02-11 | Closing price | 112.2699966430664 |
| 2026-02-12 | Closing price | 104.7300033569336 |
| 2026-02-13 | Closing price | 109.81999969482422 |
| 2026-02-17 | Closing price | 106.16999816894531 |
| 2026-02-18 | Closing price | 108.3499984741211 |
| 2026-02-19 | Closing price | 107.62999725341797 |
| 2026-02-20 | Closing price | 114.25 |
| 2026-02-23 | Closing price | 121.12000274658203 |
| 2026-02-24 | Closing price | 124.69999694824219 |
| 2026-02-25 | Closing price | 124.5 |
| 2026-02-26 | Closing price | 126.06999969482422 |
| 2026-02-27 | Closing price | 127.7699966430664 |
| 2026-03-02 | Closing price | 128.25999450683594 |
| 2026-03-03 | Closing price | 114.91999816894531 |
| 2026-03-04 | Closing price | 113.13999938964844 |
| 2026-03-05 | Closing price | 107.88999938964844 |
| 2026-03-06 | Closing price | 106.54000091552734 |
| 2026-03-09 | Closing price | 108.9000015258789 |
| 2026-03-10 | Closing price | 108.26000213623047 |
| 2026-03-11 | Closing price | 106.2699966430664 |
| 2026-03-12 | Closing price | 104.69999694824219 |
| 2026-03-13 | Closing price | 94.88999938964844 |
| 2026-03-16 | Closing price | 96.72000122070312 |
| 2026-03-17 | Closing price | 96.19999694824219 |
| 2026-03-18 | Closing price | 92.38999938964844 |
| 2026-03-19 | Closing price | 85.69000244140625 |
| 2026-03-20 | Closing price | 79.98999786376953 |
| 2026-03-23 | Closing price | 85.5999984741211 |
| 2026-03-24 | Closing price | 85.80999755859375 |
| 2026-03-25 | Closing price | 89.55000305175781 |
| 2026-03-26 | Closing price | 85.7300033569336 |
| 2026-03-27 | Closing price | 89.16999816894531 |
| 2026-03-30 | Closing price | 90.55999755859375 |
| 2026-03-31 | Closing price | 97.36000061035156 |
| 2026-04-01 | Closing price | 103.5199966430664 |
| 2026-04-02 | Closing price | 101.22000122070312 |
| 2026-04-06 | Closing price | 101.48999786376953 |
| 2026-04-07 | Closing price | 101.08000183105469 |
| 2026-04-08 | Closing price | 107.41999816894531 |
| 2026-04-09 | Closing price | 108.55000305175781 |
| 2026-04-10 | Closing price | 109.25 |
| 2026-04-13 | Closing price | 109.12000274658203 |
| 2026-04-14 | Closing price | 109.80000305175781 |
| 2026-04-15 | Closing price | 104.47000122070312 |
| 2026-04-16 | Closing price | 104.2300033569336 |
| 2026-04-17 | Closing price | 109.1500015258789 |
| 2026-04-20 | Closing price | 106.48999786376953 |
| 2026-04-21 | Closing price | 100.44999694824219 |
| 2026-04-22 | Closing price | 98.87000274658203 |
| 2026-04-23 | Closing price | 96.76000213623047 |
| 2026-04-24 | Closing price | 99.30000305175781 |
| 2026-04-27 | Closing price | 98.2300033569336 |
| 2026-04-28 | Closing price | 93.94999694824219 |
| 2026-04-29 | Closing price | 90.47000122070312 |
| 2026-04-30 | Closing price | 93.7300033569336 |
| 2026-05-01 | Closing price | 92.76000213623047 |
| 2026-05-04 | Closing price | 90.69000244140625 |
| 2026-05-05 | Closing price | 90.9000015258789 |
| 2026-05-06 | Closing price | 98.5999984741211 |
| 2026-05-07 | Closing price | 100.2300033569336 |
| 2026-05-08 | Closing price | 107.02999877929688 |
| 2026-05-11 | Closing price | 108.33999633789062 |
| 2026-05-12 | Closing price | 104.33000183105469 |
| 2026-05-13 | Closing price | 102.37000274658203 |
| 2026-05-14 | Closing price | 102.06999969482422 |
| 2026-05-15 | Closing price | 92.23999786376953 |
| 2026-05-18 | Closing price | 93.47000122070312 |
| 2026-05-19 | Closing price | 89.33999633789062 |
| 2026-05-20 | Closing price | 92.80000305175781 |
| 2026-05-21 | Closing price | 91.8499984741211 |
| 2026-05-22 | Closing price | 90.63999938964844 |
| 2026-05-26 | Closing price | 97.48999786376953 |
| 2026-05-27 | Closing price | 94.5199966430664 |
| 2026-05-28 | Closing price | 96.30999755859375 |
| 2026-05-29 | Closing price | 96.83999633789062 |
| 2026-06-01 | Closing price | 92.08000183105469 |
| 2026-06-02 | Closing price | 91.8499984741211 |
| 2026-06-03 | Closing price | 89.8499984741211 |
| 2026-06-04 | Closing price | 92.16999816894531 |
| 2026-06-05 | Closing price | 84.12000274658203 |
| 2026-06-08 | Closing price | 84.47000122070312 |
| 2026-06-09 | Closing price | 84.43000030517578 |
| 2026-06-10 | Closing price | 78.47000122070312 |
| 2026-06-11 | Closing price | 83.18000030517578 |
| 2026-06-12 | Closing price | 86.30000305175781 |
| 2026-06-15 | Closing price | 92.29000091552734 |
| 2026-06-16 | Closing price | 93.93000030517578 |
| 2026-06-17 | Closing price | 90.91999816894531 |
| 2026-06-18 | Closing price | 90.87000274658203 |
| 2026-06-22 | Closing price | 86.2300033569336 |
| 2026-06-23 | Closing price | 83.79000091552734 |
| 2026-06-24 | Closing price | 78.58999633789062 |
| 2026-06-25 | Closing price | 79.33999633789062 |
| 2026-06-26 | Closing price | 81.62000274658203 |
| 2026-06-29 | Closing price | 81.79000091552734 |
| 2026-06-30 | Closing price | 80.88999938964844 |
| 2026-07-01 | Closing price | 80.88999938964844 |
| 2026-07-02 | Closing price | 84.6500015258789 |
| 2026-07-06 | Closing price | 84.05000305175781 |
| 2026-07-07 | Closing price | 82.08000183105469 |
| 2026-07-08 | Closing price | 79.83000183105469 |
| 2026-07-09 | Closing price | 81.91000366210938 |
| 2026-07-10 | Closing price | 82.0999984741211 |
| 2026-07-13 | Closing price | 79.76000213623047 |
| 2026-07-14 | Closing price | 80.33999633789062 |
| 2026-07-15 | Closing price | 79.13999938964844 |
| 2026-07-16 | Closing price | 76.3499984741211 |
| 2026-07-17 | Closing price | 76.76000213623047 |
| 2026-07-20 | Closing price | 74.87999725341797 |
| 2026-07-21 | Closing price | 78.5 |
| 2026-07-22 | Closing price | 81.16999816894531 |
| 2026-07-23 | Closing price | 78.41999816894531 |
| 2026-07-24 | Closing price | 79.66999816894531 |
| 2026-07-27 | Closing price | 80.4800033569336 |
| 2026-07-28 | Closing price | 78.94999694824219 |
| 2026-07-29 | Closing price | 77.87000274658203 |
| 2026-07-30 | Closing price | 82.33000183105469 |
| 2026-07-31 | Closing price | 79.31999969482422 |
| 2026-08-03 | Closing price | 81.61000061035156 |
| 2026-08-04 | Closing price | 81.5 |
| 2026-08-05 | Closing price | 88.5999984741211 |
| 2026-08-06 | Closing price | 87.58999633789062 |
| 2026-08-07 | Closing price | 96.22000122070312 |
| 2026-08-10 | Closing price | 97.25 |
| 2026-08-11 | Closing price | 97.44000244140625 |
| 2026-08-12 | Closing price | 97.91999816894531 |
| 2026-08-13 | Closing price | 95.06999969482422 |
| 2026-08-14 | Closing price | 96.30000305175781 |
| 2026-08-17 | Closing price | 99.5999984741211 |
| 2026-08-18 | Closing price | 97.94999694824219 |
| 2026-08-19 | Closing price | 108.54000091552734 |
| 2026-08-20 | Closing price | 115.13999938964844 |
| 2026-08-21 | Closing price | 121.22000122070312 |
| 2026-08-24 | Closing price | 120.47000122070312 |
| 2026-08-25 | Closing price | 123.38999938964844 |
| 2026-08-26 | Closing price | 118.11000061035156 |
| 2026-08-27 | Closing price | 118.4000015258789 |
| 2026-08-28 | Closing price | 113.19000244140625 |
| 2026-08-31 | Closing price | 112.31999969482422 |
| 2026-09-01 | Closing price | 108.12999725341797 |
| 2026-09-02 | Closing price | 107.83000183105469 |
| 2026-09-03 | Closing price | 111.66999816894531 |
| 2026-09-04 | Closing price | 109.06999969482422 |
| 2026-09-08 | Closing price | 107.83000183105469 |
| 2026-09-09 | Closing price | 108.52999877929688 |
| 2026-09-10 | Closing price | 103.87999725341797 |
| 2026-09-11 | Closing price | 104.41999816894531 |
| 2026-09-14 | Closing price | 100.4800033569336 |
On the portal's spot model EBITDA at current prices is 4681.2 million USD, 28.5% below LTM, and EV/EBITDA at current prices is 10.4
LTM EBITDA of 6504 million USD was earned at high gold prices that have already gone. On the portal's spot model EBITDA at today's prices is 4681.2 million USD, 28.5% lower. That is the base from which valuation should start: the market pays for future earnings, not past ones.
EV/EBITDA on LTM is 7.59, but at current prices it is 10.4. The 37% difference shows how much the valuation depends on the price assumption: on past earnings the share looks cheap, on current ones it no longer does. Net debt to EBITDA at current prices is minus 0.32, so the net cash position persists.
On the portal's model the share's fair value is 29% below the current price. This is our own calculation, not a market consensus: it assumes the gold price stays near today's 4045 USD rather than returning to the reported-period average of 4268 USD. If gold recovers to earlier levels the valuation would change, but for now the model points to overvaluation.
Valuation on the latest reported figures
| Metric | Value |
|---|---|
| Market cap | 50.2 bn USD |
| P/E (LTM) | 11.3 |
| EV/EBITDA (LTM) | 7.6 |
| P/B | 6.20 |
| Net debt / EBITDA (LTM) | -0.23 |
| Operating cash flow (LTM) | 6.14 bn |
| ROE | 34.3% |
Net profit by quarter
| Period | Measure | bn USD |
|---|---|---|
| Q1 2025 | Net profit | 0.542 |
| Q2 2025 | Net profit | 0.806 |
| Q3 2025 | Net profit | 0.815 |
| Q4 2025 | Net profit | 1.011 |
| Q1 2026 | Net profit | 1.462 |
| Q2 2026 | Net profit | 1.192 |
| Q3 2026 | Net profit | 0.787 |
Bottom line
What was strong in the report is not what the headline shows: the EBITDA margin rose to 50.1% from 47.1%, the company holds net cash of 1475 million USD, and operating cash flow of 1380 million USD covered capex of 497 million USD almost threefold. What was weak is volumes: with gold 23.4% higher revenue grew only 8.4%, and EBITDA fell 14.7% short of the price-implied level. Profit was further dragged down by an item below operating profit, so net profit fell 3.4% while EBITDA rose 15.4%. The real question for a holder now is what matters more – the solid balance sheet and cash flow or the valuation: on the portal's spot model EBITDA at current prices is 28.5% below LTM, EV/EBITDA is 10.4, and the share's fair value is 29% below the current price. Our conclusion: rather unattractive – on the portal's model the share's fair value is 29% below the current price. Our view: the share is rather unattractive at the current price; upside on the portal model -29%.