Black Stone Minerals: revenue accelerated to +23.5%, but EBITDA and profit fell – growth was paid for with margin
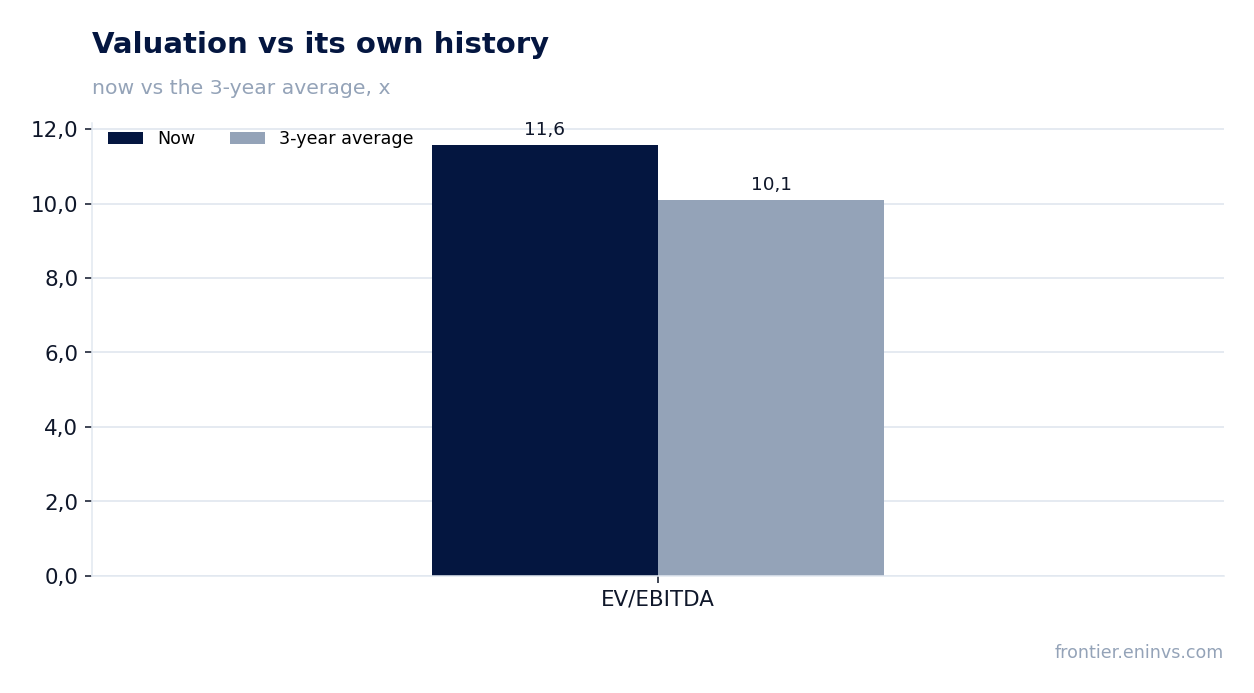
On 3 November Black Stone Minerals reported results for the third quarter of 2026. Revenue came in at USD 129.9 million, up 23.5% year on year and faster than the +14.4% of the second quarter; EBITDA was 66.3 million, down 13.5%, and net profit 52.4 million, down 42.9%. Profit fell while revenue rose, and the share trades at 11.6 EV/EBITDA LTM against its own three-year average of 10.1, so with a dividend yield of 8.2% the stock looks rather unattractive at the current price.
Key takeaways
— Revenue rose 23.5% year on year, an acceleration from +14.4% a quarter earlier
— EBITDA fell 13.5% and its margin compressed from 72.9% to 51.1% – revenue growth did not reach profit
— Net profit shrank 42.9%, with its margin down from 87.2% to 40.3%
— Operating cash flow for the quarter was 102.4 million and covered EBITDA of 66.3 million
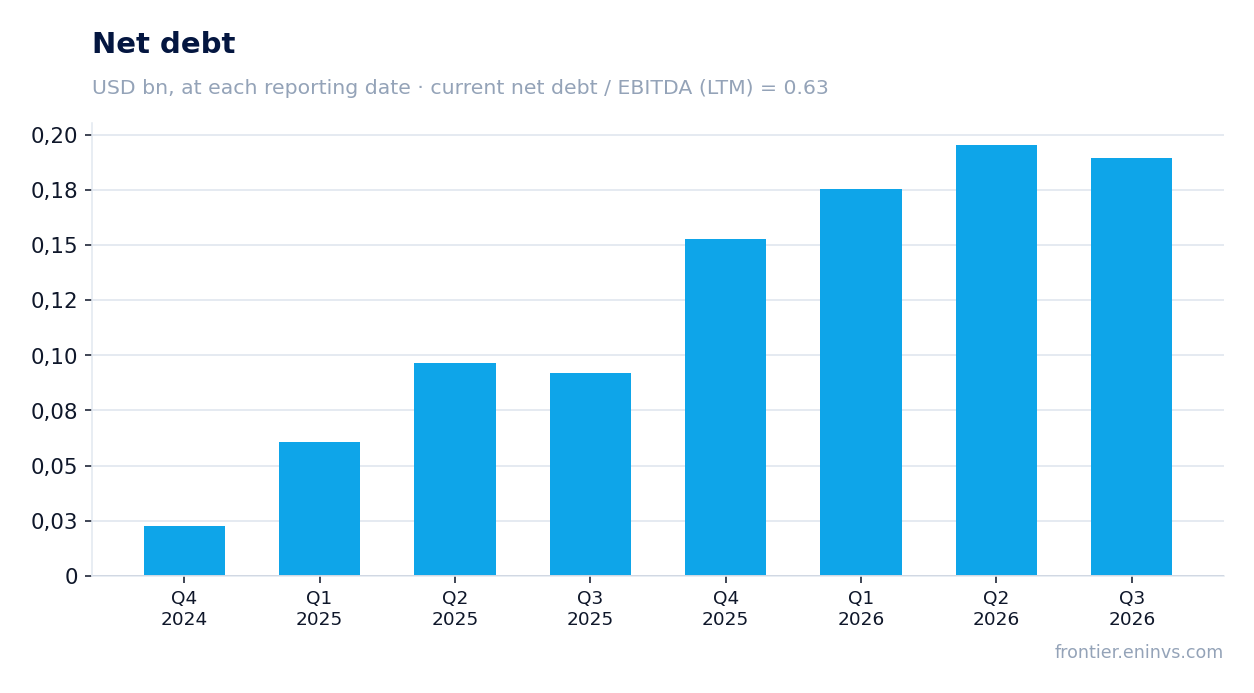
— Net debt is 0.2 billion with a net debt/EBITDA LTM of 0.63 – leverage is moderate
— The dividend yield is 8.2%, supported by LTM net profit of 244.2 million
— The 11.6 EV/EBITDA LTM multiple is 15% above its own three-year average of 10.1
Attractiveness
Key figures, USD bn
| Metric | Q3 2025 | Q3 2026 | Change |
|---|---|---|---|
| Revenue | 0.11 | 0.13 | +23.5% |
| EBITDA | 0.08 | 0.07 | -13.5% |
| Operating profit | 0.07 | 0.06 | -15.9% |
| Net profit | 0.09 | 0.05 | -42.9% |
| Operating cash flow | 0.10 | 0.10 | +2.6% |
| Capex | 0.00 | — | — |
| EBITDA margin | 72.9% | 51.1% | -21.8 pp |
| Net margin | 87.2% | 40.3% | -46.9 pp |
Revenue rose 23.5% year on year, an acceleration from +14.4% a quarter earlier
In the third quarter of 2026 revenue was USD 129.9 million, 23.5% more than a year earlier. In the second quarter growth was 14.4%, so the pace accelerated. This is the highest quarterly growth in the available history: +7.5% in the first quarter and minus 8.7% in the fourth quarter of 2025.
The acceleration rests on a low base in the third quarter of 2025, when revenue was 105.2 million. There is sequential growth too: revenue was 122.1 million a quarter earlier, so it added 7.8 million over three months. Trailing twelve-month revenue is 471.1 million, and the quarter came in well above the average level.
For a holder the point is not the acceleration itself but that it does not carry through to profit. Revenue is growing faster than the company earns, and the next section shows where the difference is lost.
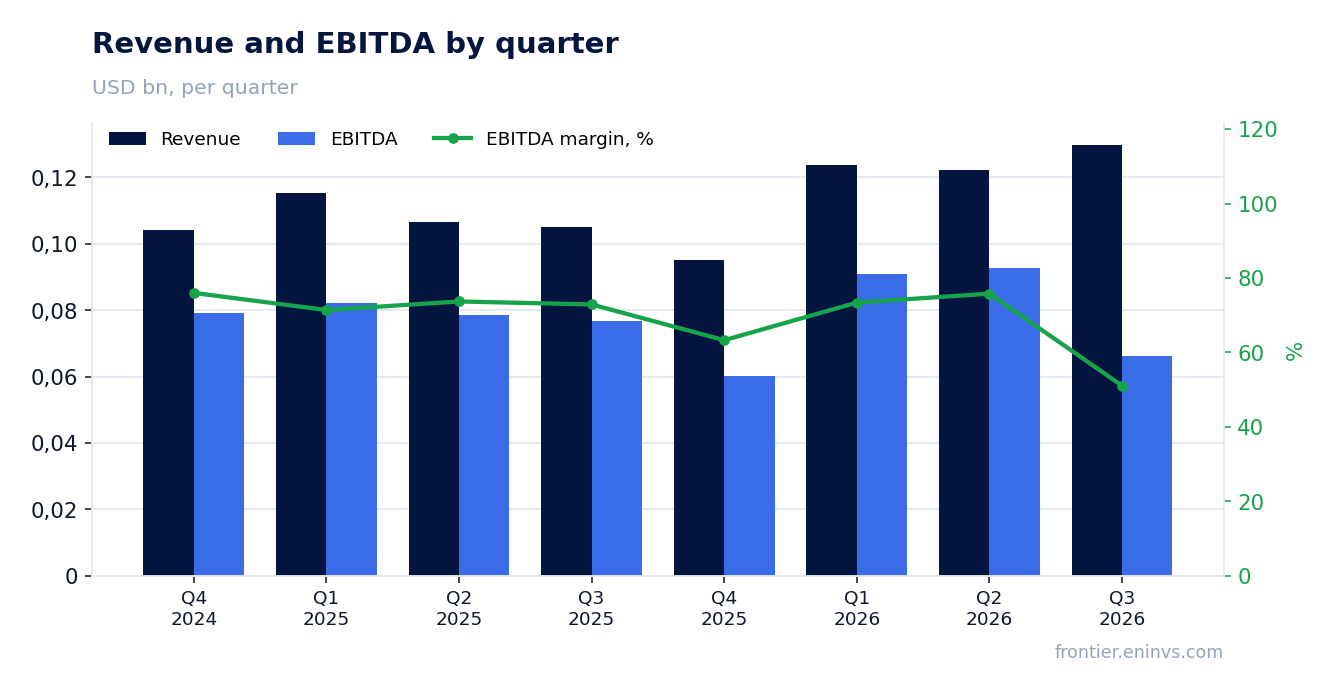
EBITDA fell 13.5% and its margin compressed from 72.9% to 51.1% – revenue growth did not reach profit
EBITDA for the third quarter of 2026 was USD 66.3 million against 76.7 million a year earlier, a fall of 13.5%. The EBITDA margin declined from 72.9% to 51.1%. Revenue grew 23.5%, so costs rose faster than income.
Operating profit was 56.2 million, 10.1 million below EBITDA – that is depreciation. A year earlier operating profit was 66.8 million on EBITDA of 76.7 million, so the gap between them barely changed. The compression happened above operating profit, in EBITDA itself.
A 51.1% margin is still high in absolute terms, but the fall from 72.9% is 21.8 percentage points in a year. That gap explains why profit per share is not rising despite record revenue growth.
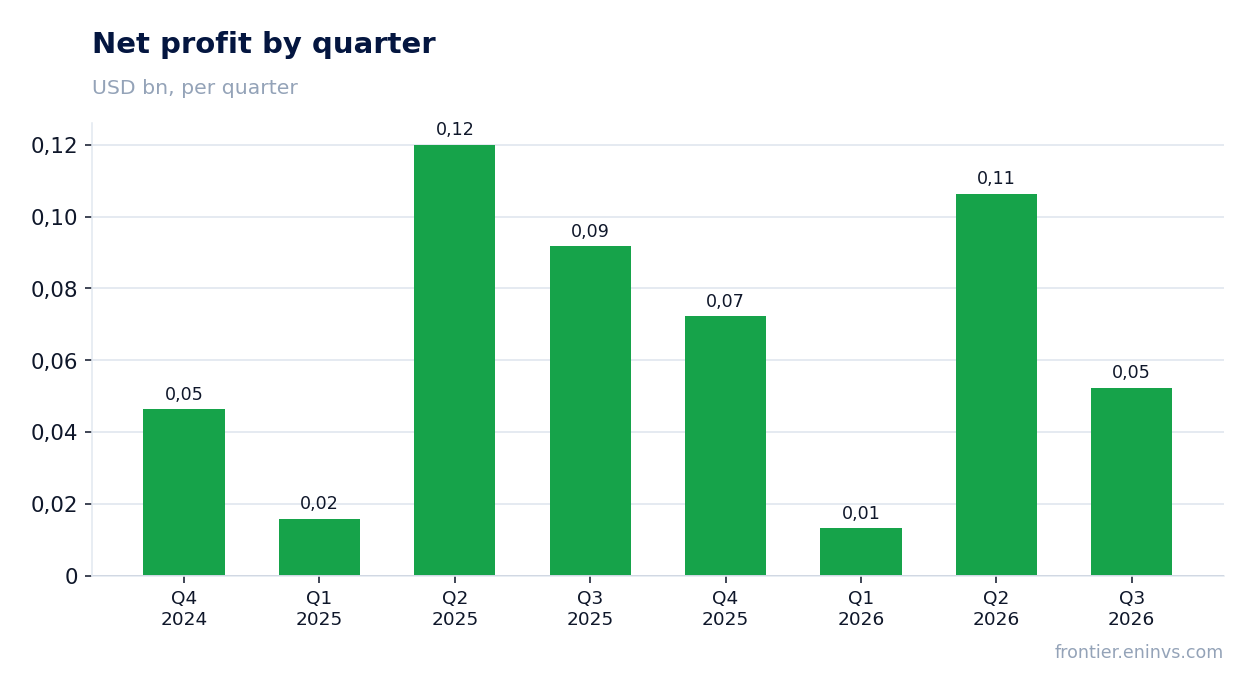
Net profit shrank 42.9%, with its margin down from 87.2% to 40.3%
Net profit for the third quarter of 2026 was USD 52.4 million against 91.7 million a year earlier, down 42.9%. The net margin fell from 87.2% to 40.3%. The profit fall is deeper than the EBITDA fall, so a factor below the operating line was added.
A year earlier net profit of 91.7 million was above operating profit of 66.8 million – a 24.9 million difference came from lines below operating profit. In the third quarter of 2026 net profit of 52.4 million is 3.8 million below operating profit of 56.2 million. The reversal of that gap by 28.7 million explains most of the profit decline.
Over the last twelve months net profit was 244.2 million. Quarterly results swing widely: 13.3 million in the first quarter of 2026, 106.4 million in the second, 52.4 million in the third. That volatility matters for the dividend discussed below.
Operating cash flow for the quarter was 102.4 million and covered EBITDA of 66.3 million
Operating cash flow for the third quarter of 2026 was USD 102.4 million, above EBITDA of 66.3 million. The 36.1 million excess means working capital released cash rather than absorbing it. A year earlier the flow was 99.8 million on EBITDA of 76.7 million.
Over the last twelve months operating cash flow was 323.0 million against EBITDA of 300.2 million. The company steadily converts profit into cash: LTM flow exceeds LTM EBITDA by 22.8 million.
Capital expenditure for the third quarter is not disclosed. In previous quarters it was small and uneven: 0.2 million in the first quarter of 2026, 34.4 million in the second, 55.3 million in the fourth quarter of 2025. At that level of capex free cash flow stays positive and covers the payouts.
Net debt is 0.2 billion with a net debt/EBITDA LTM of 0.63 – leverage is moderate
As of 30 September 2026 net debt was USD 0.2 billion. On 30 June 2026 it was 0.2 billion, so it barely changed over the quarter. A year earlier, on 30 September 2025, it was 0.1 billion, and over twelve months it rose by 0.1 billion.
The ratio of net debt to LTM EBITDA is 0.63. That is a low level: debt is less than LTM EBITDA of 300.2 million by more than one and a half times. At such leverage interest does not pressure profit.
A 0.1 billion increase in debt over the year with operating cash flow of 323.0 million over twelve months means the money went to shareholder payouts and capital expenditure. For a company whose flow covers EBITDA, such debt is not a constraint.
The dividend yield is 8.2%, supported by LTM net profit of 244.2 million
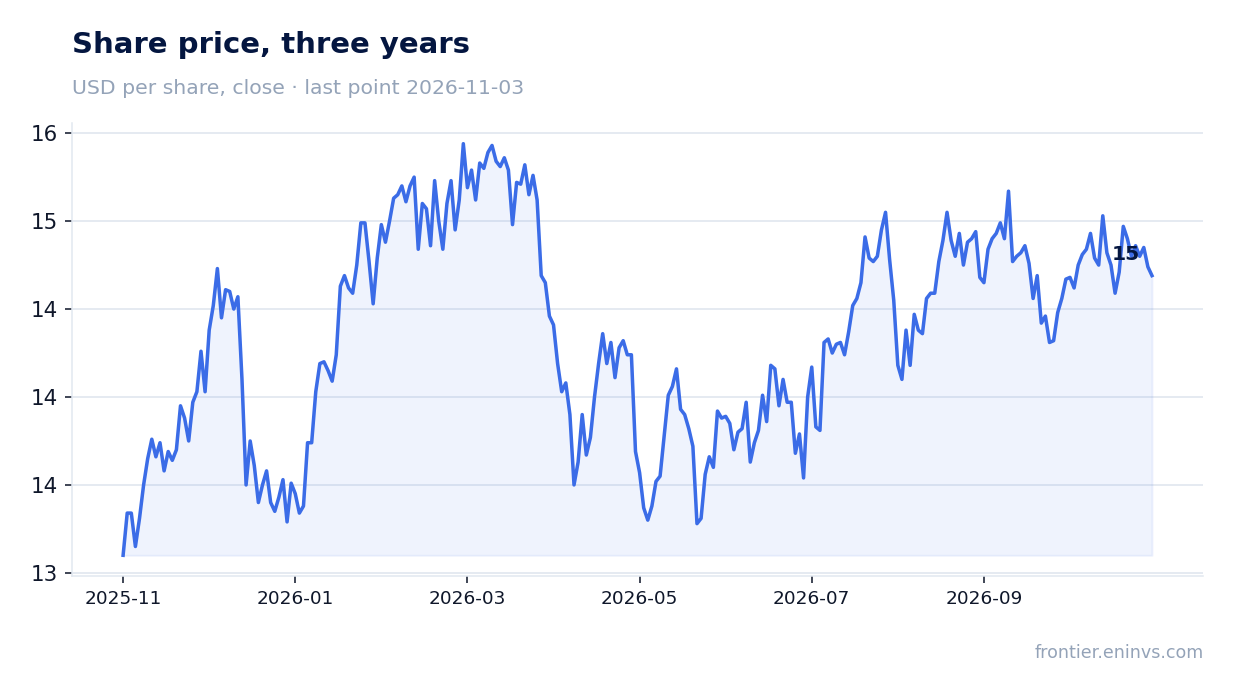
The trailing twelve-month dividend yield is 8.2% at the current price. Payouts rest on LTM net profit of 244.2 million and operating cash flow of 323.0 million. With capital expenditure that reached 55.3 million in some quarters, free cash flow remains sufficient to cover the payouts.
Our estimate of the current-year dividend starts from LTM profit of 244.2 million and the established 8.2% yield. It hinges on two things: profit holding at the level of the last twelve months and no large one-off capital expenditure. Quarterly profit is highly uneven – from 13.3 million in the first quarter of 2026 to 106.4 million in the second – and the full-year payout depends on which quarter turns out weak.
A yield of 8.2% is well above what risk-free instruments offer, but it does not offset the margin compression. If EBITDA keeps falling at the same pace, LTM profit of 244.2 million will decline and the payout will shrink. Higher capital expenditure could also cut the dividend: it was 55.3 million in the fourth quarter of 2025.
For a holder the dividend is the main argument for the stock, but it does not settle the question of price. At a multiple above its own history, an 8.2% yield looks fair rather than generous.
The 11.6 EV/EBITDA LTM multiple is 15% above its own three-year average of 10.1
At an EV/EBITDA LTM of 11.6 the stock trades above its three-year average of 10.1 – by 15%. That means the market is paying more for current EBITDA than it paid on average over the past three years, even though EBITDA is falling.
P/E LTM is 13.7 on LTM profit of 244.2 million and a market capitalisation of 3.34 billion. Return on equity of 26.1% remains high. The combination of P/E 13.7 and EV/EBITDA 11.6 shows that leverage is low and does not distort the valuation.
On the portal's model, which reprices EBITDA at current commodity prices at the target EV/EBITDA, the share sits 68% below fair value. This is our own estimate, not a market consensus. It indicates that at current commodity prices the company's modelled profit is materially below what the share price implies.
Valuation on the latest reported figures
| Metric | Value |
|---|---|
| Market cap | 3.34 bn USD |
| P/E (LTM) | 13.7 |
| EV/EBITDA (LTM) | 11.6 |
| P/B | 4.04 |
| Net debt / EBITDA (LTM) | 0.63 |
| Operating cash flow (LTM) | 0.32 bn |
| ROE | 26.1% |
| Dividend yield (12m) | 8.2% |
| EV/EBITDA, 3-year average | 10.1 |
Bottom line
The strong side of the quarter remains revenue: USD 129.9 million and growth accelerating to 23.5% from 14.4% a quarter earlier. But EBITDA fell 13.5% with the margin compressing from 72.9% to 51.1%, and net profit dropped 42.9%, so revenue growth did not reach profit. The cash is there: operating flow of 102.4 million exceeded EBITDA of 66.3 million, net debt is 0.2 billion at a net debt/EBITDA LTM of 0.63, and the dividend yield is 8.2%. The question for a holder is now price: 11.6 EV/EBITDA LTM is 15% above its own three-year average of 10.1, and on the portal's model the share sits 68% below fair value. The verdict is rather unattractive: the dividend does not offset the margin compression at a multiple above its own history.
Open the company's financial profile BSM →
See also: market overview · valuation map · stock screeners