B2Gold: Q2 profit up 2.7x while cash flow turned negative
On August 25, B2Gold released its Q2 2026 results. Revenue rose 14.0% year-on-year to $789.4 million, EBITDA added 3.6% to $408.2 million, and net profit jumped 170.3% to $417.3 million. At the same time, operating cash flow turned negative at -$78.8 million, and the EBITDA margin fell to 51.7% from 56.9% a year earlier. The share looks attractive: the EV/EBITDA multiple of 3.67 is below its own history, and the portal's model puts the upside to fair value at +65%.
Key takeaways
— Revenue grew 14.0% year-on-year, a sharp deceleration from 117.7% in the prior quarter
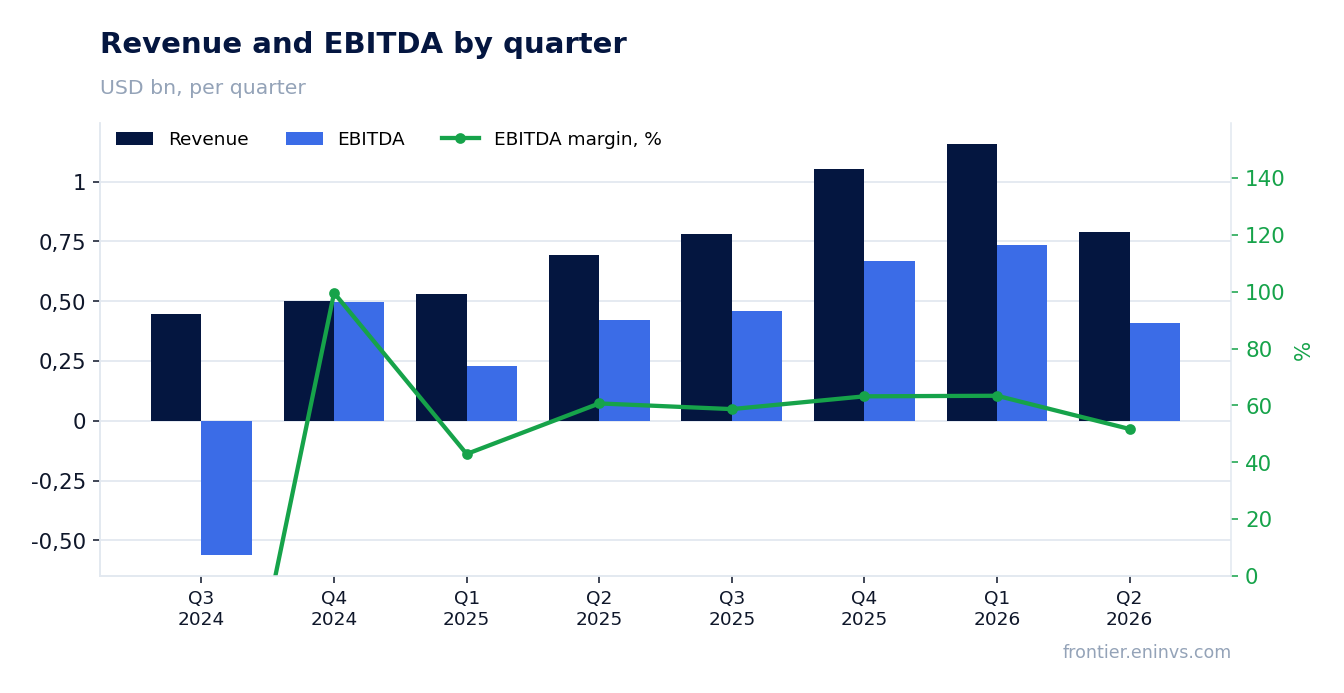
— EBITDA added just 3.6%, and the margin fell to 51.7% from 56.9% — cost growth outpaced the rise in gold prices
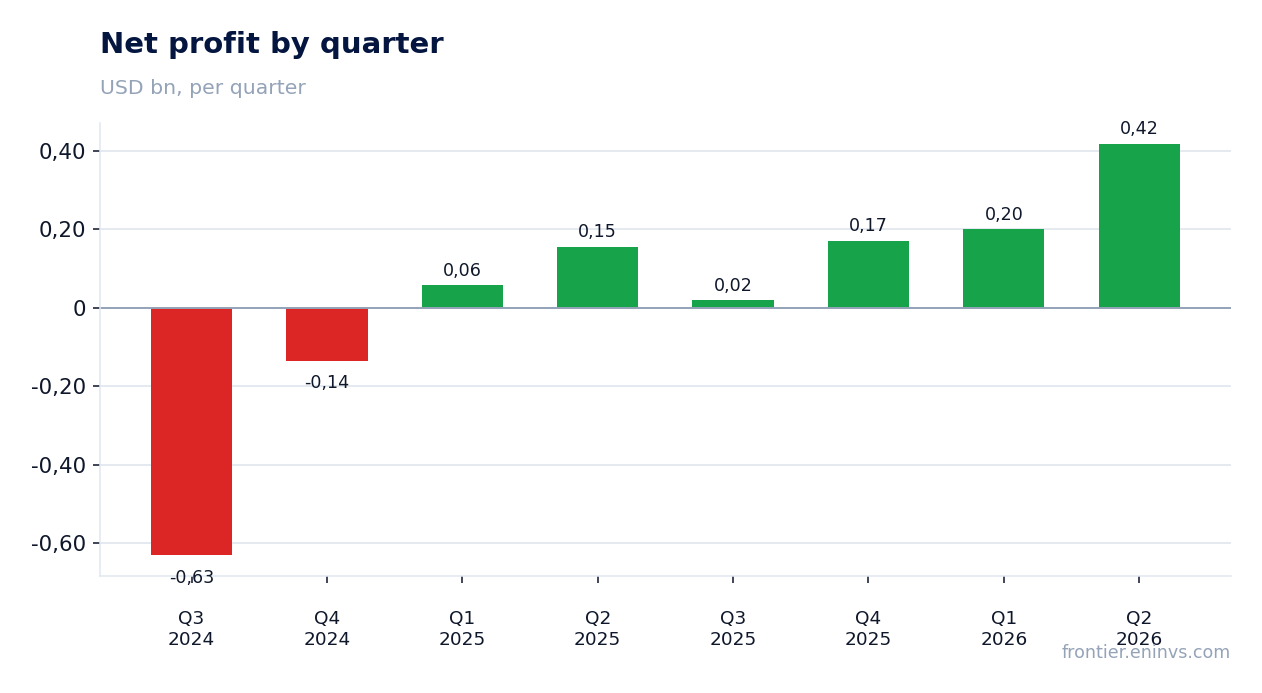
— Net profit jumped 170.3% to $417.3 million, but operating cash flow turned negative at -$78.8 million
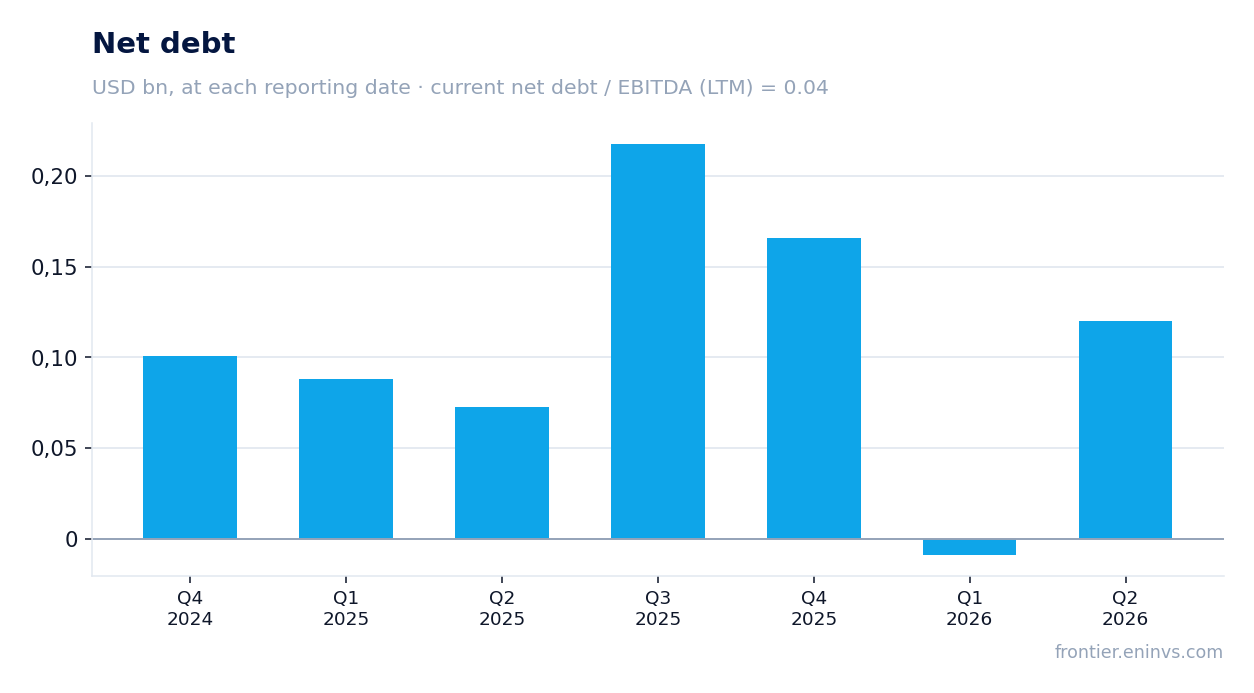
— Leverage remains minimal: net debt of $100.9 million, or 0.04x LTM EBITDA
— Dividend yield of 0.72% with a payout that could rise alongside profit
— EV/EBITDA of 3.67 and P/E of 10.16 — the stock trades below its historical valuation, and the portal's model implies +65% upside
Attractiveness
Key figures, USD bn
| Metric | Q2 2025 | Q2 2026 | Change |
|---|---|---|---|
| Revenue | 0.69 | 0.79 | +14.0% |
| EBITDA | 0.39 | 0.41 | +3.6% |
| Operating profit | 0.32 | 0.29 | -9.5% |
| Net profit | 0.15 | 0.42 | +170.3% |
| Operating cash flow | 0.26 | -0.08 | -130.9% |
| Capex | 0.24 | — | — |
| EBITDA margin | 56.9% | 51.7% | -5.2 pp |
| Net margin | 22.3% | 52.9% | +30.6 pp |
Revenue grew 14.0% year-on-year, a sharp deceleration from 117.7% in the prior quarter
In Q2 2026, B2Gold's revenue reached $789.4 million, up 14.0% year-on-year. This marks a notable deceleration from the first quarter, when growth hit 117.7%. The main reason is the high base effect: in Q2 2025, revenue had already jumped 40.5%, whereas in Q1 2025 growth was only 15.3%.
The sequential decline from Q1 2026 ($1,158.7 million) is explained by both seasonality and a possible drop in sales volumes. The company does not disclose details, but the quarter-on-quarter dynamics suggest that the revenue peak likely occurred in the first quarter. For investors, the key point is that annual growth persists, albeit slower.
EBITDA added just 3.6%, and the margin fell to 51.7% from 56.9% — cost growth outpaced the rise in gold prices
EBITDA in Q2 2026 was $408.2 million, up only 3.6% year-on-year. At the same time, the EBITDA margin fell to 51.7% from 56.9% a year earlier. This means costs grew faster than revenue, putting pressure on operating efficiency.
Operating profit also grew more modestly than revenue, reaching $287.1 million. The margin decline could be due to higher production costs, increased energy expenses, or a change in sales mix. The company does not provide details, but the fact remains: profitability fell by 5.2 percentage points.
Net profit jumped 170.3% to $417.3 million, but operating cash flow turned negative at -$78.8 million
Net profit in Q2 2026 was $417.3 million, up 170.3% year-on-year. However, operating cash flow was negative at -$78.8 million. Such a gap between profit and cash flow is usually linked to one-off factors: possibly changes in working capital, tax payments, or inventory revaluation.
For comparison, a year earlier operating cash flow was positive at $255.1 million. The sharp deterioration raises questions about the quality of earnings. If the gap persists, it could limit the company's ability to fund investments and dividends from internal sources.
Leverage remains minimal: net debt of $100.9 million, or 0.04x LTM EBITDA
Net debt at the latest reporting date was $100.9 million, corresponding to a net debt to LTM EBITDA ratio of 0.04. This is an extremely low figure, indicating virtually no debt burden. For comparison, LTM EBITDA was $2,263.0 million.
The change in net debt over the quarter was insignificant: +0.1 billion rubles, and over 12 months: +0.0 billion rubles. Low leverage gives the company financial flexibility, but also means it is not using borrowed funds to accelerate growth.
Dividend yield of 0.72% with a payout that could rise alongside profit
The dividend yield over the last 12 months is 0.72%. This is a modest figure, explained by a low payout ratio. The company directs only a portion of profit to dividends, preferring to retain funds for development. With LTM net profit of $807.2 million and a market capitalisation of $8,204.0 million, the yield could be higher under a more generous policy.
Our estimate: the dividend could rise this year if the company increases its payout ratio or if profit continues to grow. However, the sustainability of the payout depends on the ability to generate cash flow, which was negative in the last quarter. If operating cash flow remains under pressure, the dividend could be revised downwards.
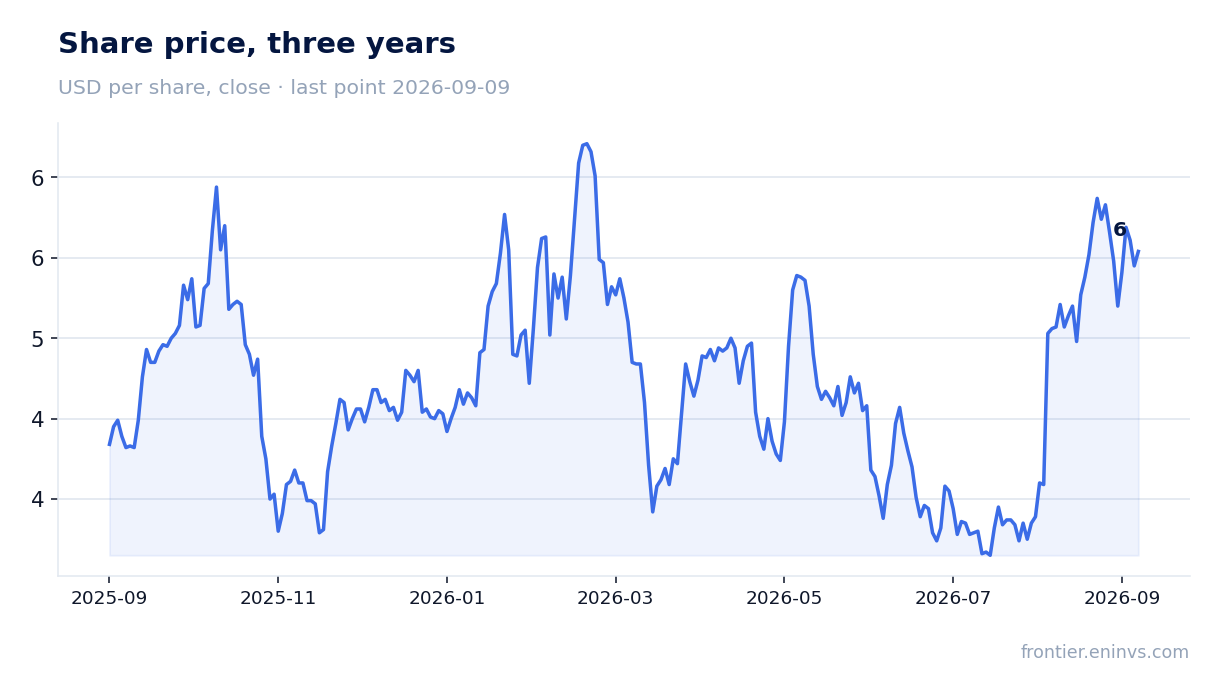
EV/EBITDA of 3.67 and P/E of 10.16 — the stock trades below its historical valuation, and the portal's model implies +65% upside
The LTM EV/EBITDA multiple is 3.67, and P/E is 10.16. Both figures look low in absolute terms and relative to the company's own history. For comparison, in previous years the valuation was higher, making the current level attractive for entry.
According to the portal's model, the upside to fair value is estimated at +65%. This is our own estimate, based on re-pricing EBITDA at current commodity prices and a target EV/EBITDA multiple. The market, judging by the current price, is pricing in a more conservative scenario for gold prices or operating performance.
Valuation on the latest reported figures
| Metric | Value |
|---|---|
| Market cap | 8.20 bn USD |
| P/E (LTM) | 10.2 |
| EV/EBITDA (LTM) | 3.7 |
| P/B | 2.75 |
| Net debt / EBITDA (LTM) | 0.04 |
| Operating cash flow (LTM) | 0.92 bn |
| ROE | 43.7% |
| Dividend yield (12m) | 0.7% |
Bottom line
Bottom line: B2Gold showed strong net profit growth, but the quality of that profit is questionable due to negative operating cash flow. EBITDA margin declined, and revenue growth slowed. However, low leverage and an attractive valuation (EV/EBITDA 3.67, P/E 10.16) make the stock interesting. The portal's model implies +65% upside. Verdict: the share looks attractive, but the key factor remains the recovery of cash flow.
Open the company's financial profile BTG →
See also: market overview · valuation map · stock screeners