B2Gold: gold rose 23% but EBITDA grew only 1.9% – volumes and costs ate the price
Contents
On 11 November B2Gold released its third-quarter 2026 results. The average gold price in the period was 4268 USD/oz against 3459 USD a year earlier (+23.4%), yet revenue rose only 6.8% to 836.5 mn USD and EBITDA only 1.9% to 467.9 mn USD. At the year-ago volumes and costs, our calculation shows the price should have produced 633.4 mn USD of EBITDA, so the company fell 165.4 mn USD short (–26.1%). Our conclusion: rather attractive – the portal model implies +43% upside, even though the quarter showed that price alone no longer delivers profit. Our view: the share is rather attractive at the current price; upside on the portal model +43%.
Our view: is there upside
Our view in numbers
| Metric | Our read |
|---|---|
| Verdict | Rather attractive |
| Upside on the portal model | +43% |
| How the model works | spot model: EBITDA re-priced to current commodity prices at the target EV/EBITDA, against market cap |
| Dividend yield, 12m | 1.1% |
| Net debt / EBITDA | 0.09 – low leverage |
| Strongest case for | The portal model implies +43% upside at current gold prices, and net debt is only 0.09 of EBITDA. |
| Strongest case against | With gold 23.4% higher year on year, EBITDA grew only 1.9% and revenue decelerated to 6.8% – operationally the company fell 165.4 mn USD short. |
| What would change the view | A return of gold above 4268 USD/oz with recovering volumes would lift the verdict a step; a sustained move below 4000 USD would lower it. |
Key takeaways
— Gold averaged 4268 USD/oz – 23.4% above a year earlier but already 5.5% below the previous quarter
— At the year-ago volumes and costs our calculation puts EBITDA at 633.4 mn USD; reported was 467.9 mn – a gap of 165.4 mn
— Revenue grew only 6.8% after +14.0% the quarter before – a deceleration despite higher gold
— The EBITDA margin fell to 55.9% from 58.7%, and price does not explain it – volumes and unit costs do
— Net profit of 408.9 mn USD rose 21-fold not on EBITDA but on items below operating profit
— Leverage is low: net debt of 203.0 mn USD against LTM EBITDA of 2248.0 mn – a ratio of 0.09
— The portal spot model puts EBITDA at 1876 mn USD at current prices versus 2276.8 mn LTM – valuation should start from today's gold price
Key figures, USD bn
| Metric | Q3 2025 | Q3 2026 | Change |
|---|---|---|---|
| Revenue | 0.78 | 0.84 | +6.8% |
| EBITDA | 0.46 | 0.47 | +1.9% |
| Operating profit | 0.35 | 0.35 | -1.6% |
| Net profit | 0.02 | 0.41 | +2017.2% |
| Operating cash flow | 0.17 | 0.24 | +39.2% |
| Capex | 0.26 | — | — |
| EBITDA margin | 58.7% | 55.9% | -2.8 pp |
| Net margin | 2.5% | 48.9% | +46.4 pp |
Gold averaged 4268 USD/oz – 23.4% above a year earlier but already 5.5% below the previous quarter
The main external factor of the quarter was the gold price. In July–September 2026 an ounce averaged 4268 USD against 3459 USD a year earlier, up 23.4%. That is the backdrop against which the company reported.
Within the year, however, the price has already turned: the previous quarter averaged 4514 USD, 5.5% higher. On 11 November 2026 spot was 4045 USD, a further 5.2% below the reported-period average. For a producer that means next quarter's revenue will be measured from a lower base.
The portal model attributes 95% of B2Gold's revenue to gold, so the price is the main but not the only lever. The quarter showed that with a more expensive metal the company earned less than the price allowed.
Commodity prices: period average and now
| Benchmark | Year ago | Q3 2026 | YoY | Spot 2026-11-11 |
|---|---|---|---|---|
| Gold, USD | 3 459 | 4 268 | +23,4% | 4 045 |
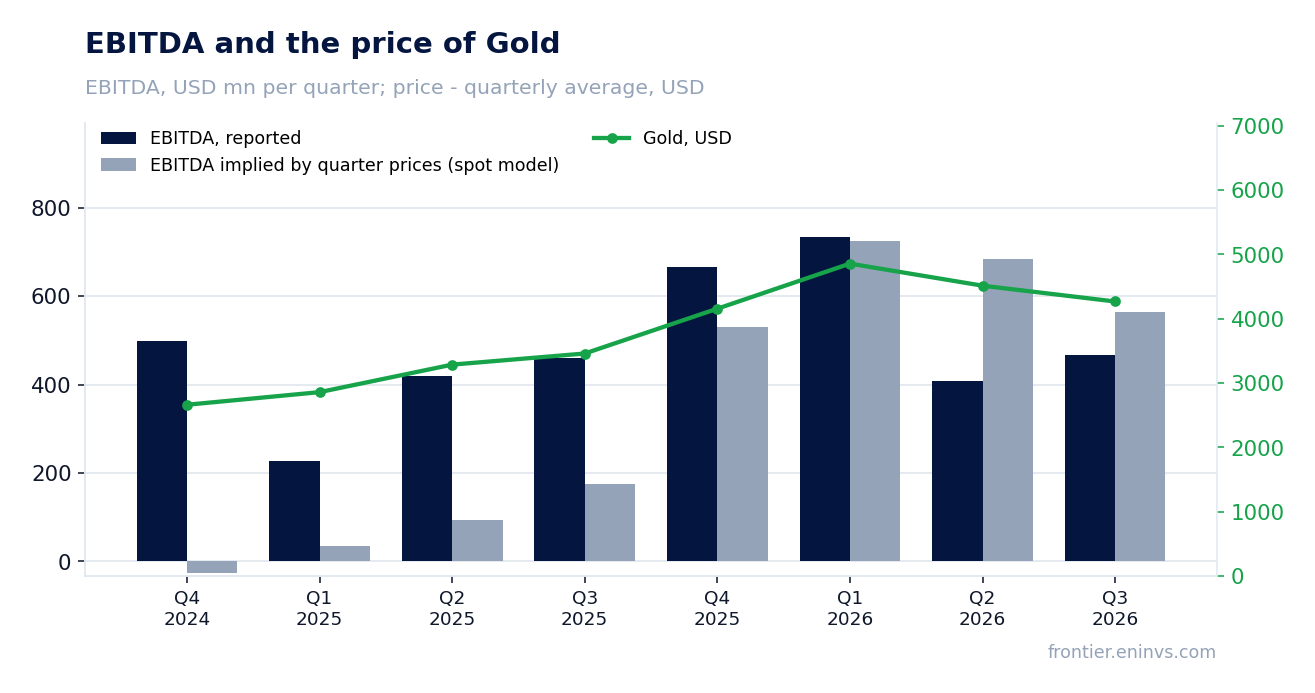
At the year-ago volumes and costs our calculation puts EBITDA at 633.4 mn USD; reported was 467.9 mn – a gap of 165.4 mn
Holding third-quarter 2025 volumes and non-commodity costs and moving only prices to the reported period, revenue should have been 957 mn USD – 174.0 mn, or 22.2%, above the actual. Reported revenue was 836.5 mn USD, 120.5 mn (–12.6%) below.
The EBITDA gap is wider: our calculation puts it at 633.4 mn USD against reported 467.9 mn, minus 165.4 mn, or 26.1%. That is the central question of the report: the price rose 23.4% while profitability fell.
The gap is explained by volumes and unit costs – the facts and the document give no other cause. The portal spot model, built from the average of the previous four quarters, expected EBITDA of 563 mn USD and revenue of 951.7 mn; the actual is 16.9% and 12.1% below. The model's deviation in the four prior periods was +161.8%, +25.9%, +1.2% and –40.3%, so its base is unstable.
What the prices implied and what the company earned
| Base (Q3 2025) | Implied at period prices | Reported | Reported vs implied | |
|---|---|---|---|---|
| Revenue, USD mn | 782,9 | 957,0 | 836,5 | -12,6% |
| EBITDA, USD mn | 459,4 | 633,4 | 467,9 | -26,1% |
| EBITDA, portal spot model, USD mn | — | 563,0 | 467,9 | -16,9% |
Revenue and EBITDA by quarter
| Period | Measure | bn USD |
|---|---|---|
| Q4 2024 | Revenue | 0.499788 |
| Q1 2025 | Revenue | 0.532107 |
| Q2 2025 | Revenue | 0.692206 |
| Q3 2025 | Revenue | 0.782948 |
| Q4 2025 | Revenue | 1.0539770000000002 |
| Q1 2026 | Revenue | 1.158655 |
| Q2 2026 | Revenue | 0.789354 |
| Q3 2026 | Revenue | 0.836466 |
| Q4 2024 | EBITDA | 0.498 |
| Q1 2025 | EBITDA | 0.228047 |
| Q2 2025 | EBITDA | 0.42001599999999994 |
| Q3 2025 | EBITDA | 0.45937300000000003 |
| Q4 2025 | EBITDA | 0.666375 |
| Q1 2026 | EBITDA | 0.734262 |
| Q2 2026 | EBITDA | 0.408232 |
| Q3 2026 | EBITDA | 0.46794 |
EBITDA margin
| Period | Measure | % |
|---|---|---|
| Q4 2024 | EBITDA margin | 99.6 |
| Q1 2025 | EBITDA margin | 42.9 |
| Q2 2025 | EBITDA margin | 60.7 |
| Q3 2025 | EBITDA margin | 58.7 |
| Q4 2025 | EBITDA margin | 63.2 |
| Q1 2026 | EBITDA margin | 63.4 |
| Q2 2026 | EBITDA margin | 51.7 |
| Q3 2026 | EBITDA margin | 55.9 |
Revenue grew only 6.8% after +14.0% the quarter before – a deceleration despite higher gold
In the third quarter of 2026 revenue was 836.5 mn USD, 6.8% above a year earlier. The previous quarter grew 14.0%, so the dynamics decelerated. For a company with 95% of revenue tied to gold, that is a direct consequence of sales volumes failing to support the price.
The deceleration is visible against the previous quarter too: at second-quarter volumes and costs and third-quarter prices, our calculation puts revenue at 748.4 mn USD, and the actual is 88.0 mn (+11.8%) above. So the company added sequentially, but the year-on-year growth is more modest than it was.
Gold rose 23.4% year on year while revenue rose 6.8%. The 16.6-percentage-point difference is the contribution of volumes and the realised price, which fell short of the benchmark.
The EBITDA margin fell to 55.9% from 58.7%, and price does not explain it – volumes and unit costs do
EBITDA in the reported quarter was 467.9 mn USD, a margin of 55.9% against 58.7% a year earlier. With gold up 23.4%, the margin should have expanded; instead it narrowed by 2.8 percentage points. That confirms the cause is not price but volumes and cost per ounce.
Operating profit was 348.9 mn USD and EBITDA 467.9 mn; the 119.1 mn difference is depreciation. It sits inside EBITDA and does not explain the margin move, but it shows operating profit grew slower than revenue.
The portal spot model puts annual EBITDA at 1876 mn USD at current prices against 2276.8 mn over the last twelve months – 17.6% less. Today's gold price no longer supports even the profit level the company showed in prior quarters.
Net profit of 408.9 mn USD rose 21-fold not on EBITDA but on items below operating profit
Net profit in the reported quarter was 408.9 mn USD against 19.3 mn a year earlier, up 2017.2%. The net margin was 48.9% against 2.5%. Operating results could not have produced such a jump: EBITDA grew only 1.9%.
The cause is items below operating profit: other income, interest, FX. Under our accounting they are excluded from EBITDA and explain net profit only. The facts do not disclose their size, so we cannot name the specific line – but it, not mining, made the quarter.
For an investor this means reported earnings per share look better than operating reality. The LTM P/E is 6.56, but it rests on profit with a significant non-operating component.
Leverage is low: net debt of 203.0 mn USD against LTM EBITDA of 2248.0 mn – a ratio of 0.09
As of 30 September 2026 B2Gold's net debt was 203.0 mn USD. Against LTM EBITDA of 2248.0 mn the net debt/EBITDA ratio is 0.09. That is a level at which debt is not a risk to the dividend or to investment.
Operating cash flow in the reported quarter was 238.6 mn USD. Against EBITDA of 467.9 mn it is roughly half: the difference goes to taxes, interest and working-capital changes. Over twelve months operating cash flow was 989.9 mn USD.
At current gold prices the portal spot model gives EBITDA of 1876 mn USD, and net debt to that is 0.11. Even on a lower base leverage stays low.
Share price, three years
close, last point 2026-11-10
| Period | Measure | USD per share |
|---|---|---|
| 2025-11-10 | Closing price | 4.090000152587891 |
| 2025-11-11 | Closing price | 4.110000133514404 |
| 2025-11-12 | Closing price | 4.179999828338623 |
| 2025-11-13 | Closing price | 4.099999904632568 |
| 2025-11-14 | Closing price | 4.099999904632568 |
| 2025-11-17 | Closing price | 3.990000009536743 |
| 2025-11-18 | Closing price | 3.990000009536743 |
| 2025-11-19 | Closing price | 3.9700000286102295 |
| 2025-11-20 | Closing price | 3.7899999618530273 |
| 2025-11-21 | Closing price | 3.809999942779541 |
| 2025-11-24 | Closing price | 4.170000076293945 |
| 2025-11-25 | Closing price | 4.329999923706055 |
| 2025-11-26 | Closing price | 4.46999979019165 |
| 2025-11-28 | Closing price | 4.619999885559082 |
| 2025-12-01 | Closing price | 4.599999904632568 |
| 2025-12-02 | Closing price | 4.429999828338623 |
| 2025-12-03 | Closing price | 4.5 |
| 2025-12-04 | Closing price | 4.559999942779541 |
| 2025-12-05 | Closing price | 4.559999942779541 |
| 2025-12-08 | Closing price | 4.480000019073486 |
| 2025-12-09 | Closing price | 4.570000171661377 |
| 2025-12-10 | Closing price | 4.679999828338623 |
| 2025-12-11 | Closing price | 4.679999828338623 |
| 2025-12-12 | Closing price | 4.599999904632568 |
| 2025-12-15 | Closing price | 4.619999885559082 |
| 2025-12-16 | Closing price | 4.550000190734863 |
| 2025-12-17 | Closing price | 4.570000171661377 |
| 2025-12-18 | Closing price | 4.489999771118164 |
| 2025-12-19 | Closing price | 4.539999961853027 |
| 2025-12-22 | Closing price | 4.800000190734863 |
| 2025-12-23 | Closing price | 4.769999980926514 |
| 2025-12-24 | Closing price | 4.730000019073486 |
| 2025-12-26 | Closing price | 4.800000190734863 |
| 2025-12-29 | Closing price | 4.539999961853027 |
| 2025-12-30 | Closing price | 4.559999942779541 |
| 2025-12-31 | Closing price | 4.510000228881836 |
| 2026-01-02 | Closing price | 4.5 |
| 2026-01-05 | Closing price | 4.550000190734863 |
| 2026-01-06 | Closing price | 4.53000020980835 |
| 2026-01-07 | Closing price | 4.420000076293945 |
| 2026-01-08 | Closing price | 4.5 |
| 2026-01-09 | Closing price | 4.570000171661377 |
| 2026-01-12 | Closing price | 4.679999828338623 |
| 2026-01-13 | Closing price | 4.590000152587891 |
| 2026-01-14 | Closing price | 4.659999847412109 |
| 2026-01-15 | Closing price | 4.630000114440918 |
| 2026-01-16 | Closing price | 4.579999923706055 |
| 2026-01-20 | Closing price | 4.909999847412109 |
| 2026-01-21 | Closing price | 4.929999828338623 |
| 2026-01-22 | Closing price | 5.199999809265137 |
| 2026-01-23 | Closing price | 5.289999961853027 |
| 2026-01-26 | Closing price | 5.340000152587891 |
| 2026-01-27 | Closing price | 5.53000020980835 |
| 2026-01-28 | Closing price | 5.769999980926514 |
| 2026-01-29 | Closing price | 5.550000190734863 |
| 2026-01-30 | Closing price | 4.900000095367432 |
| 2026-02-02 | Closing price | 4.889999866485596 |
| 2026-02-03 | Closing price | 5.019999980926514 |
| 2026-02-04 | Closing price | 5.050000190734863 |
| 2026-02-05 | Closing price | 4.71999979019165 |
| 2026-02-06 | Closing price | 5.059999942779541 |
| 2026-02-09 | Closing price | 5.440000057220459 |
| 2026-02-10 | Closing price | 5.619999885559082 |
| 2026-02-11 | Closing price | 5.630000114440918 |
| 2026-02-12 | Closing price | 5.019999980926514 |
| 2026-02-13 | Closing price | 5.400000095367432 |
| 2026-02-17 | Closing price | 5.25 |
| 2026-02-18 | Closing price | 5.380000114440918 |
| 2026-02-19 | Closing price | 5.119999885559082 |
| 2026-02-20 | Closing price | 5.389999866485596 |
| 2026-02-23 | Closing price | 5.739999771118164 |
| 2026-02-24 | Closing price | 6.090000152587891 |
| 2026-02-25 | Closing price | 6.199999809265137 |
| 2026-02-26 | Closing price | 6.210000038146973 |
| 2026-02-27 | Closing price | 6.159999847412109 |
| 2026-03-02 | Closing price | 6.010000228881836 |
| 2026-03-03 | Closing price | 5.489999771118164 |
| 2026-03-04 | Closing price | 5.46999979019165 |
| 2026-03-05 | Closing price | 5.210000038146973 |
| 2026-03-06 | Closing price | 5.320000171661377 |
| 2026-03-09 | Closing price | 5.269999980926514 |
| 2026-03-10 | Closing price | 5.369999885559082 |
| 2026-03-11 | Closing price | 5.25 |
| 2026-03-12 | Closing price | 5.099999904632568 |
| 2026-03-13 | Closing price | 4.849999904632568 |
| 2026-03-16 | Closing price | 4.840000152587891 |
| 2026-03-17 | Closing price | 4.840000152587891 |
| 2026-03-18 | Closing price | 4.599999904632568 |
| 2026-03-19 | Closing price | 4.210000038146973 |
| 2026-03-20 | Closing price | 3.9200000762939453 |
| 2026-03-23 | Closing price | 4.079999923706055 |
| 2026-03-24 | Closing price | 4.119999885559082 |
| 2026-03-25 | Closing price | 4.190000057220459 |
| 2026-03-26 | Closing price | 4.090000152587891 |
| 2026-03-27 | Closing price | 4.25 |
| 2026-03-30 | Closing price | 4.21999979019165 |
| 2026-03-31 | Closing price | 4.53000020980835 |
| 2026-04-01 | Closing price | 4.840000152587891 |
| 2026-04-02 | Closing price | 4.730000019073486 |
| 2026-04-06 | Closing price | 4.639999866485596 |
| 2026-04-07 | Closing price | 4.739999771118164 |
| 2026-04-08 | Closing price | 4.889999866485596 |
| 2026-04-09 | Closing price | 4.880000114440918 |
| 2026-04-10 | Closing price | 4.929999828338623 |
| 2026-04-13 | Closing price | 4.860000133514404 |
| 2026-04-14 | Closing price | 4.940000057220459 |
| 2026-04-15 | Closing price | 4.920000076293945 |
| 2026-04-16 | Closing price | 4.940000057220459 |
| 2026-04-17 | Closing price | 5.0 |
| 2026-04-20 | Closing price | 4.940000057220459 |
| 2026-04-21 | Closing price | 4.71999979019165 |
| 2026-04-22 | Closing price | 4.860000133514404 |
| 2026-04-23 | Closing price | 4.949999809265137 |
| 2026-04-24 | Closing price | 4.96999979019165 |
| 2026-04-27 | Closing price | 4.539999961853027 |
| 2026-04-28 | Closing price | 4.389999866485596 |
| 2026-04-29 | Closing price | 4.309999942779541 |
| 2026-04-30 | Closing price | 4.5 |
| 2026-05-01 | Closing price | 4.360000133514404 |
| 2026-05-04 | Closing price | 4.28000020980835 |
| 2026-05-05 | Closing price | 4.239999771118164 |
| 2026-05-06 | Closing price | 4.480000019073486 |
| 2026-05-07 | Closing price | 4.949999809265137 |
| 2026-05-08 | Closing price | 5.300000190734863 |
| 2026-05-11 | Closing price | 5.389999866485596 |
| 2026-05-12 | Closing price | 5.380000114440918 |
| 2026-05-13 | Closing price | 5.360000133514404 |
| 2026-05-14 | Closing price | 5.199999809265137 |
| 2026-05-15 | Closing price | 4.900000095367432 |
| 2026-05-18 | Closing price | 4.699999809265137 |
| 2026-05-19 | Closing price | 4.619999885559082 |
| 2026-05-20 | Closing price | 4.670000076293945 |
| 2026-05-21 | Closing price | 4.630000114440918 |
| 2026-05-22 | Closing price | 4.579999923706055 |
| 2026-05-26 | Closing price | 4.699999809265137 |
| 2026-05-27 | Closing price | 4.519999980926514 |
| 2026-05-28 | Closing price | 4.599999904632568 |
| 2026-05-29 | Closing price | 4.760000228881836 |
| 2026-06-01 | Closing price | 4.659999847412109 |
| 2026-06-02 | Closing price | 4.71999979019165 |
| 2026-06-03 | Closing price | 4.550000190734863 |
| 2026-06-04 | Closing price | 4.579999923706055 |
| 2026-06-05 | Closing price | 4.179999828338623 |
| 2026-06-08 | Closing price | 4.139999866485596 |
| 2026-06-09 | Closing price | 4.019999980926514 |
| 2026-06-10 | Closing price | 3.880000114440918 |
| 2026-06-11 | Closing price | 4.090000152587891 |
| 2026-06-12 | Closing price | 4.210000038146973 |
| 2026-06-15 | Closing price | 4.46999979019165 |
| 2026-06-16 | Closing price | 4.570000171661377 |
| 2026-06-17 | Closing price | 4.409999847412109 |
| 2026-06-18 | Closing price | 4.300000190734863 |
| 2026-06-22 | Closing price | 4.199999809265137 |
| 2026-06-23 | Closing price | 4.010000228881836 |
| 2026-06-24 | Closing price | 3.890000104904175 |
| 2026-06-25 | Closing price | 3.9600000381469727 |
| 2026-06-26 | Closing price | 3.940000057220459 |
| 2026-06-29 | Closing price | 3.7899999618530273 |
| 2026-06-30 | Closing price | 3.740000009536743 |
| 2026-07-01 | Closing price | 3.819999933242798 |
| 2026-07-02 | Closing price | 4.079999923706055 |
| 2026-07-06 | Closing price | 4.050000190734863 |
| 2026-07-07 | Closing price | 3.940000057220459 |
| 2026-07-08 | Closing price | 3.7799999713897705 |
| 2026-07-09 | Closing price | 3.859999895095825 |
| 2026-07-10 | Closing price | 3.8499999046325684 |
| 2026-07-13 | Closing price | 3.7799999713897705 |
| 2026-07-14 | Closing price | 3.7899999618530273 |
| 2026-07-15 | Closing price | 3.799999952316284 |
| 2026-07-16 | Closing price | 3.6600000858306885 |
| 2026-07-17 | Closing price | 3.6700000762939453 |
| 2026-07-20 | Closing price | 3.6500000953674316 |
| 2026-07-21 | Closing price | 3.819999933242798 |
| 2026-07-22 | Closing price | 3.950000047683716 |
| 2026-07-23 | Closing price | 3.8399999141693115 |
| 2026-07-24 | Closing price | 3.869999885559082 |
| 2026-07-27 | Closing price | 3.869999885559082 |
| 2026-07-28 | Closing price | 3.8399999141693115 |
| 2026-07-29 | Closing price | 3.740000009536743 |
| 2026-07-30 | Closing price | 3.8499999046325684 |
| 2026-07-31 | Closing price | 3.75 |
| 2026-08-03 | Closing price | 3.8499999046325684 |
| 2026-08-04 | Closing price | 3.890000104904175 |
| 2026-08-05 | Closing price | 4.099999904632568 |
| 2026-08-06 | Closing price | 4.090000152587891 |
| 2026-08-07 | Closing price | 5.03000020980835 |
| 2026-08-10 | Closing price | 5.059999942779541 |
| 2026-08-11 | Closing price | 5.070000171661377 |
| 2026-08-12 | Closing price | 5.210000038146973 |
| 2026-08-13 | Closing price | 5.070000171661377 |
| 2026-08-14 | Closing price | 5.139999866485596 |
| 2026-08-17 | Closing price | 5.199999809265137 |
| 2026-08-18 | Closing price | 4.980000019073486 |
| 2026-08-19 | Closing price | 5.269999980926514 |
| 2026-08-20 | Closing price | 5.380000114440918 |
| 2026-08-21 | Closing price | 5.519999980926514 |
| 2026-08-24 | Closing price | 5.71999979019165 |
| 2026-08-25 | Closing price | 5.869999885559082 |
| 2026-08-26 | Closing price | 5.739999771118164 |
| 2026-08-27 | Closing price | 5.829999923706055 |
| 2026-08-28 | Closing price | 5.659999847412109 |
| 2026-08-31 | Closing price | 5.480000019073486 |
| 2026-09-01 | Closing price | 5.199999809265137 |
| 2026-09-02 | Closing price | 5.409999847412109 |
| 2026-09-03 | Closing price | 5.690000057220459 |
| 2026-09-04 | Closing price | 5.610000133514404 |
| 2026-09-08 | Closing price | 5.449999809265137 |
| 2026-09-09 | Closing price | 5.539999961853027 |
| 2026-09-10 | Closing price | 5.360000133514404 |
| 2026-09-11 | Closing price | 5.380000114440918 |
| 2026-09-14 | Closing price | 5.21999979019165 |
| 2026-09-15 | Closing price | 5.21999979019165 |
| 2026-09-16 | Closing price | 5.139999866485596 |
| 2026-09-17 | Closing price | 5.400000095367432 |
| 2026-09-18 | Closing price | 5.489999771118164 |
| 2026-09-21 | Closing price | 5.360000133514404 |
| 2026-09-22 | Closing price | 5.579999923706055 |
| 2026-09-23 | Closing price | 5.349999904632568 |
| 2026-09-24 | Closing price | 5.320000171661377 |
| 2026-09-25 | Closing price | 5.480000019073486 |
| 2026-09-28 | Closing price | 5.28000020980835 |
| 2026-09-29 | Closing price | 5.340000152587891 |
| 2026-09-30 | Closing price | 5.21999979019165 |
| 2026-10-01 | Closing price | 5.170000076293945 |
| 2026-10-02 | Closing price | 5.199999809265137 |
| 2026-10-05 | Closing price | 5.150000095367432 |
| 2026-10-06 | Closing price | 5.210000038146973 |
| 2026-10-07 | Closing price | 5.0 |
| 2026-10-08 | Closing price | 5.119999885559082 |
| 2026-10-09 | Closing price | 5.25 |
| 2026-10-12 | Closing price | 5.239999771118164 |
| 2026-10-13 | Closing price | 5.21999979019165 |
| 2026-10-14 | Closing price | 4.989999771118164 |
| 2026-10-15 | Closing price | 5.179999828338623 |
| 2026-10-16 | Closing price | 5.309999942779541 |
| 2026-10-19 | Closing price | 5.210000038146973 |
| 2026-10-20 | Closing price | 5.199999809265137 |
| 2026-10-21 | Closing price | 5.25 |
| 2026-10-22 | Closing price | 4.869999885559082 |
| 2026-10-23 | Closing price | 4.78000020980835 |
| 2026-10-26 | Closing price | 4.820000171661377 |
| 2026-10-27 | Closing price | 4.980000019073486 |
| 2026-10-28 | Closing price | 5.119999885559082 |
| 2026-10-29 | Closing price | 4.989999771118164 |
| 2026-10-30 | Closing price | 4.599999904632568 |
| 2026-11-02 | Closing price | 4.769999980926514 |
| 2026-11-03 | Closing price | 4.699999809265137 |
| 2026-11-04 | Closing price | 5.110000133514404 |
| 2026-11-05 | Closing price | 5.269999980926514 |
| 2026-11-06 | Closing price | 5.400000095367432 |
| 2026-11-09 | Closing price | 5.679999828338623 |
| 2026-11-10 | Closing price | 5.304999828338623 |
The portal spot model puts EBITDA at 1876 mn USD at current prices versus 2276.8 mn LTM – valuation should start from today's gold price
For a gold producer, LTM valuation rests on the prices of past quarters, which were higher than today's. The portal spot model re-prices EBITDA to today's price: 1876 mn USD against 2276.8 mn LTM, 17.6% less. EV/EBITDA at current prices is 4.3.
LTM multiples look cheaper: EV/EBITDA 3.54, P/E 6.56, ROE 39.2%. But LTM profit was earned at a higher gold price, so it cannot be the only anchor.
At current prices and the target EV/EBITDA the portal model implies +43% upside to fair value. That is our own estimate, not a market consensus. The trailing dividend yield is 1.13%, and it is not the main argument in this story.
Valuation on the latest reported figures
| Metric | Value |
|---|---|
| Market cap | 7.86 bn USD |
| P/E (LTM) | 6.6 |
| EV/EBITDA (LTM) | 3.5 |
| P/B | 2.63 |
| Net debt / EBITDA (LTM) | 0.09 |
| Operating cash flow (LTM) | 0.99 bn |
| ROE | 39.2% |
| Dividend yield (12m) | 1.1% |
Net profit by quarter
| Period | Measure | bn USD |
|---|---|---|
| Q4 2024 | Net profit | −0.009325 |
| Q1 2025 | Net profit | 0.057587000000000006 |
| Q2 2025 | Net profit | 0.154424 |
| Q3 2025 | Net profit | 0.019313 |
| Q4 2025 | Net profit | 0.170584 |
| Q1 2026 | Net profit | 0.199937 |
| Q2 2026 | Net profit | 0.417334 |
| Q3 2026 | Net profit | 0.40889800000000004 |
Bottom line
The strong side of the quarter remains the balance sheet: net debt of 203.0 mn USD at 0.09 of EBITDA and operating cash flow of 238.6 mn USD. Operationally, however, the company fell 165.4 mn USD short of what the gold price implied, and revenue growth decelerated to 6.8% from 14.0%. Net profit of 408.9 mn USD looks impressive, but it was made by items below operating profit, not by mining. The portal model implies +43% upside at current prices, which outweighs the weak quarter. Our conclusion: rather attractive – the portal model implies +43% upside. Our view: the share is rather attractive at the current price; upside on the portal model +43%.