Peabody Energy: coal prices rose a quarter, yet EBITDA came in 80% below what those prices implied
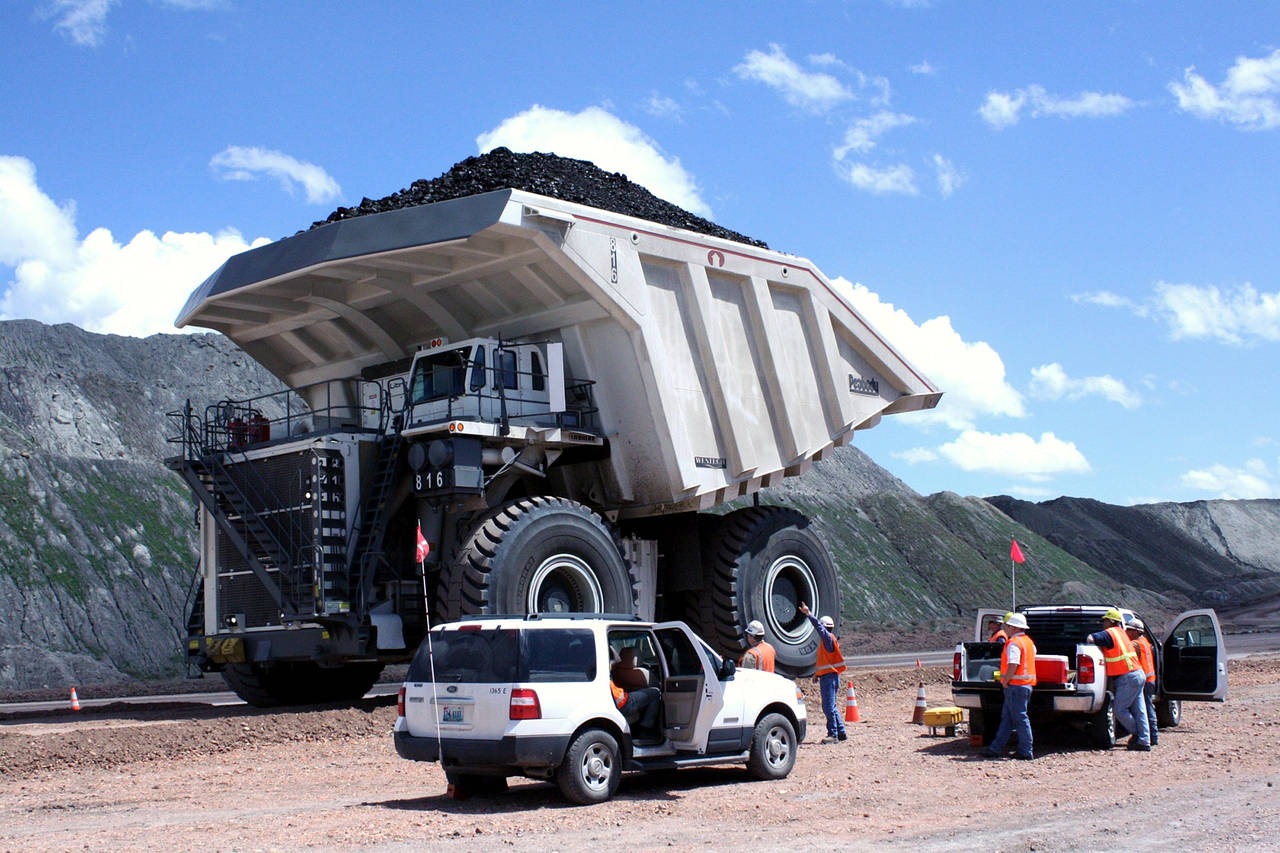
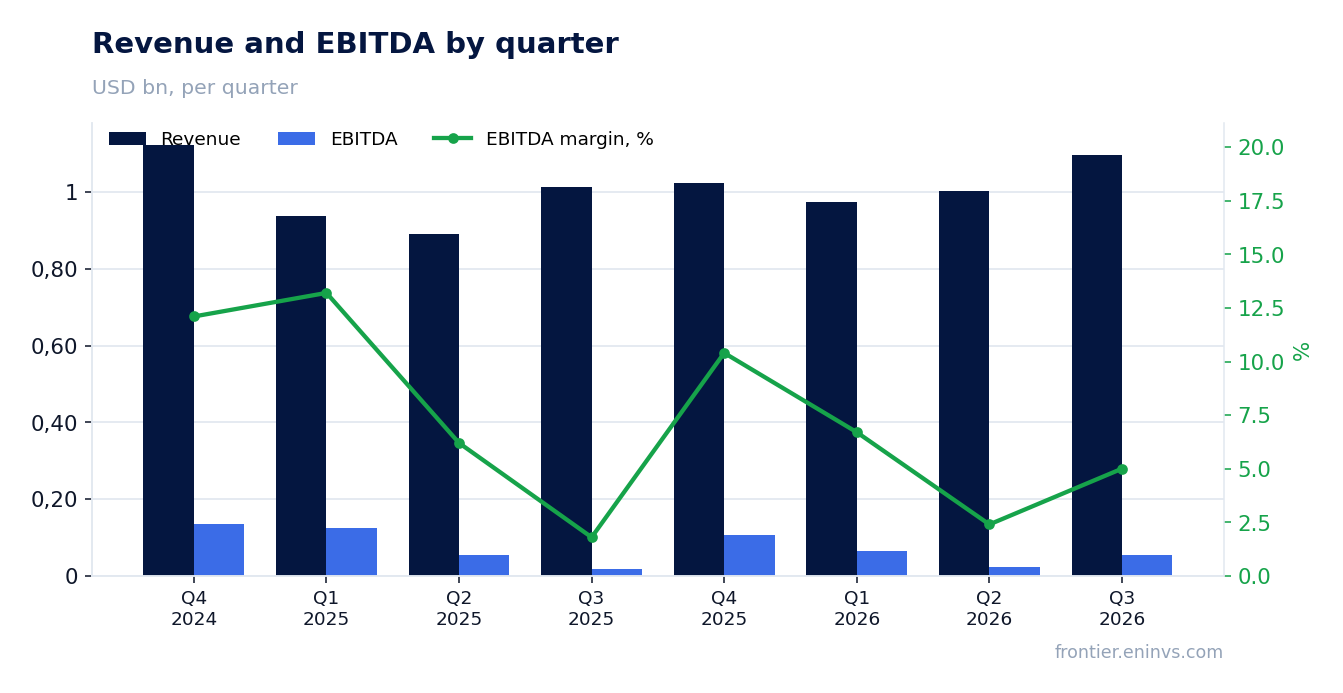
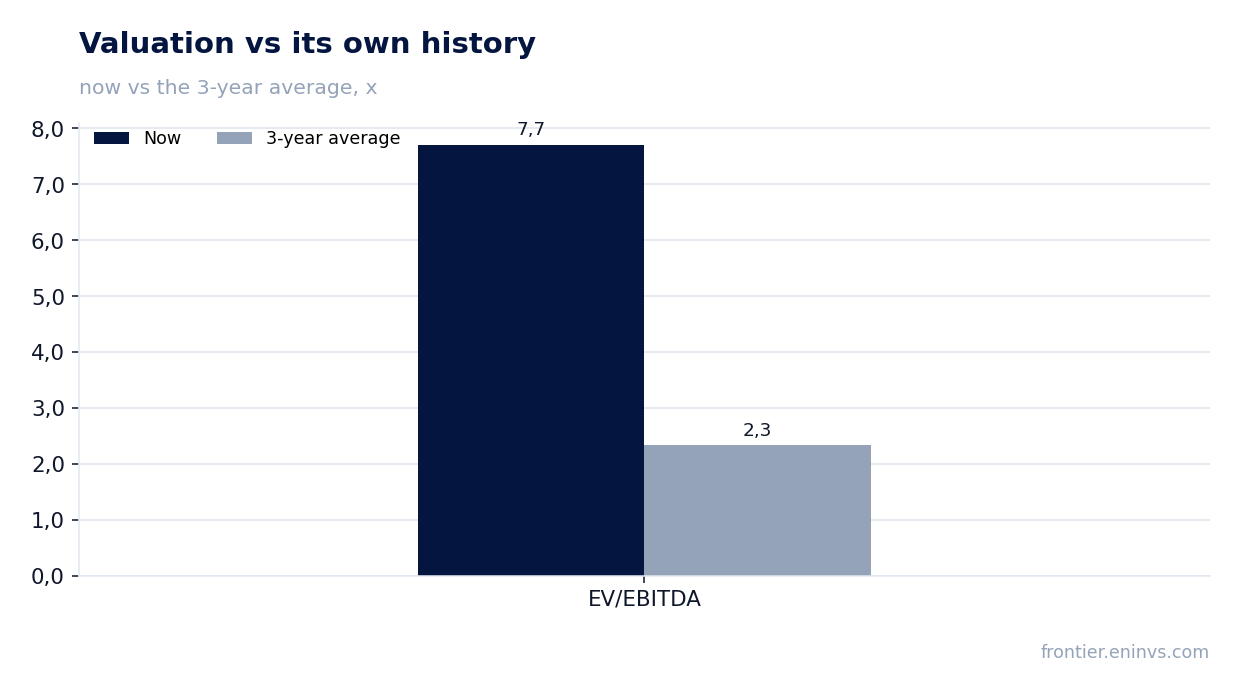
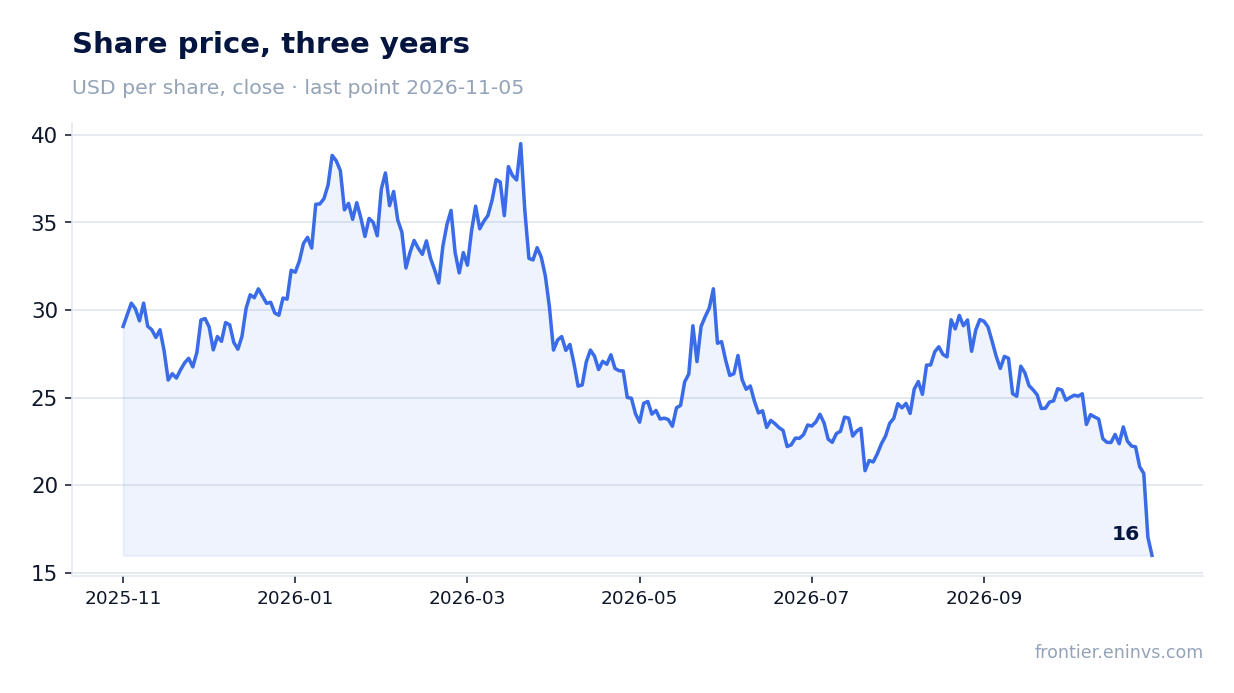
On 4 November Peabody Energy reported results for the third quarter of 2026. The average thermal coal price in the period was 137.1 USD per ton versus 110.8 a year earlier (+23.7%), and coking coal 242.8 USD versus 190.1 (+27.7%). At those prices and last year's volumes and costs revenue would have been 1,266.3 million USD and EBITDA 272.8 million on our calculation; the company reported revenue of 1,096.3 million and EBITDA of 55.2 million – 217.6 million below. The reason is volume: sales fell to 28.3 million tons from 32.5 million (–12.9%), and cost per ton rose in almost every segment. The share fell 17.6% after the release and, at an EV/EBITDA of 7.7 against its own three-year average of 2.3, looks rather unattractive.
Key takeaways
— Both coal prices rose a quarter, yet revenue added only 8.3% – sales volumes fell 12.9%
— At last year's volumes and costs EBITDA would have been 272.8 million USD on our calculation; reported was 55.2 million
— Cost per ton rose everywhere: 50.0% in metallurgical, 14.9% in thermal
— The portal's spot model expected EBITDA of 171 million USD; the company delivered 55.2 million – a 67.7% miss
— At current prices EBITDA is put at 716.5 million USD, and EV/EBITDA on that base is 2.7
— Debt is all but gone: net debt of –0.0 billion USD at 30 September 2026
— The 0.075 USD dividend yields about 1.9% – less than the multiple the share trades at
Attractiveness
Key figures, USD bn
| Metric | Q3 2025 | Q3 2026 | Change |
|---|---|---|---|
| Revenue | 1.01 | 1.10 | +8.3% |
| EBITDA | 0.02 | 0.06 | +196.8% |
| Operating profit | -0.08 | -0.04 | — |
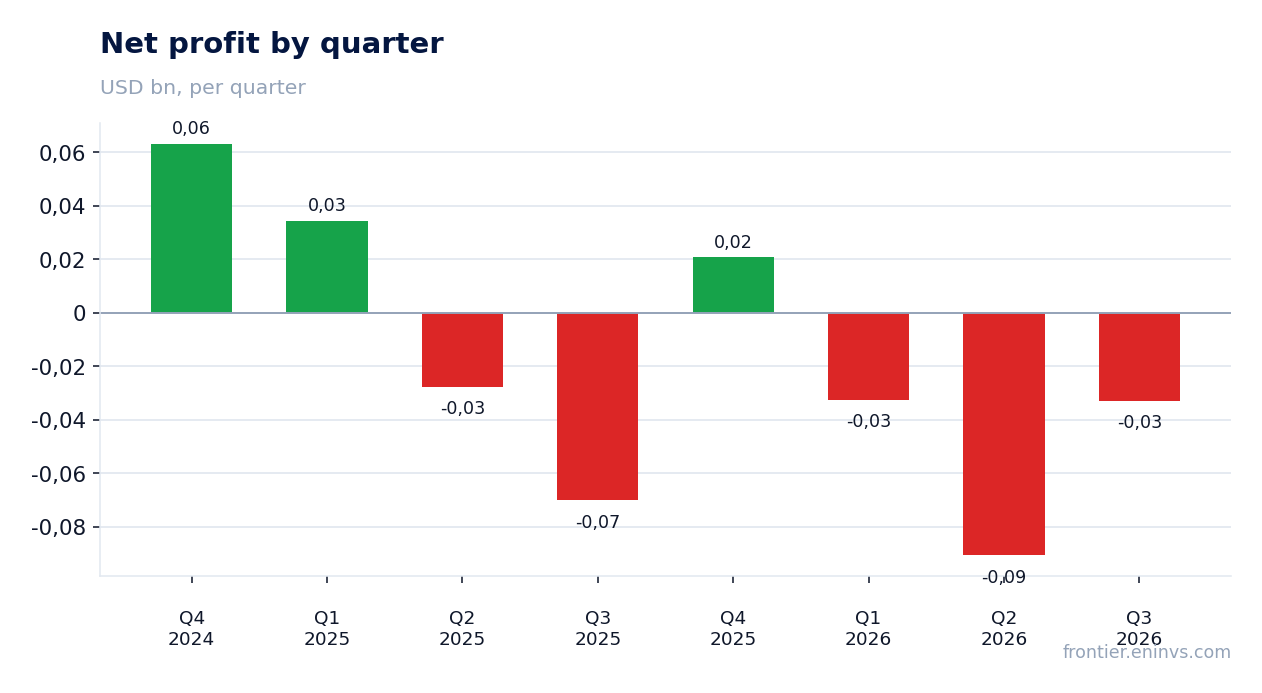
| Net profit | -0.07 | -0.03 | — |
| Operating cash flow | 0.12 | -0.00 | -101.1% |
| Capex | 0.11 | 0.06 | -45.0% |
| EBITDA margin | 1.8% | 5.0% | +3.2 pp |
| Net margin | -6.9% | -3.0% | +3.9 pp |
Both coal prices rose a quarter, yet revenue added only 8.3% – sales volumes fell 12.9%
The average thermal coal price in the third quarter of 2026 was 137.1 USD per ton versus 110.8 a year earlier (+23.7%) and 136.2 in the previous quarter (+0.7%). Coking coal averaged 242.8 USD versus 190.1 (+27.7%) and 238.0 a quarter earlier (+2.0%). Spot on 6 November is higher still: 144.7 and 258.9 USD respectively.
Revenue for the quarter grew 8.3% year on year to 1,096.3 million USD, but the pace slowed from 12.7% in the second quarter. Realised prices rose faster: 31.0% in thermal to 77.6 USD per ton, 35.8% in metallurgical to 164.8 USD. But sales fell to 28.3 million tons from 32.5 million (–12.9%), which ate most of the price gain.
The sharpest falls were thermal exports – 2.0 million tons versus 2.8 (–28.6%) – and the Powder River Basin – 19.6 million tons versus 22.6 (–13.3%). Metallurgical, by contrast, added 4.8% to 2.2 million tons. On our calculation volumes and realised price together would have given +14.1% for own-production sales, yet actual revenue rose only 8.3%.
Commodity prices: period average and now
| Benchmark | Year ago | Q3 2026 | YoY | Spot 2026-11-06 |
|---|---|---|---|---|
| Steam coal AU, USD | 110,8 | 137,1 | +23,7% | 144,7 |
| Coking coal, USD | 190,1 | 242,8 | +27,7% | 258,9 |
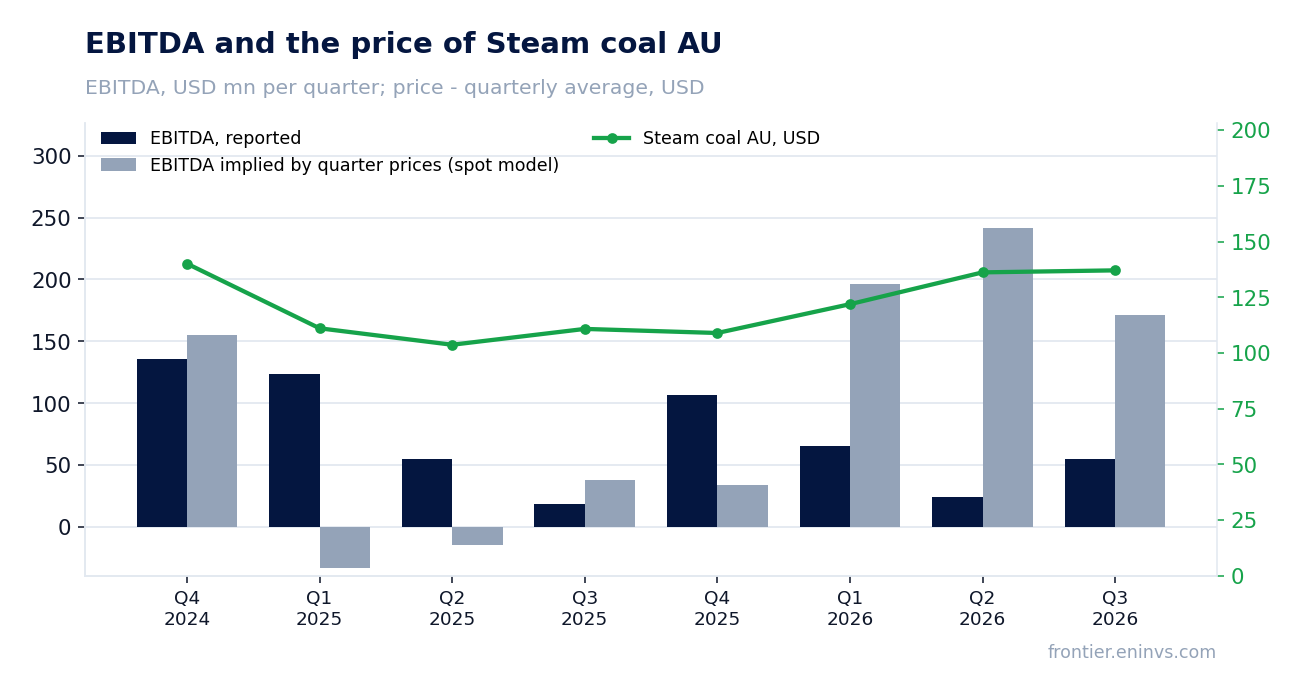
At last year's volumes and costs EBITDA would have been 272.8 million USD on our calculation; reported was 55.2 million
Holding third-quarter 2025 volumes and costs and moving only third-quarter 2026 prices, revenue would have been 1,266.3 million USD (price effect +254.2 million, +25.1%) and EBITDA 272.8 million on our calculation. Reported revenue was 170.0 million lower (–13.4%), EBITDA 217.6 million lower (–79.8%).
The gap is explained by volumes and costs. Sales fell 12.9%, and cost per ton rose: 50.0% in metallurgical to 162.4 USD, 14.9% in thermal to 56.6 USD, 16.9% in the Powder River Basin to 12.9 USD. In metallurgical the margin per ton compressed to 2.38 USD from 13.03 a year earlier.
The portal's spot model, re-priced from the average of the previous four quarters, expected EBITDA of 171 million USD and revenue of 1,143.9 million; actual was 55.2 million (–67.7% versus the model) and 1,096.3 million (–4.2%). The EBITDA deviation in the four prior periods was –50.9%, +216.4%, –66.7% and –90.1%, so the model has long struggled to capture the company's result.
What the prices implied and what the company earned
| Base (Q3 2025) | Implied at period prices | Reported | Reported vs implied | |
|---|---|---|---|---|
| Revenue, USD mn | 1 012 | 1 266 | 1 096 | -13,4% |
| EBITDA, USD mn | 18,6 | 272,8 | 55,2 | -79,8% |
| EBITDA, portal spot model, USD mn | — | 171,0 | 55,2 | -67,7% |
Cost per ton rose everywhere: 50.0% in metallurgical, 14.9% in thermal
Cost per ton in metallurgical rose to 162.4 USD from 108.3 a year earlier. The company attributes this to working through higher-cost faulted conditions at the Centurion mine: October output there was about 45 thousand tons, and fourth-quarter sales are guided at 0.3–0.5 million tons. Thermal cost rose to 56.6 USD from 49.2, Powder River Basin to 12.9 from 11.1, and other U.S. thermal to 52.2 from 49.9.
The thermal margin per ton nevertheless rose to 21.05 USD from 10.02 a year earlier: realised price added 31.0% while cost added 14.9%. In metallurgical the price rose 35.8% but cost 50.0%, and the margin compressed to 2.38 USD from 13.03.
For the fourth quarter the company guides thermal cost at 46–51 USD per ton and metallurgical at 150–160 USD – cost pressure persists. The full-year metallurgical cost estimate was raised by about 15 USD per ton on lower Centurion output.
Production, realised price and unit cost (company release)
| Metric | Year ago | Reported period | YoY |
|---|---|---|---|
| Total tons sold, million tons | 32,50 | 28,30 | -12,9% |
| Seaborne Thermal, million tons | 4,10 | 3,10 | -24,4% |
| Seaborne Thermal — Revenue per Ton, $ per ton | 59,25 | 77,63 | +31,0% |
| Seaborne Thermal Export — Avg. Realized Price per Ton, $ per ton | 76,54 | 100,37 | +31,1% |
| Seaborne Thermal Domestic — Avg. Realized Price per Ton, $ per ton | 24,62 | 36,15 | +46,8% |
| Seaborne Thermal — Costs per Ton, $ per ton | 49,23 | 56,58 | +14,9% |
| Seaborne Metallurgical — Costs per Ton, $ per ton | 108,31 | 162,45 | +50,0% |
| Powder River Basin — Costs per Ton, $ per ton | 11,07 | 12,94 | +16,9% |
| Other U.S. Thermal — Costs per Ton, $ per ton | 49,90 | 52,18 | +4,6% |
At current prices EBITDA is put at 716.5 million USD, and EV/EBITDA on that base is 2.7
On the portal's spot model at today's coal prices annual EBITDA would be 716.5 million USD against 251.3 million over the last twelve months (+185.1%). On that base EV/EBITDA is 2.7 and net debt to EBITDA is –0.02. For a commodity producer this is the base valuation should start from: LTM reflects past prices, not current ones.
The market, however, looks at LTM: EV/EBITDA over the last twelve months is 7.7 against its own three-year average of 2.3, or 231% above. On this multiple the share is more expensive than its own history, and that explains the 17.6% fall on the release day and a further 22.6% by 5 November.
The gap between the two bases is the central question: if prices hold at today's level and volumes recover, the multiple on current EBITDA quickly converges to 2.7. If output stays at the third-quarter level, LTM earnings will not catch up with the price. Reserve life is 15.7 years at the current production rate.
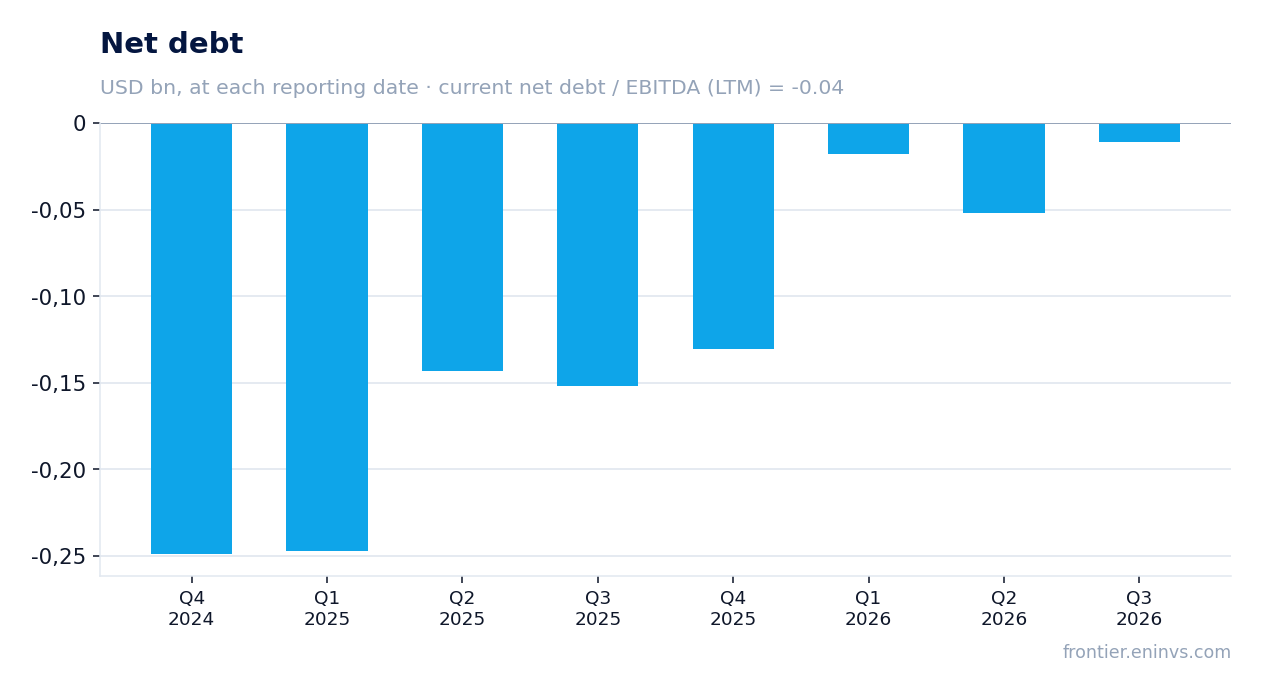
Debt is all but gone: net debt of –0.0 billion USD at 30 September 2026
Net debt at 30 September 2026 was –0.0 billion USD against –0.1 billion at 30 June 2026 (change +0.0 billion) and –0.2 billion at 30 September 2025 (+0.1 billion over the year). Net debt to EBITDA over the last twelve months is –0.04. Cash was 434 million USD and liquidity 887 million.
Operating cash flow for the quarter was negative at –1.4 million USD against plus 122.0 million a year earlier. Capital expenditure was 59.8 million USD against 108.8 million, so the company cut investment: the full-year capex target was reduced by 40 million USD, including about 30 million at Centurion.
During the quarter the company repurchased 38.9 million USD of 2028 convertible notes for 58.1 million in cash, effectively repurchasing 0.7 million shares, and announced redemption of the remaining 39.9 million in November 2026. Together with the second-quarter repurchase, 5.7 million shares were effectively repurchased in 2026. The repurchase cost 3.3 million USD, and a further 20.7 million was recognised as a derivative liability.
The 0.075 USD dividend yields about 1.9% – less than the multiple the share trades at
The board declared a quarterly dividend of 0.075 USD per share, payable 9 December 2026 to holders of record on 19 November. The trailing twelve-month yield is 1.87%. That is modest for a company with almost no debt and positive cash generation.
The reason is the loss: net loss for the quarter was 32.8 million USD, or –0.27 USD per diluted share, against –70.1 million a year earlier. Return on equity is –4.1%. The dividend is covered not by profit but by the cash balance, and its sustainability depends on EBITDA recovery.
A 1.87% yield is below what an investor could get on risk-free instruments, and it is not the dividend one holds the share for. The company returns capital mainly through buybacks – 5.7 million shares in 2026 – rather than payouts.
Valuation on the latest reported figures
| Metric | Value |
|---|---|
| Market cap | 1.95 bn USD |
| EV/EBITDA (LTM) | 7.7 |
| P/B | 0.54 |
| Net debt / EBITDA (LTM) | -0.04 |
| Operating cash flow (LTM) | 0.10 bn |
| ROE | -4.1% |
| Dividend yield (12m) | 1.9% |
| EV/EBITDA, 3-year average | 2.3 |
Bottom line
The strength of the report remains price: both coals rose a quarter, and the thermal segment doubled its margin per ton. But volumes fell 12.9%, costs rose everywhere, and EBITDA came in 79.8% below what last year's base would have produced at current prices. Debt is all but gone, but operating cash flow is negative and the 1.87% dividend yield does not compensate for the risk. At an EV/EBITDA of 7.7 against its own three-year average of 2.3 the share is more expensive than its history; on the portal's spot model the upside is –35%. The verdict is rather unattractive: a re-rating needs volume recovery and lower Centurion costs.
Open the company's financial profile BTU →
See also: market overview · valuation map · stock screeners