CrossAmerica Partners: revenue up 22.9% on expensive fuel, but profit down 35.5%
On November 4, CrossAmerica Partners reported third-quarter 2026 results. Revenue rose 22.9% year on year to $1,194.6 million, but EBITDA fell 15.7% to $40.6 million and net profit dropped 35.5% to $8.8 million. The gap is explained by expensive fuel inflating revenue without adding profit: volumes fell, and one-off gains from real estate sales shrank from $7.4 million to $2.4 million. At an EV/EBITDA of 8.9 against its own three-year average of 10.4 the stock looks cheaper than its history, but the falling margin and high leverage keep it from being attractive.
Key takeaways
— Revenue rose 22.9%, but all the growth came from expensive fuel, not volumes
— EBITDA fell 15.7% because margin per gallon did not offset the drop in sales
— Net profit shrank 35.5% due to one-off gains from real estate sales
— Debt of $809.6 million is 4.51x EBITDA, while the credit covenant is already at 3.72
— The $0.525 per unit dividend yields 10.4%, but coverage fell to 1.09x
— EV/EBITDA of 8.9 is below its own three-year average of 10.4 – the stock is cheaper than its history
Attractiveness
Key figures, USD bn
| Metric | Q3 2025 | Q3 2026 | Change |
|---|---|---|---|
| Revenue | 0.97 | 1.19 | +22.9% |
| EBITDA | 0.05 | 0.04 | -15.7% |
| Operating profit | 0.03 | 0.02 | -15.6% |
| Net profit | 0.01 | 0.01 | -35.5% |
| Operating cash flow | 0.02 | 0.02 | +0.4% |
| Capex | 0.01 | 0.01 | +7.2% |
| EBITDA margin | 5.0% | 3.4% | -1.6 pp |
| Net margin | 1.4% | 0.7% | -0.7 pp |
Revenue rose 22.9%, but all the growth came from expensive fuel, not volumes
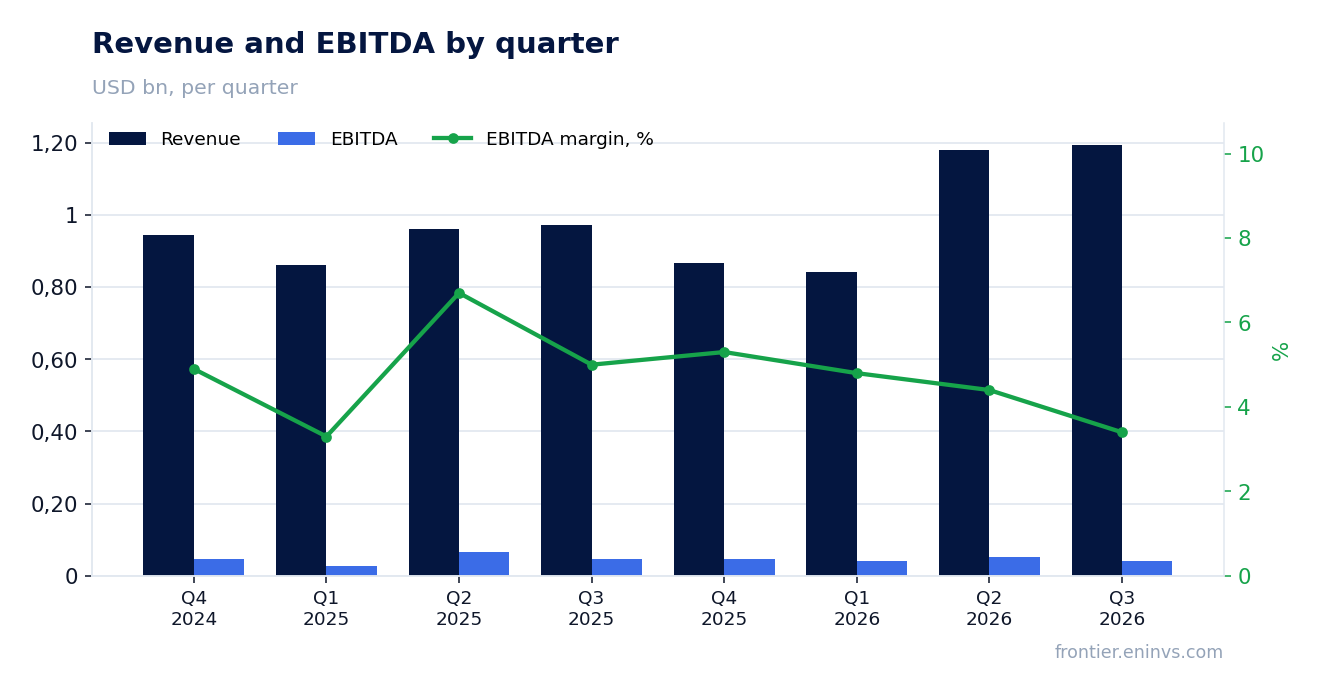
Revenue in the third quarter of 2026 was $1,194.6 million, up 22.9% year on year. That is roughly the same pace as in the second quarter (+22.6%) – growth neither accelerated nor slowed, but stayed at the same level.
All the increase came from fuel prices, not volumes. Retail fuel sales fell 9% to 128.6 million gallons, wholesale – 8% to 162.8 million gallons. Retail margin per gallon rose 5% to $0.404, but that was not enough to offset the drop in sales.
The volume decline is explained by the sale of some stations under the real estate optimisation programme: the average number of retail sites fell from 592 to 549, and wholesale – from 997 to 977. The company kept fuel supply to the sold properties, but part of the sales revenue went with them.
EBITDA fell 15.7% because margin per gallon did not offset the drop in sales
EBITDA for the third quarter of 2026 was $40.6 million against $48.1 million a year earlier – a 15.7% decline. The EBITDA margin fell from 5.0% to 3.4%.
The main reason is the drop in volumes in both segments. Retail fuel gross profit fell 8% to $37.6 million, wholesale – 9% to $14.4 million. Wholesale margin per gallon stayed at $0.088, meaning no growth.
The decline was partly offset by merchandise and cost cuts. Merchandise gross profit rose 2% to $32.8 million, and its margin – from 28.9% to 30.3%. Operating expenses in retail fell by $0.2 million, in wholesale – by $1.1 million. But that was not enough to keep EBITDA at last year's level.
Net profit shrank 35.5% due to one-off gains from real estate sales
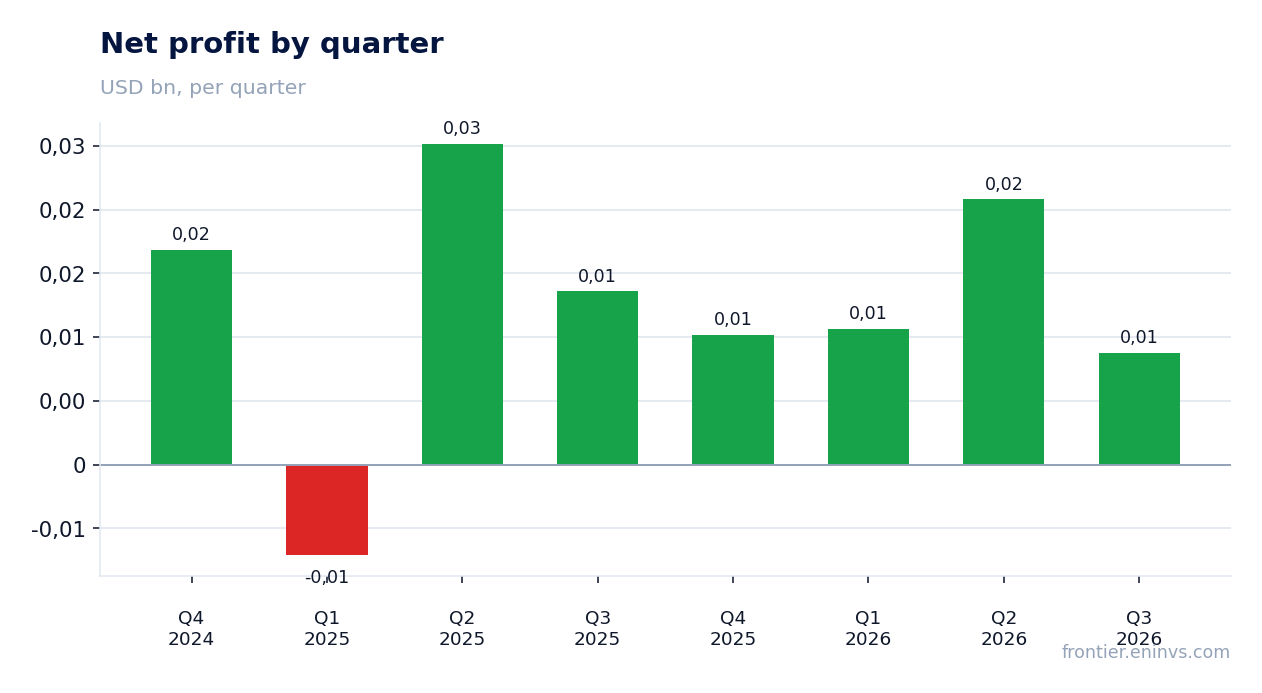
Net profit for the third quarter of 2026 was $8.8 million against $13.6 million a year earlier – a 35.5% decline. The net margin fell from 1.4% to 0.7%.
Besides the EBITDA decline, profit was pressured by lower one-off gains from real estate sales: $2.4 million in the third quarter of 2026 against $7.4 million a year earlier. For the nine months of 2026 gains from sales were $10.3 million against $42.5 million in the same period of 2025.
Interest on the credit facility rose to $12.2 million from $11.8 million, and income tax – to $3.0 million from $2.9 million. As a result, profit per unit fell to $0.21 from $0.34 a year earlier.
Debt of $809.6 million is 4.51x EBITDA, while the credit covenant is already at 3.72
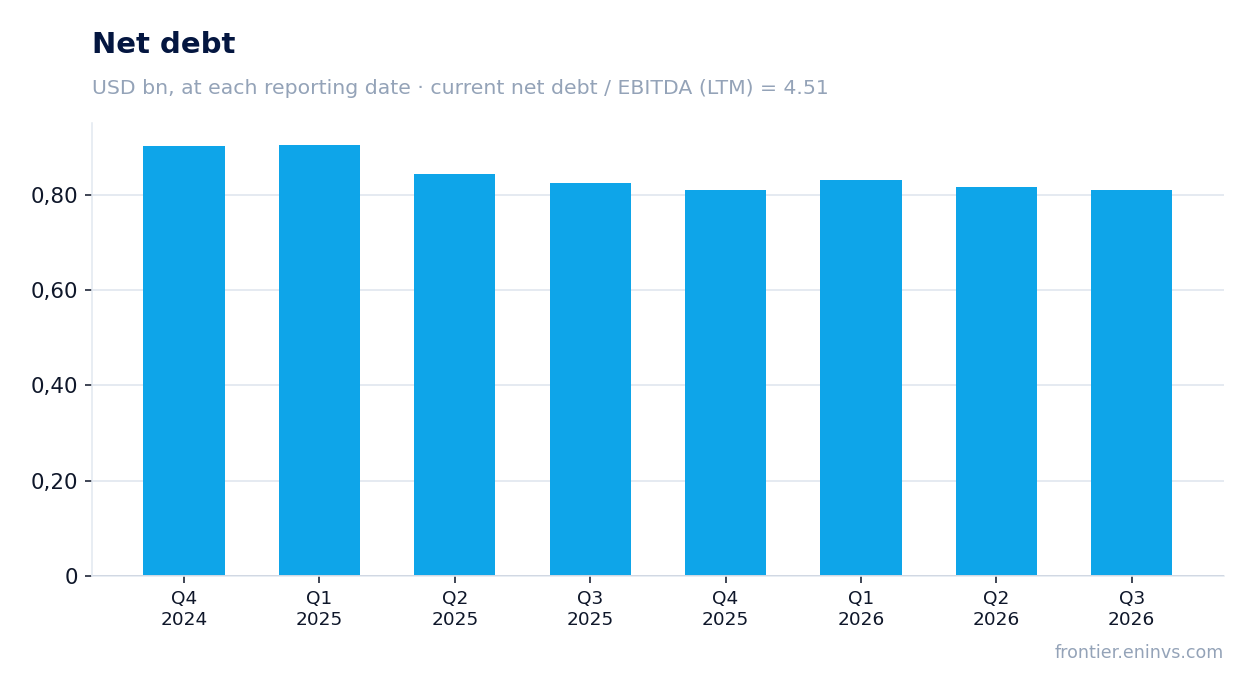
Net debt as of September 30, 2026 was $809.6 million – the same as on June 30, 2026 and on September 30, 2025. The level has not changed over the year.
The ratio of net debt to EBITDA over the last 12 months is 4.51. At the same time, the covenant under the credit agreement, which is calculated differently, is 3.72 against 3.56 a year earlier. The company is in compliance, but the headroom is thin.
Debt servicing is expensive: interest expense for the quarter was $12.2 million, for the nine months – $34.3 million. Operating cash flow for the quarter was $24.5 million, enough to cover interest, but with little left over.
The $0.525 per unit dividend yields 10.4%, but coverage fell to 1.09x
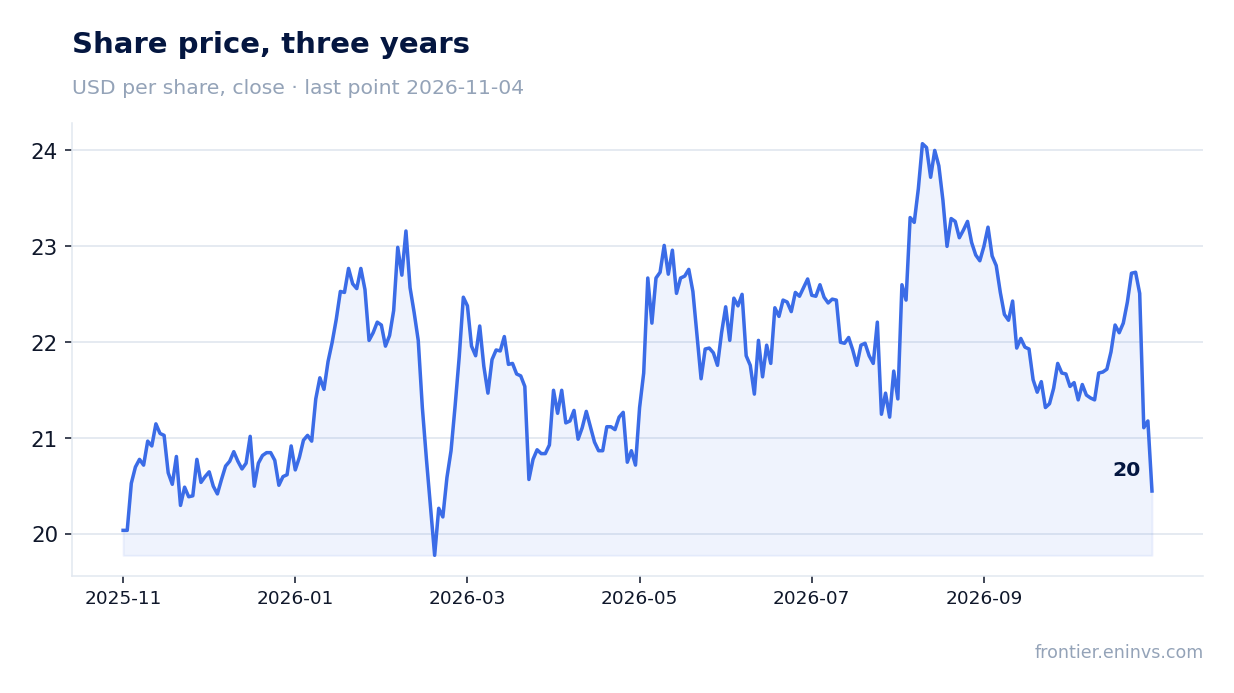
The board declared a quarterly distribution of $0.525 per unit for the third quarter of 2026. Payment will be made on November 12, 2026. At a share price of $21.18 the yield is 10.4%.
Distribution coverage by distributable cash flow for the quarter fell to 1.09x from 1.39x a year earlier. Over the last 12 months coverage is 1.32x against 1.00x a year earlier, meaning the annual picture is better than the single quarter.
Our estimate: if the current quarterly distribution is maintained, the annual payout will be $2.10 per unit. That is about 10% of the price, above the yield we consider fair for a company with this leverage. The risk of a cut is linked to falling EBITDA and rising capex: sustaining capex rose to $5.3 million for the quarter from $1.9 million a year earlier.
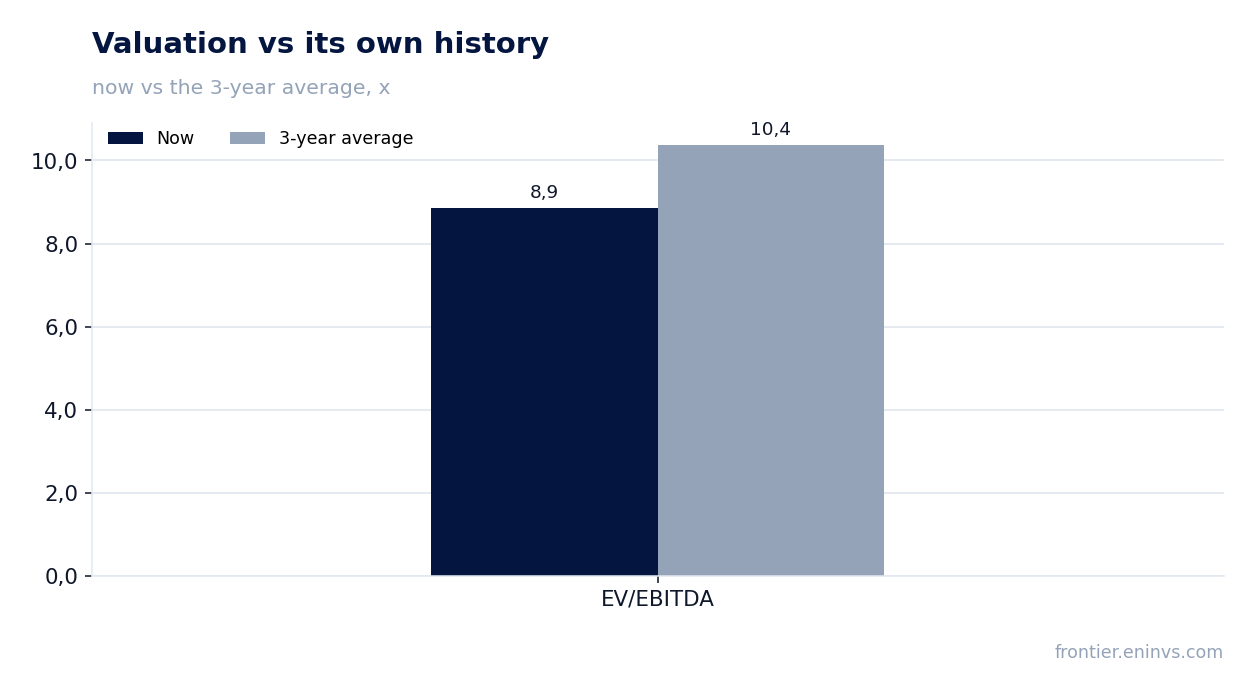
EV/EBITDA of 8.9 is below its own three-year average of 10.4 – the stock is cheaper than its history
The EV/EBITDA multiple over the last 12 months is 8.9. That is 15% below its own three-year average of 10.4. On this measure the stock is cheaper than it was on average over three years.
The P/E over the last 12 months is 15.5. At the same time ROE is negative (–36.7%) due to a deficit of equity, so P/E says little here.
On the portal's model, which reprices EBITDA at current commodity prices at the target EV/EBITDA, the fair value of the stock is 33% below the current price. This is our own estimate, not a market consensus.
Valuation on the latest reported figures
| Metric | Value |
|---|---|
| Market cap | 0.78 bn USD |
| P/E (LTM) | 15.5 |
| EV/EBITDA (LTM) | 8.9 |
| Net debt / EBITDA (LTM) | 4.51 |
| Operating cash flow (LTM) | 0.12 bn |
| ROE | -36.7% |
| Dividend yield (12m) | 10.4% |
| EV/EBITDA, 3-year average | 10.4 |
Bottom line
The strong side of the report remains merchandise: its margin rose to 30.3% and profit by 2% despite fewer stores. But that did not offset the decline in the fuel business, where volumes fell 8–9% and wholesale margin per gallon did not grow. One-off gains from real estate sales shrank from $7.4 million to $2.4 million, and that, together with the EBITDA decline, produced the 35.5% drop in net profit. The dividend yielding 10.4% looks generous, but its quarterly coverage fell to 1.09x, and debt at 4.51x EBITDA leaves no cushion. The stock is cheaper than its history on EV/EBITDA, but the falling margin and high leverage make it unattractive to buy at the current level.
Open the company's financial profile CAPL →
See also: market overview · valuation map · stock screeners